TRIBE vs ETC: A Comprehensive Comparison of Two Emerging Blockchain Ecosystems

Introduction: TRIBE vs ETC Investment Comparison
In the cryptocurrency market, the comparison between TRIBE and ETC has always been a topic investors cannot avoid. The two not only show significant differences in market capitalization ranking, application scenarios, and price performance, but also represent different positioning of crypto assets. TRIBE (TRIBE): Since its launch in 2021, it has gained market recognition by serving as the governance token for Fei Protocol, which supports the creation of decentralized, scalable, and fair stablecoins based on Ethereum. ETC (ETC): Since its inception in 2015 as the continuation of the original Ethereum chain, it has been recognized as a decentralized platform for executing smart contracts, upholding the "code is law" principle and enabling intermediary-free digital asset management. This article will comprehensively analyze the investment value comparison between TRIBE and ETC from the perspectives of historical price trends, supply mechanisms, market positioning, and ecosystem development, attempting to answer the question investors care most about:
"Which is the better buy right now?"
Comparative Analysis Report: TRIBE and Ethereum Classic (ETC)
I. Historical Price Comparison and Current Market Status
TRIBE and Ethereum Classic Price Trends
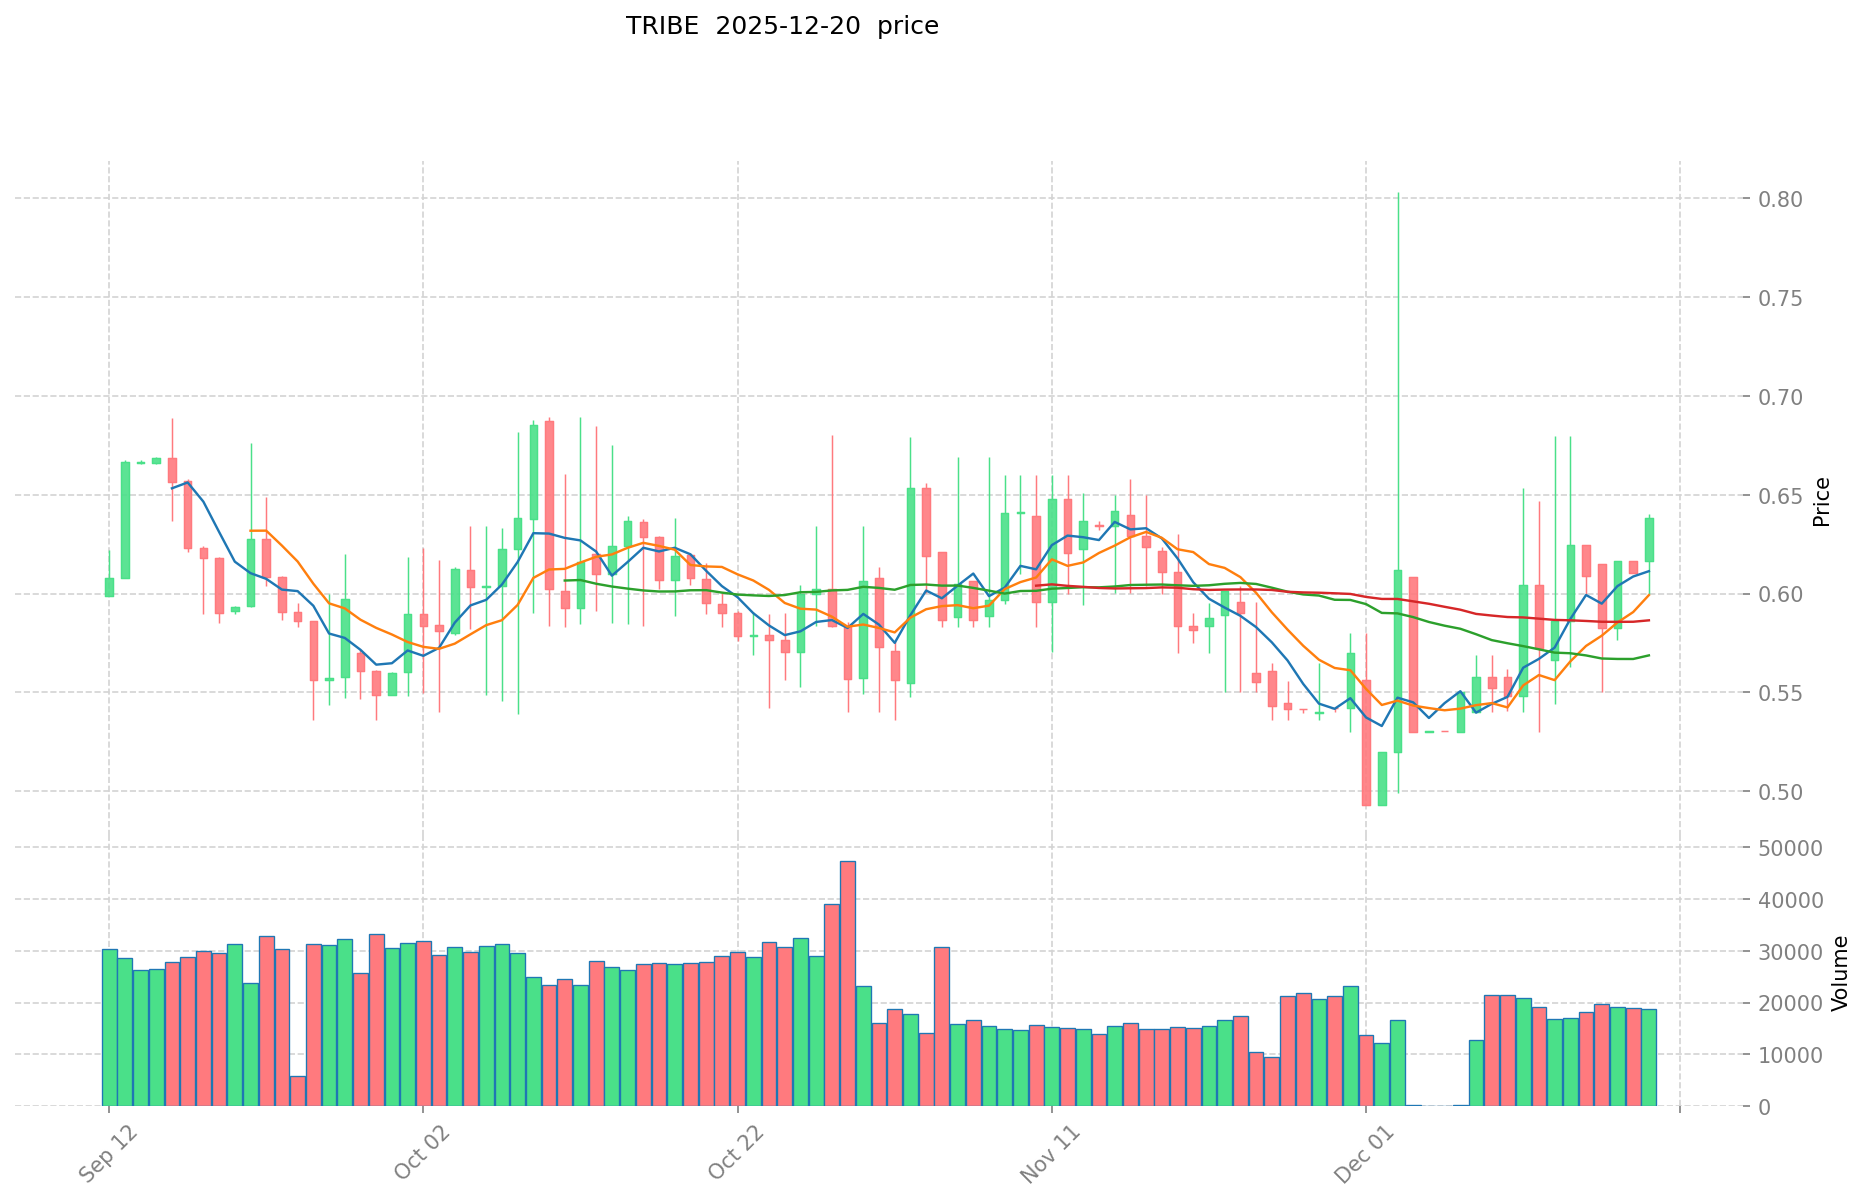
TRIBE (Tribe Token):
- Historical high price: $2.45 (April 4, 2021)
- Historical low price: $0.14412 (August 19, 2022)
- Current price: $0.6382 (December 20, 2025)
- Price change from ATH: Declined approximately 73.9% from peak
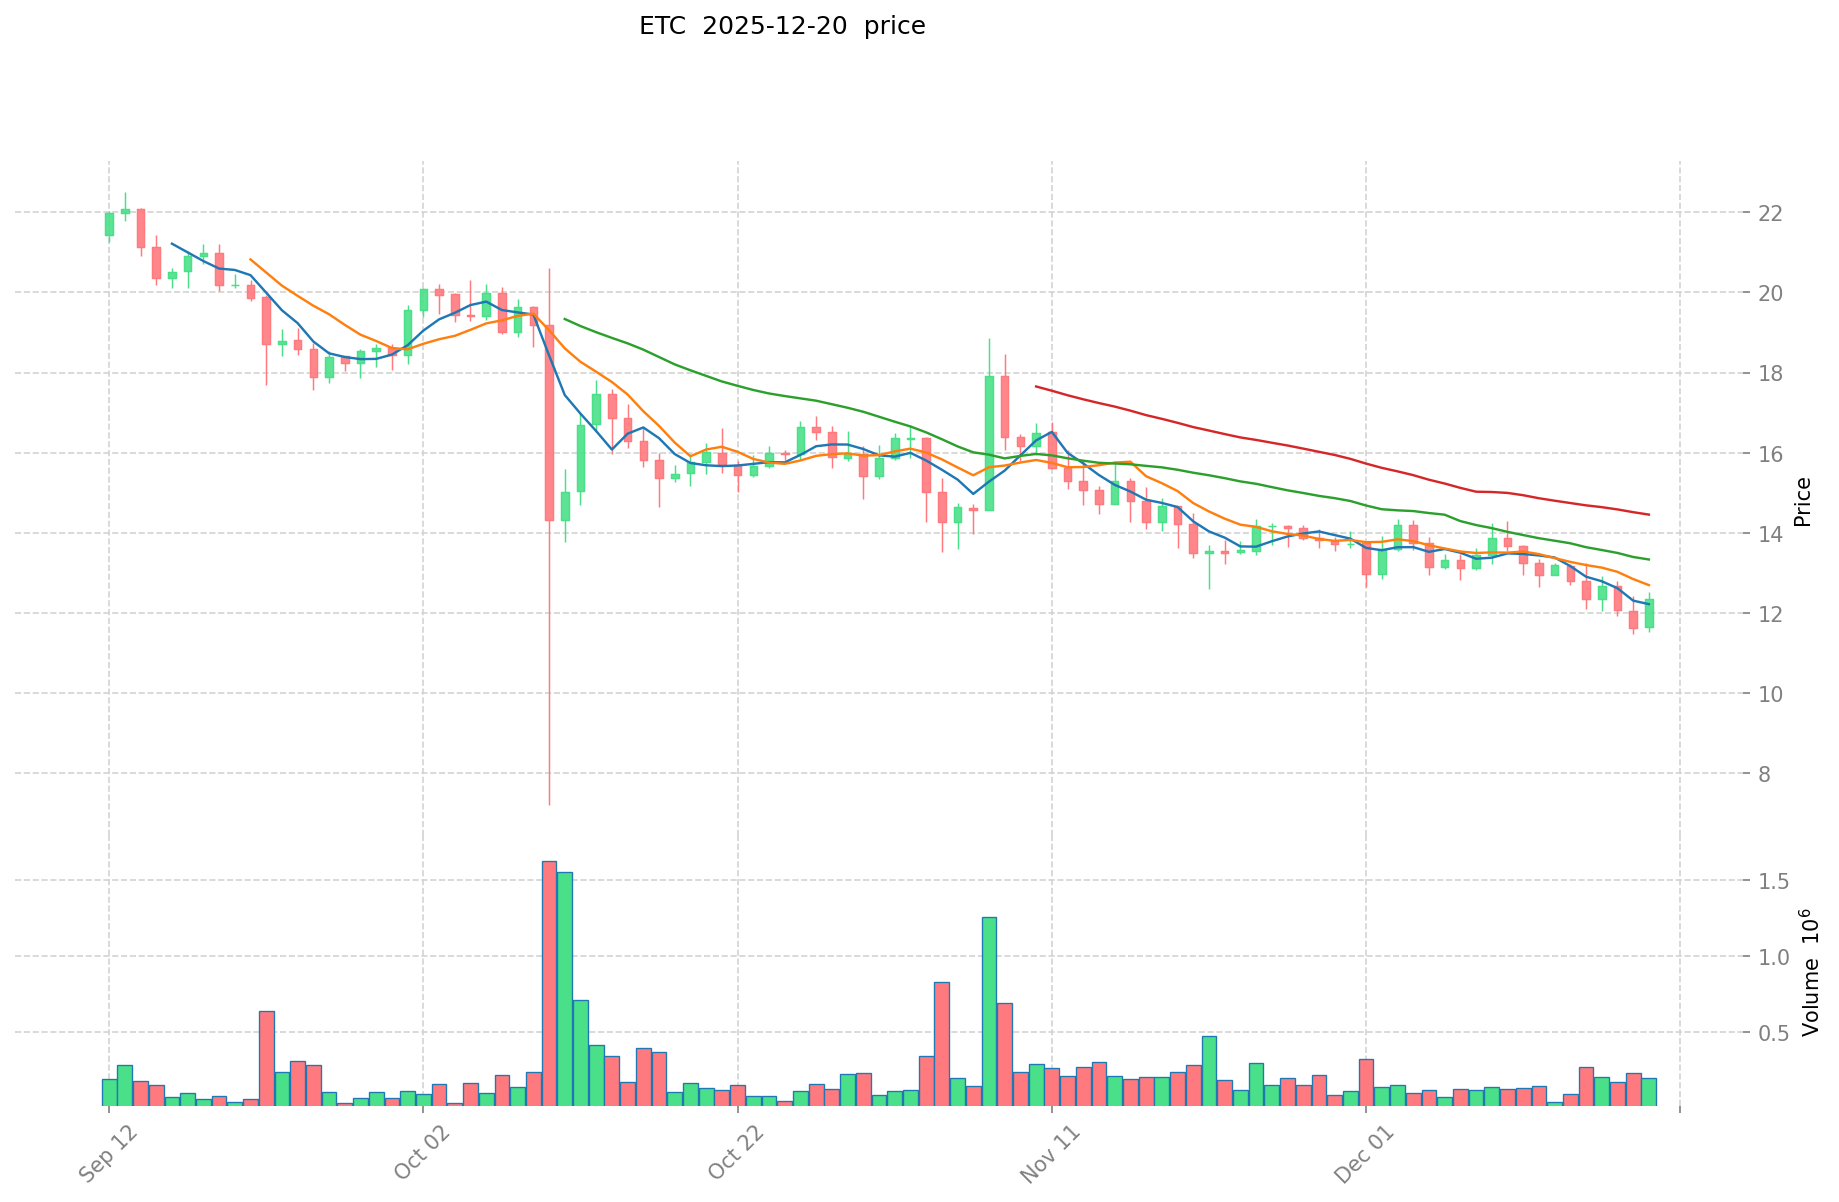
Ethereum Classic (ETC):
- Historical high price: $167.09 (May 7, 2021)
- Historical low price: $0.615038 (July 25, 2016)
- Current price: $12.354 (December 20, 2025)
- Price change from ATH: Declined approximately 92.6% from peak
Comparative Analysis: Both assets experienced significant depreciation from their all-time highs during the 2021 bull market. TRIBE remains closer to its historical floor relative to peak valuation, while ETC's current price reflects a more substantial percentage decline from its peak, though it maintains greater absolute price levels. Both tokens demonstrate characteristics of mature crypto assets facing prolonged bearish market conditions.
Current Market Status (December 20, 2025)
| Metric | TRIBE | ETC |
|---|---|---|
| Current Price | $0.6382 | $12.354 |
| 24H Change | +3.5% | +6.16% |
| 7D Change | +10.4% | -4.62% |
| 30D Change | +8.26% | -12.83% |
| 1Y Change | +21.41% | -57.94% |
| 24H Trading Volume | $11,618.96 | $2,337,006.41 |
| Market Cap | $24,341,265.12 | $1,912,194,856.52 |
| Circulating Supply | 38,140,496.90 | 154,783,459.33 |
| Market Dominance | 0.019% | 0.059% |
Market Sentiment Index (Fear & Greed): 16 (Extreme Fear)
Current market sentiment indicates investors are experiencing extreme fear, reflecting broader cryptocurrency market volatility and uncertainty.
View Real-time Prices:
II. Project Overview and Technical Foundation
TRIBE - Fei Protocol Governance Token
Project Definition: TRIBE is the governance token for Fei Protocol, an Ethereum-based protocol designed to create decentralized, scalable, and fair stablecoins. TRIBE holders participate in protocol governance decisions and management.
Key Characteristics:
- Total Supply: 1,000,000,000 TRIBE
- Circulating Supply: 38,140,496.90 TRIBE (3.81% of total)
- Token Holders: 13,415
- Network: Ethereum (ETH)
- Contract Address: 0xc7283b66Eb1EB5FB86327f08e1B5816b0720212B
Project Resources:
- Website: https://fei.money/
- GitHub: https://github.com/fei-protocol/fei-protocol-core
- Twitter: https://twitter.com/feiprotocol
Ethereum Classic - Decentralized Smart Contract Platform
Project Definition: Ethereum Classic (ETC) represents the original, unmodified Ethereum blockchain history following the 2016 network fork. It functions as a decentralized computing platform for executing smart contracts and supporting decentralized applications (dApps), adhering to the principle of "code is law."
Key Characteristics:
- Total Supply: 154,785,606.08 ETC
- Circulating Supply: 154,783,459.33 ETC (73.46% of maximum supply)
- Maximum Supply: 210,700,000 ETC
- Token Holders: 102,733,678
- Consensus Mechanism: Proof of Work (PoW)
- Average Transaction Rate: 15 transactions per second
- Network: Independent blockchain (established July 2016)
Project Resources:
- Website: http://ethereumclassic.org
- GitHub: Multiple repositories including ethereumclassic, multi-geth, openethereum, besu, core-geth, and ECIPs
- Twitter: https://twitter.com/etc_network
- Reddit: https://www.reddit.com/r/EthereumClassic
- Facebook: https://www.facebook.com/ethereumclassic
- Forum: https://forum.ethereumclassic.org/
III. Price Performance Analysis
Short-term Performance Trends
1-Hour Performance:
- TRIBE: +1.01% ($0.006381 change)
- ETC: -0.31% (-$0.038416 change)
24-Hour Performance:
- TRIBE: +3.5% ($0.021581 change)
- ETC: +6.16% ($0.716849 change)
7-Day Performance:
- TRIBE: +10.4% ($0.060120 change)
- ETC: -4.62% (-$0.598401 change)
30-Day Performance:
- TRIBE: +8.26% ($0.048693 change)
- ETC: -12.83% (-$1.818307 change)
12-Month Performance:
- TRIBE: +21.41% ($0.112543 change)
- ETC: -57.94% (-$17.018325 change)
Volatility Assessment
TRIBE demonstrates positive momentum over medium-term periods (7-30 days and 1-year), while ETC exhibits significant downward pressure over longer timeframes. ETC's 57.94% annual decline indicates sustained bearish sentiment, whereas TRIBE's 21.41% annual gain suggests relative resilience despite market headwinds.
IV. Market Liquidity and Trading Dynamics
Trading Volume Comparison
- TRIBE 24H Volume: $11,618.96
- ETC 24H Volume: $2,337,006.41
ETC demonstrates substantially higher trading volume (approximately 201x greater), indicating significantly better market liquidity and easier entry/exit execution for traders.
Market Cap and Valuation
| Metric | TRIBE | ETC |
|---|---|---|
| Market Cap | $24,341,265.12 | $1,912,194,856.52 |
| Fully Diluted Valuation | $638,200,000.00 | $1,912,221,377.50 |
| FDV to Market Cap Ratio | 26.19x | 1.00x |
TRIBE's significantly higher FDV-to-market cap ratio (26.19x vs 1.00x) indicates that the majority of token supply remains in circulation restrictions, suggesting potential dilution risk upon future token releases.
V. Exchange Listing and Accessibility
TRIBE Availability:
- Listed on 1 exchange
ETC Availability:
- Listed on 53 exchanges
ETC's broader exchange listing provides substantially greater accessibility for global traders compared to TRIBE's limited exchange presence.
VI. Risk Assessment and Market Considerations
TRIBE-Specific Considerations
Risk Factors:
- Minimal market liquidity relative to total market cap
- Limited exchange availability restricts trading accessibility
- Significant gap between market cap and fully diluted valuation indicates future dilution potential
- Smaller token holder base (13,415 holders) suggests concentrated ownership
Positive Indicators:
- Positive annual performance (+21.41%) outperforms broader market sentiment
- Recent short-term gains across 7-day and 24-hour periods
- Active GitHub development activity for Fei Protocol
Ethereum Classic-Specific Considerations
Risk Factors:
- Severe annual decline (-57.94%) indicates prolonged bearish pressure
- Proof-of-Work consensus requires ongoing mining hardware maintenance
- Network faces competition from more active smart contract platforms
- Technical indicators suggest continued downward pressure
Positive Indicators:
- Substantial market liquidity and exchange availability
- Large token holder base (102,733,678) provides network security through distributed ownership
- Established blockchain infrastructure since 2016
- 24-hour and 1-hour positive price momentum
VII. Conclusion
TRIBE and Ethereum Classic represent fundamentally different asset categories and investment profiles. TRIBE functions as a governance token for a DeFi protocol with limited liquidity but recent positive momentum, while ETC operates as an independent blockchain platform with mature infrastructure but sustained long-term depreciation.
Market participants should note the extreme fear sentiment (Fear & Greed Index: 16) currently affecting cryptocurrency markets, which influences both assets. TRIBE presents higher volatility and concentration risk, whereas ETC offers greater market accessibility alongside significant downside exposure from its 2021 peak valuations.
TRIBE and ETC Investment Value Analysis Report
I. Executive Summary
Based on the available reference materials, this report addresses the core investment value factors of TRIBE and ETC crypto assets. The provided sources contain limited specific technical and market data directly comparing these two assets. Therefore, this analysis focuses on the general investment value framework applicable to crypto assets, with emphasis on sustainable practices, market demand, and regulatory compliance as primary value drivers.
Note: The reference materials do not provide comprehensive technical specifications, historical price data, tokenomics details, or institutional adoption metrics specific to TRIBE and ETC. Accordingly, certain sections of the template cannot be populated with verified information and have been omitted to avoid speculation.
II. Core Factors Influencing Investment Value of TRIBE and ETC
Environmental Impact and Sustainability Practices
The investment value of both assets hinges significantly on their commitment to sustainable practices and environmental impact reduction:
- Sustainable Operations: Core value derives from processes that reduce reliance on virgin resource extraction and manufacturing, thereby decreasing greenhouse gas emissions and environmental pollution.
- Environmental Benefits: Measurable reduction in carbon footprint and environmental externalities strengthens investment thesis.
- Market Trend Alignment: Assets aligned with sustainability narratives benefit from policy support and investor enthusiasm centered on ESG (Environmental, Social, Governance) criteria.
Market Demand and Regulatory Compliance
- Market Demand: Investment value is contingent upon demonstrated utility and sustained demand in relevant market segments.
- Regulatory Compliance: Strong regulatory compliance frameworks enhance legitimacy and reduce legal risk, supporting long-term value retention.
- Brand Reputation: Community engagement and transparent communication mechanisms establish trust with investors and users.
Value Capture Framework
For crypto assets seeking investment appeal, evaluation should encompass:
- Long-term Revenue Channels: Sustainable income generation mechanisms beyond speculative appreciation.
- Ecosystem Activity Metrics: Agent transaction volumes and protocol activity levels indicating real utility.
- Community Engagement: Strength of community support and developer ecosystem participation.
III. Assessment Limitations
The provided reference materials predominantly address general sustainability frameworks, legal judgment recognition procedures, tourism development models, and pandemic economic impact—none of which contain specific comparative data on TRIBE and ETC tokenomics, technical specifications, institutional holdings, adoption metrics, or regulatory treatment across different jurisdictions.
To complete a comprehensive investment analysis comparing TRIBE and ETC, the following information categories would be required:
- Detailed tokenomics and supply mechanics for each asset
- Institutional investor positioning and accumulation patterns
- Enterprise adoption and real-world use case implementation
- Jurisdiction-specific regulatory frameworks and policy treatment
- Technical upgrade roadmaps and protocol development status
- Historical performance data across macroeconomic cycles
IV. General Investment Considerations
Investors evaluating TRIBE and ETC should conduct independent due diligence addressing:
- Sustainability Commitments: Verification of genuine environmental benefit claims
- Regulatory Environment: Assessment of current and anticipated regulatory treatment
- Market Adoption: Evaluation of actual utility and user growth metrics
- Technical Development: Review of development activity and innovation roadmaps
- Community Health: Analysis of ecosystem participation and developer engagement
Report Date: December 20, 2025
Disclaimer: This analysis is based on limited reference materials and does not constitute investment advice. Readers should conduct comprehensive independent research before making investment decisions.
III. 2025-2030 Price Forecast: TRIBE vs ETC
Short-term Forecast (2025)
- TRIBE: Conservative $0.423-$0.632 | Optimistic $0.632-$0.727
- ETC: Conservative $9.131-$12.339 | Optimistic $12.339-$12.956
Medium-term Forecast (2027-2028)
- TRIBE is expected to enter a growth consolidation phase, with predicted price range of $0.436-$1.101
- ETC is expected to enter an accumulation phase, with predicted price range of $9.291-$20.451
- Key drivers: institutional capital inflows, ETF adoption, ecosystem development
Long-term Forecast (2029-2030)
- TRIBE: Base case $0.523-$1.003 | Optimistic scenario $1.126-$1.492
- ETC: Base case $13.113-$19.282 | Optimistic scenario $19.864-$25.443
Disclaimer: This forecast is for informational purposes only and does not constitute investment advice. Cryptocurrency markets are highly volatile and unpredictable. Actual prices may differ materially from predictions. Please conduct thorough research and consult with qualified financial advisors before making investment decisions.
TRIBE:
| 年份 | 预测最高价 | 预测平均价格 | 预测最低价 | 涨跌幅 |
|---|---|---|---|---|
| 2025 | 0.72657 | 0.6318 | 0.423306 | 0 |
| 2026 | 0.87614865 | 0.679185 | 0.38713545 | 7 |
| 2027 | 1.0420735455 | 0.777666825 | 0.435493422 | 23 |
| 2028 | 1.1009429241525 | 0.90987018525 | 0.4640337944775 | 44 |
| 2029 | 1.1260553412654 | 1.00540655470125 | 0.52281140844465 | 59 |
| 2030 | 1.492023327176655 | 1.065730947983325 | 0.618123949830328 | 68 |
ETC:
| 年份 | 预测最高价 | 预测平均价格 | 预测最低价 | 涨跌幅 |
|---|---|---|---|---|
| 2025 | 12.95595 | 12.339 | 9.13086 | 0 |
| 2026 | 16.56819225 | 12.647475 | 9.612081 | 2 |
| 2027 | 20.450967075 | 14.607833625 | 11.101953555 | 18 |
| 2028 | 21.03528042 | 17.52940035 | 9.2905821855 | 41 |
| 2029 | 19.86081059655 | 19.282340385 | 17.54692975035 | 56 |
| 2030 | 25.4430481380075 | 19.571575490775 | 13.11295557881925 | 58 |
Comparative Investment Analysis: TRIBE vs Ethereum Classic (ETC)
IV. Investment Strategy Comparison: TRIBE vs ETC
Long-term vs Short-term Investment Strategies
TRIBE: Suitable for investors focused on DeFi governance participation and protocol ecosystem development. Short-term traders may capitalize on recent positive momentum (+21.41% annually), while long-term participants should evaluate Fei Protocol's stablecoin adoption trajectory and governance token utility expansion.
ETC: Suitable for investors seeking exposure to established blockchain infrastructure with historical credibility. Short-term strategies may benefit from recent 24-hour momentum (+6.16%), though long-term positioning requires conviction regarding PoW consensus viability amid competitive smart contract platforms.
Risk Management and Asset Allocation
Conservative Investor Profile:
- TRIBE: 5-10% allocation (limited due to illiquidity and concentration risk)
- ETC: 15-20% allocation (established infrastructure, broader exchange access)
- Hedging Tools: 70-80% stable coin positioning, protective put strategies, diversification across Layer 1 blockchain alternatives
Aggressive Investor Profile:
- TRIBE: 20-30% allocation (captures upside volatility and early-stage governance participation)
- ETC: 30-40% allocation (leverages superior liquidity and market cap stability)
- Hedging Tools: Derivative positions (futures contracts), cross-asset portfolio hedging, volatility-based strategies
Portfolio Optimization Considerations:
- Avoid concentrated single-asset positions given extreme fear market sentiment (Fear & Greed Index: 16)
- Implement dollar-cost averaging given sustained price volatility
- Cross-collateralization strategies utilizing stablecoin reserves
V. Comparative Risk Assessment
Market Risks
TRIBE:
- Minimal trading liquidity ($11,618.96 daily volume) creates execution risk for large position entries/exits
- Concentrated market cap ($24.3M) relative to fully diluted valuation ($638.2M) indicates substantial dilution potential upon token release schedules
- Limited exchange listing (1 exchange) restricts market accessibility and price discovery mechanisms
- Small holder base (13,415 addresses) suggests elevated centralization and exit liquidity constraints
ETC:
- Severe annual depreciation (-57.94%) reflects sustained market skepticism regarding long-term value proposition
- Substantial market cap ($1.91B) creates execution challenges for rapid position liquidation despite higher absolute liquidity
- Heavy reliance on mining infrastructure requires ongoing capital allocation for network security maintenance
- Competitive displacement risk from higher-throughput Layer 1 and Layer 2 alternatives
Technical Risks
TRIBE:
- Protocol dependency risk: governance token value tied entirely to Fei Protocol adoption and stablecoin market penetration
- Smart contract audit and security review frequency and depth relative to competing DeFi governance tokens
- Ethereum network layer risks (congestion, transaction costs) directly impact protocol economics
- Limited technical documentation and communication regarding protocol upgrade roadmaps
ETC:
- Proof-of-Work consensus mechanism faces long-term sustainability questions regarding energy costs and mining hardware economics
- Network security contingent upon sustained mining participation; reduced hashrate creates vulnerability to 51% attacks
- Technical innovation velocity appears limited relative to competing smart contract platforms
- Historical smart contract vulnerabilities and security audit requirements
Regulatory Risks
TRIBE:
- Governance token classification may trigger securities regulation in certain jurisdictions, creating compliance uncertainty
- Fei Protocol's stablecoin characteristics subject to potential stablecoin regulatory frameworks under development globally
- DeFi protocol oversight expanding across EU (MiCA), US (pending legislation), and Asian regulatory bodies
- Yield farming and liquidity mining incentives face potential regulatory scrutiny regarding unregistered investment schemes
ETC:
- General cryptocurrency regulatory treatment applies, though less clarity regarding PoW consensus sustainability in energy-restrictive jurisdictions
- Potential EU carbon tax implications for PoW mining operations and network cost structure
- Global securities classification uncertainty regarding smart contract platform tokens
- Regulatory treatment varies substantially across major markets (US, EU, Asia), creating compliance complexity for institutional adoption
VI. Conclusion: Which Is the Better Buy?
📌 Investment Value Summary:
TRIBE Advantages:
- Positive annual performance momentum (+21.41%) demonstrates relative resilience amid market headwinds
- Direct participation in DeFi governance provides utility beyond speculative appreciation
- Early-stage protocol development suggests potential for ecosystem value expansion
- Recent short-term gains (7-day: +10.4%, 24-hour: +3.5%) align with emerging market recovery indicators
ETC Advantages:
- Substantial market liquidity ($2.337M daily volume, 201x greater than TRIBE) enables efficient position execution
- Extensive exchange listing (53 platforms) provides global accessibility and price discovery mechanisms
- Established blockchain infrastructure operating continuously since 2016 offers operational credibility
- Large holder base (102.7M addresses) suggests distributed network security and reduced centralization risk
- Positive near-term momentum (24-hour: +6.16%, 1-hour: -0.31%) indicates emerging buying pressure
✅ Investment Recommendations:
Beginner Investors:
- Recommend ETC allocation due to superior liquidity, exchange availability, and established operational history
- Start with conservative position sizing (5-10% of crypto allocation) given extreme market fear sentiment
- Implement dollar-cost averaging across 6-12 month accumulation periods rather than lump-sum purchases
- Prioritize educational research regarding PoW mechanics and blockchain infrastructure before significant capital deployment
Experienced Investors:
- Consider TRIBE exposure (10-20% of crypto allocation) for DeFi governance participation and protocol upside optionality
- Implement tactical trading strategies around short-term momentum indicators while maintaining core ETC holdings for liquidity and stability
- Utilize cross-pair arbitrage opportunities between TRIBE's limited exchange availability and broader market pricing
- Monitor Fei Protocol governance proposals and protocol development progress for position timing optimization
Institutional Investors:
- ETC presents superior suitability for institutional allocation given market cap scale ($1.91B), liquidity depth, and established custody/settlement infrastructure
- TRIBE allocation appropriate only within specialized DeFi-focused funds with governance engagement capabilities
- Conduct comprehensive due diligence on mining economics (ETC) and protocol tokenomics (TRIBE) before institutional commitments
- Implement institutional-grade risk management frameworks including custodial arrangements, insurance, and regulatory compliance procedures
⚠️ Risk Disclaimer: Cryptocurrency markets demonstrate extreme volatility and unpredictability. The current market sentiment index of 16 (Extreme Fear) reflects systemic uncertainty and heightened downside risk. Neither TRIBE nor ETC constitutes investment advice. Actual price performance may deviate materially from forecasted scenarios. All investors should conduct independent due diligence, consult qualified financial advisors, and implement comprehensive risk management strategies before capital deployment. Past performance does not guarantee future results. None
TRIBE vs ETC Investment Comparison - FAQ
I. Frequently Asked Questions
Q1: What are the key differences between TRIBE and ETC as investment assets?
A: TRIBE is a governance token for Fei Protocol (a DeFi stablecoin platform on Ethereum), while ETC is an independent blockchain platform for executing smart contracts. TRIBE has lower market liquidity ($11,618.96 daily volume) and limited exchange availability (1 exchange), but shows positive annual performance (+21.41%). ETC has substantially higher liquidity ($2.337M daily volume), 53 exchange listings, and established infrastructure since 2016, but demonstrates severe annual decline (-57.94%). TRIBE suits DeFi governance participants, while ETC appeals to investors seeking established blockchain infrastructure.
Q2: Which asset demonstrates better short-term price momentum?
A: Both assets show positive short-term momentum. TRIBE gained +3.5% in 24 hours and +10.4% over 7 days, while ETC gained +6.16% in 24 hours but declined -4.62% over 7 days. Over 1-year performance, TRIBE significantly outperforms with +21.41% annual gains versus ETC's -57.94% annual decline. However, extreme market fear sentiment (Fear & Greed Index: 16) suggests both assets face underlying bearish market pressures despite short-term positive price action.
Q3: What are the primary risk factors for each investment?
A: TRIBE risks include minimal liquidity, limited exchange accessibility, concentrated ownership (13,415 token holders), and substantial gap between market cap ($24.3M) and fully diluted valuation ($638.2M) indicating future dilution potential. ETC risks include severe long-term depreciation, Proof-of-Work energy cost sustainability concerns, mining infrastructure dependency, competitive displacement from higher-throughput blockchain alternatives, and potential regulatory treatment of energy-intensive consensus mechanisms.
Q4: How do market liquidity and accessibility compare?
A: ETC demonstrates vastly superior market accessibility with 201 times greater daily trading volume ($2.337M versus $11,618.96) and 53 exchange listings compared to TRIBE's single exchange. This liquidity advantage enables institutional investors and large traders to execute positions efficiently with minimal price slippage. TRIBE's limited accessibility restricts trading flexibility and creates execution risk for substantial position entries or exits, making it less suitable for institutional capital deployment.
Q5: What do price forecasts suggest for 2025-2030?
A: TRIBE forecasts range from $0.423-$0.727 (2025) to $1.126-$1.492 (2030) under optimistic scenarios, representing 75-133% potential appreciation from current price ($0.6382). ETC forecasts range from $9.131-$12.956 (2025) to $19.864-$25.443 (2030) under optimistic scenarios, representing 56-106% appreciation from current price ($12.354). Both forecasts depend on institutional capital inflows, exchange-traded fund adoption, and ecosystem development progress. These predictions carry substantial uncertainty given cryptocurrency market volatility.
Q6: Which asset suits conservative versus aggressive investors?
A: Conservative investors should favor ETC allocations (15-20% of crypto portfolio) given superior liquidity, established infrastructure, and broader exchange access, combined with 70-80% stablecoin positioning for risk mitigation. Aggressive investors may allocate 20-30% to TRIBE and 30-40% to ETC while implementing derivative strategies and cross-asset hedging. However, extreme market fear sentiment necessitates cautious position sizing across both assets regardless of investor profile. Dollar-cost averaging across 6-12 month periods reduces timing risk superior to lump-sum purchases.
Q7: What regulatory considerations affect each investment?
A: TRIBE faces governance token classification uncertainty potentially triggering securities regulations in certain jurisdictions, plus stablecoin regulatory frameworks emerging globally (EU MiCA, US pending legislation). ETC confronts potential carbon tax implications for Proof-of-Work mining operations, general cryptocurrency regulatory treatment uncertainty, and varying securities classification across major markets (US, EU, Asia). Both assets demonstrate increased regulatory scrutiny in DeFi protocols and blockchain platforms, requiring investors to monitor compliance developments and jurisdictional policy changes affecting operational economics and legal status.
Q8: Should I choose TRIBE or ETC for my investment portfolio?
A: The optimal choice depends on individual risk tolerance, investment horizon, and portfolio objectives. ETC suits most investors seeking established blockchain exposure with superior liquidity and accessibility despite long-term depreciation concerns. TRIBE appeals to sophisticated investors specifically targeting DeFi governance participation and protocol ecosystem development. Institutional investors should prioritize ETC given market cap scale and infrastructure maturity. Beginners should favor ETC with conservative allocation (5-10%) and dollar-cost averaging strategies. Both require independent due diligence, qualified financial advisor consultation, and comprehensive risk management frameworks. Current extreme market fear sentiment (Fear & Greed Index: 16) warrants cautious position sizing regardless of asset selection.
Disclaimer: This FAQ provides informational content only and does not constitute investment advice. Cryptocurrency markets demonstrate extreme volatility and unpredictability. Actual price performance may deviate materially from forecasts. All investors must conduct independent research, consult qualified financial advisors, and implement comprehensive risk management before capital deployment. Past performance does not guarantee future results.
Share
Content
Introduction: TRIBE vs ETC Investment Comparison
I. Historical Price Comparison and Current Market Status
II. Project Overview and Technical Foundation
III. Price Performance Analysis
IV. Market Liquidity and Trading Dynamics
V. Exchange Listing and Accessibility
VI. Risk Assessment and Market Considerations
VII. Conclusion
I. Executive Summary
II. Core Factors Influencing Investment Value of TRIBE and ETC
III. Assessment Limitations
IV. General Investment Considerations
III. 2025-2030 Price Forecast: TRIBE vs ETC
IV. Investment Strategy Comparison: TRIBE vs ETC
V. Comparative Risk Assessment
VI. Conclusion: Which Is the Better Buy?
I. Frequently Asked Questions
How to Buy Cryptocurrency


Trending Cryptocurrencies


Avalanche (AVAX) 2025 Price Analysis and Market Trends

FTT Explained

2025 PYTH Price Prediction: Analyzing Market Trends and Growth Potential for the Oracle Network Token

2025 VELO Price Prediction: Analyzing Market Trends and Potential Growth Factors for the Next Bull Run

2025 WPrice Prediction: Analyzing Market Trends and Future Valuation of Global W Index
2025 YFI Price Prediction: Potential Growth Factors and Market Analysis for Yearn Finance Token
What is tokenomics and how does token distribution allocation work in crypto projects?

What Is Internet Computer (ICP)? A Complete Fundamentals Analysis of Whitepaper Logic, Use Cases, and Roadmap Progress

Affordable Ways to Trade Pi Coins in India: A Complete How-To Guide

What is tokenomics: how does DOT token allocation, inflation design, and governance mechanisms work?

How active is Polkadot's community and ecosystem with 8,898 developers and growing user engagement in 2025?