This comprehensive comparison analyzes UNIBOT versus DYDX trading solutions, examining historical price performance, market capitalization, and technical architecture. UNIBOT specializes in Telegram-based DEX trading automation with extreme volatility, declining 99% from its $243.36 peak to current $1.152, while DYDX operates as an established decentralized derivatives protocol with more stable performance. With DYDX showing superior liquidity ($553,812.78 daily volume versus UNIBOT's $91,861.98) and larger market cap ($109.88M), conservative investors should favor DYDX allocations. The analysis provides risk-adjusted investment strategies, 2026-2031 price forecasts, and fee comparisons to help traders select optimal trading solutions on Gate and evaluate risk management approaches.
Introduction: Investment Comparison Between UNIBOT and DYDX
In the cryptocurrency market, the comparison between UNIBOT vs DYDX remains a topic of ongoing interest among investors. Both assets exhibit notable differences in market capitalization ranking, application scenarios, and price performance, representing distinct positioning within the crypto asset landscape.
UNIBOT (UNIBOT): Launched in 2023, this project has gained recognition for its specialized focus on Telegram-based trading automation and Uniswap sniping capabilities.
DYDX (DYDX): Since its introduction in 2021, DYDX has positioned itself as a decentralized derivatives trading protocol, operating a perpetual contract exchange on Layer 2 infrastructure.
This article will examine historical price trends, supply mechanisms, institutional adoption, technical ecosystems, and future projections to provide a comprehensive analysis of UNIBOT vs DYDX investment value comparison, addressing the question many investors consider:
"Which presents a more compelling investment case based on current market conditions?"
I. Historical Price Comparison and Current Market Status
Historical Price Trends of UNIBOT (Coin A) and DYDX (Coin B)
-
2023: UNIBOT experienced notable price movement, with its all-time high of $243.36 recorded on August 16, 2023. During this period, the token demonstrated strong momentum driven by its positioning as a Telegram-based Uniswap sniper bot with advanced trading infrastructure.
-
2024: DYDX reached its all-time high of $4.52 on March 8, 2024, reflecting positive market sentiment around its decentralized derivatives trading platform. The token benefited from its transition to the Cosmos ecosystem and enhanced Layer 2 capabilities.
-
2026: Both assets experienced substantial corrections from their peaks. UNIBOT declined from its high of $243.36 to an all-time low of $1.04 on January 31, 2026, representing a decline of over 99%. DYDX similarly declined from $4.52 to $0.126201 on October 11, 2025, before experiencing some recovery.
-
Comparative Analysis: During the recent market cycle, UNIBOT declined from $243.36 to $1.04, while DYDX decreased from $4.52 to $0.126201. UNIBOT exhibited more extreme volatility with a steeper percentage decline, while DYDX showed relatively more stable price behavior despite significant downward pressure.
Current Market Status (February 3, 2026)
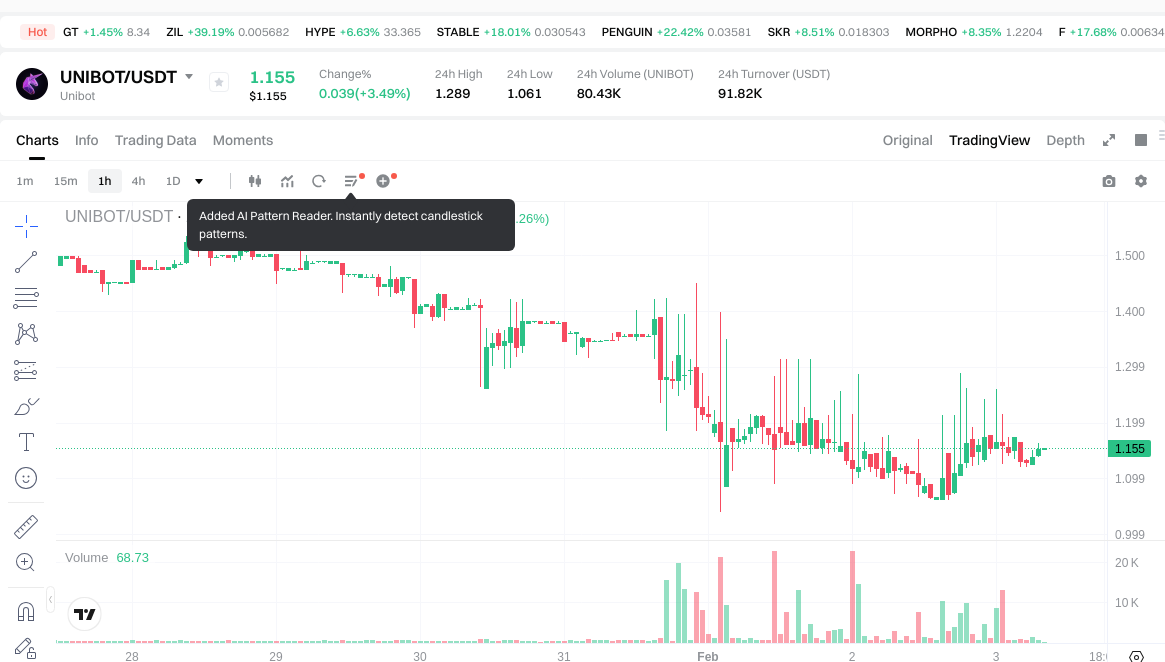
- UNIBOT current price: $1.152
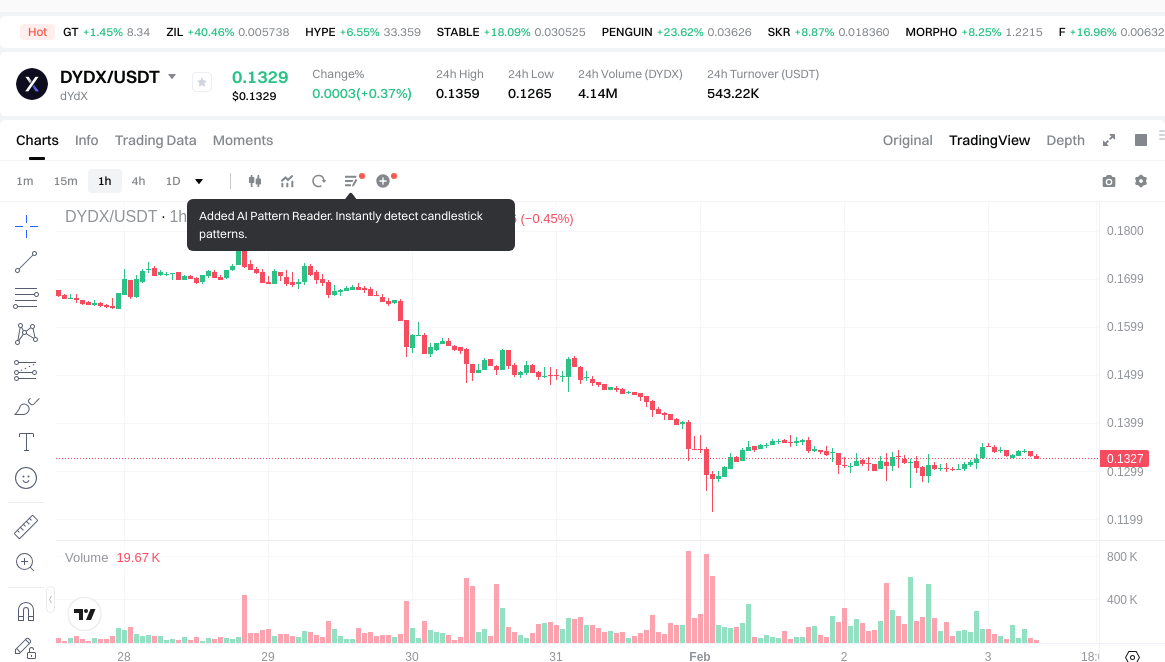
- DYDX current price: $0.1332
- 24-hour trading volume: UNIBOT $91,861.98 vs DYDX $553,812.78
- 24-hour price change: UNIBOT +3.13% vs DYDX +1.44%
- Market capitalization: UNIBOT $1,152,000 vs DYDX $109,877,711.57
- Market Sentiment Index (Fear & Greed Index): 14 (Extreme Fear)
View real-time prices:
II. Core Factors Influencing UNIBOT vs DYDX Investment Value
Supply Mechanism Comparison (Tokenomics)
- UNIBOT: Materials do not specify detailed supply mechanism or tokenomics structure for UNIBOT.
- DYDX: Materials reference DYDX as utilizing an order book model for perpetual contracts, but do not detail its token supply mechanism.
- 📌 Historical Pattern: Supply mechanisms can influence price cycles through scarcity dynamics and emission schedules, though specific mechanisms for these tokens are not elaborated in available materials.
Institutional Adoption and Market Applications
- Institutional Holdings: Materials do not provide comparative data on institutional preference between UNIBOT and DYDX.
- Enterprise Adoption: Available materials discuss DEX trading bots and decentralized perpetual exchanges broadly, but do not specify enterprise adoption details for cross-border payments, settlements, or investment portfolios for either token.
- National Policies: Regulatory attitudes toward these specific tokens across different jurisdictions are not detailed in provided materials.
Technology Development and Ecosystem Building
- UNIBOT Technology: Materials mention DEX trading bots that automate trading processes through smart contracts, though specific technological upgrades for UNIBOT are not documented.
- DYDX Technology: DYDX employs a hybrid on-chain and off-chain order book model where validators host the order book rather than storing it directly on-chain, addressing latency and fee concerns. This architecture represents a technical approach to perpetual contract trading.
- Ecosystem Comparison: Materials indicate that decentralized perpetual protocols have shown growth, with on-chain spot trading volume surpassing futures volume due to blockchain technology advances. However, specific comparative data on DeFi, NFT, payment systems, and smart contract implementations for UNIBOT versus DYDX is not provided.
Macroeconomic Environment and Market Cycles
- Performance Under Inflation: Materials do not provide specific analysis comparing anti-inflation properties of UNIBOT versus DYDX.
- Macroeconomic Monetary Policy: General market analysis indicates that interest rates and dollar index movements affect the broader crypto market, as evidenced by Q3 2023 market data showing a 10% decline in total market capitalization. However, specific impacts on these two tokens are not detailed.
- Geopolitical Factors: Materials note that cross-border trading demands and international situations influence the crypto market broadly, though specific effects on UNIBOT and DYDX are not documented in available references.
III. 2026-2031 Price Forecast: UNIBOT vs DYDX
Short-term Forecast (2026)
- UNIBOT: Conservative $0.6237-$1.155 | Optimistic $1.155-$1.46685
- DYDX: Conservative $0.100852-$0.1327 | Optimistic $0.1327-$0.151278
Medium-term Forecast (2028-2029)
- UNIBOT may enter a growth phase with projected prices ranging from $1.25-$2.45
- DYDX may experience moderate expansion with projected prices ranging from $0.09-$0.22
- Key drivers: institutional capital flows, ETF developments, ecosystem expansion
Long-term Forecast (2030-2031)
- UNIBOT: Baseline scenario $1.27-$2.96 | Optimistic scenario $2.54-$2.96
- DYDX: Baseline scenario $0.16-$0.27 | Optimistic scenario $0.24-$0.27
View detailed price predictions for UNIBOT and DYDX
Disclaimer
UNIBOT:
| Year |
Predicted High Price |
Predicted Average Price |
Predicted Low Price |
Price Change |
| 2026 |
1.46685 |
1.155 |
0.6237 |
0 |
| 2027 |
1.5993285 |
1.310925 |
1.14050475 |
13 |
| 2028 |
2.09538252 |
1.45512675 |
1.251409005 |
26 |
| 2029 |
2.4498513963 |
1.775254635 |
1.5622240788 |
54 |
| 2030 |
2.95757422191 |
2.11255301565 |
1.26753180939 |
83 |
| 2031 |
2.7632193444702 |
2.53506361878 |
1.3689343541412 |
120 |
DYDX:
| Year |
Predicted High Price |
Predicted Average Price |
Predicted Low Price |
Price Change |
| 2026 |
0.151278 |
0.1327 |
0.100852 |
0 |
| 2027 |
0.18742548 |
0.141989 |
0.08093373 |
6 |
| 2028 |
0.1927074708 |
0.16470724 |
0.090588982 |
23 |
| 2029 |
0.22338419425 |
0.1787073554 |
0.12509514878 |
34 |
| 2030 |
0.273422253762 |
0.201045774825 |
0.1568157043635 |
50 |
| 2031 |
0.27044677629459 |
0.2372340142935 |
0.21351061286415 |
78 |
IV. Investment Strategy Comparison: UNIBOT vs DYDX
Long-term vs Short-term Investment Strategies
-
UNIBOT: May appeal to investors interested in specialized trading automation tools and Telegram-based DeFi applications. The token's historical volatility suggests it may be more suitable for investors with higher risk tolerance who can monitor short-term price movements.
-
DYDX: May attract investors focused on decentralized derivatives infrastructure and Layer 2 scaling solutions. The protocol's positioning in perpetual contract trading could appeal to those seeking exposure to DeFi trading infrastructure with relatively broader market capitalization.
Risk Management and Asset Allocation
-
Conservative Investors: UNIBOT 20-30% vs DYDX 70-80%. Given DYDX's larger market capitalization ($109.88M vs $1.15M) and higher trading volume, conservative portfolios might weight toward DYDX while maintaining limited UNIBOT exposure for diversification.
-
Aggressive Investors: UNIBOT 40-50% vs DYDX 50-60%. Higher risk tolerance investors may increase UNIBOT allocation to capitalize on potential recovery from extreme price levels, while maintaining DYDX as a core holding.
-
Hedging Tools: Stablecoin allocation (recommended 20-40% of portfolio), options strategies where available, and cross-asset combinations to mitigate concentration risk in either token.
V. Potential Risk Comparison
Market Risk
-
UNIBOT: Exhibits extreme volatility with a decline exceeding 99% from its all-time high of $243.36 to $1.04. Current 24-hour trading volume of $91,861.98 indicates limited liquidity, which may amplify price swings during market stress. The Market Sentiment Index at 14 (Extreme Fear) reflects broader market uncertainty.
-
DYDX: Experienced substantial decline from $4.52 to $0.126201, though with relatively more stable price behavior compared to UNIBOT. Higher 24-hour trading volume of $553,812.78 provides better liquidity conditions, though still subject to broader crypto market volatility and sentiment shifts.
Technical Risk
-
UNIBOT: Materials indicate DEX trading bots automate processes through smart contracts, though specific technical architecture details are not documented. Scalability and network stability considerations depend on underlying infrastructure, which is not elaborated in available materials.
-
DYDX: Employs a hybrid on-chain and off-chain order book model where validators host the order book rather than storing it directly on-chain. This architecture addresses latency and fee concerns but introduces validator dependency considerations. Security considerations related to this hybrid model require ongoing monitoring.
Regulatory Risk
- Global regulatory developments may impact both tokens differently. UNIBOT's focus on trading automation tools could face scrutiny regarding automated trading practices and bot-related regulations. DYDX's derivatives trading infrastructure may encounter regulatory attention concerning decentralized futures markets and perpetual contracts. Specific jurisdictional policies affecting these tokens are not detailed in available materials, requiring investors to monitor evolving regulatory landscapes independently.
VI. Conclusion: Which Is the Better Buy?
📌 Investment Value Summary:
-
UNIBOT Characteristics: Specialized focus on Telegram-based trading automation with Uniswap sniping capabilities. Exhibits extreme volatility with potential for significant price movements. Limited market capitalization of $1.15M and lower trading volume present liquidity considerations. Price forecasts suggest potential recovery ranges but with substantial uncertainty.
-
DYDX Characteristics: Established decentralized derivatives protocol with Layer 2 infrastructure positioning. Market capitalization of $109.88M provides relatively more stability. Hybrid order book architecture addresses technical scalability concerns. Price projections indicate moderate growth potential with comparatively lower volatility ranges.
✅ Investment Considerations:
-
Beginning Investors: May consider starting with DYDX allocation given its larger market capitalization, higher liquidity, and more established protocol infrastructure. Smaller exploratory positions in UNIBOT could provide diversification while managing exposure to extreme volatility.
-
Experienced Investors: Could evaluate portfolio allocation based on risk tolerance and market cycle assessment. Balanced approaches combining both tokens with appropriate hedging instruments may capture different market dynamics while managing downside risk through position sizing.
-
Institutional Investors: May focus on DYDX given its larger market presence and derivatives infrastructure positioning. Institutional evaluation would likely emphasize liquidity requirements, regulatory considerations, and integration with existing DeFi infrastructure strategies.
⚠️ Risk Disclosure: Cryptocurrency markets exhibit extreme volatility. This analysis does not constitute investment advice. Both tokens have experienced substantial price declines from historical peaks. Investors should conduct independent research, assess personal risk tolerance, and consider consulting financial advisors before making investment decisions.
VII. FAQ
Q1: What is the primary difference between UNIBOT and DYDX in terms of use cases?
UNIBOT specializes in Telegram-based trading automation and Uniswap sniping capabilities, while DYDX operates as a decentralized derivatives trading protocol offering perpetual contracts on Layer 2 infrastructure. UNIBOT focuses on automated trading bot functionality for retail traders seeking DEX trading efficiency, particularly through Telegram integration. In contrast, DYDX provides institutional-grade derivatives infrastructure with an order book model for perpetual contract trading, positioning itself as a comprehensive decentralized exchange for futures markets.
Q2: Which token shows higher volatility based on historical performance?
UNIBOT exhibits significantly higher volatility, declining over 99% from its all-time high of $243.36 to $1.04. UNIBOT experienced more extreme price movements during the market cycle, while DYDX demonstrated relatively more stable behavior despite declining from $4.52 to $0.126201. The substantial difference in percentage decline—UNIBOT's 99%+ versus DYDX's approximately 97%—combined with UNIBOT's lower market capitalization ($1.15M) and trading volume ($91,861.98) creates conditions for amplified price swings compared to DYDX's $109.88M market cap and $553,812.78 daily volume.
Q3: What are the key technical advantages of DYDX over UNIBOT?
DYDX employs a hybrid on-chain and off-chain order book model where validators host the order book rather than storing it directly on-chain, addressing latency and fee concerns inherent in fully on-chain systems. This architecture enables faster order matching and lower transaction costs for derivatives trading. While materials indicate UNIBOT utilizes smart contracts for automated trading processes, specific technical architecture details are not documented, making direct technical comparison limited. DYDX's Layer 2 infrastructure and established derivatives protocol represent more transparent technical positioning.
Q4: How should conservative investors approach allocation between these two tokens?
Conservative investors may consider a 70-80% allocation to DYDX and 20-30% to UNIBOT based on risk management principles. DYDX's larger market capitalization ($109.88M versus $1.15M), higher trading volume, and more established protocol infrastructure provide relatively more stability for risk-averse portfolios. The limited UNIBOT allocation allows for diversification benefits while containing exposure to extreme volatility. Additionally, conservative strategies should incorporate 20-40% stablecoin allocation as a hedging tool to mitigate concentration risk in either token during market downturns.
Q5: What regulatory risks should investors consider for UNIBOT versus DYDX?
UNIBOT faces potential scrutiny regarding automated trading practices and bot-related regulations, as trading automation tools may encounter regulatory attention concerning market manipulation concerns and algorithmic trading oversight. DYDX confronts regulatory considerations related to decentralized futures markets and perpetual contracts, as derivatives platforms increasingly attract regulatory focus regarding investor protection and market integrity. Both tokens operate in evolving regulatory landscapes where jurisdictional policies remain uncertain. Investors should monitor developments in crypto trading automation regulations and decentralized derivatives frameworks independently.
Q6: What price recovery potential exists for UNIBOT compared to DYDX?
UNIBOT's extreme decline from $243.36 to $1.04 creates potential for percentage-based recovery, with 2026-2031 forecasts projecting ranges from $0.62-$2.96 under various scenarios. However, achieving substantial recovery requires renewed adoption and market interest. DYDX's more moderate decline positions it for gradual growth, with projections ranging from $0.10-$0.27 over the same period. UNIBOT presents higher risk-reward dynamics with greater upside potential but corresponding downside vulnerability, while DYDX offers more measured growth expectations aligned with its established market position and infrastructure development trajectory.
Q7: Which token is more suitable for beginning investors?
DYDX may be more suitable for beginning investors due to its larger market capitalization, higher liquidity, and more established protocol infrastructure. The token's relatively more stable price behavior compared to UNIBOT reduces exposure to extreme volatility that could overwhelm less experienced market participants. DYDX's positioning in decentralized derivatives trading provides clearer value proposition understanding for newcomers. Beginning investors considering UNIBOT should limit exposure to small exploratory positions while developing risk management capabilities and market understanding before increasing allocation to highly volatile assets.
Q8: How does trading volume impact investment decisions between these tokens?
Trading volume significantly impacts liquidity and execution quality. DYDX's 24-hour volume of $553,812.78 provides approximately 6x the liquidity of UNIBOT's $91,861.98, enabling better order execution with reduced slippage for larger position sizes. Lower liquidity in UNIBOT creates challenges for entering and exiting positions efficiently, particularly during market stress when volume may decline further. Investors with larger capital allocations should prioritize DYDX for improved trade execution, while those trading smaller amounts may find UNIBOT's liquidity sufficient but should employ limit orders and avoid market orders during low-volume periods.
* The information is not intended to be and does not constitute financial advice or any other recommendation of any sort offered or endorsed by Gate.