The True Strength Index (TSI) is a powerful technical momentum oscillator used by traders and investors to measure the strength of a security's trend and identify potential trend reversals. Learn how to use this versatile tool in your trading strategy, its benefits and drawbacks, and practical examples of its application in the real world.
2026-03-24 11:52:25
Scalping trading is a fast-paced strategy used in financial markets, where traders aim to make small profits from quick trades. This meta description introduces the concept of scalping trading and provides a brief overview of its key features.
2026-03-24 11:52:25
Markets in Crypto Assets (MiCA) is a proposed regulatory framework by the European Union for the crypto industry, covering issuers and service providers, and aiming to improve investor protection and market integrity.
2026-03-24 11:52:25
The ADX indicator is a tool used in trading cryptocurrency and other financial instruments for technical analysis. You will learn about how the ADX is calculated, interpreted, and used to determine trend strength, volatility, and potential market reversals or trend changes. Using the ADX in combination with other technical indicators, such as moving averages or support and resistance areas, can improve your trading decisions.
2026-03-24 11:52:25
The Wyckoff Method is a technical analysis-based trading strategy devised in the early 1900s by the successful stock trader Richard Wyckoff.
2026-03-24 11:52:24
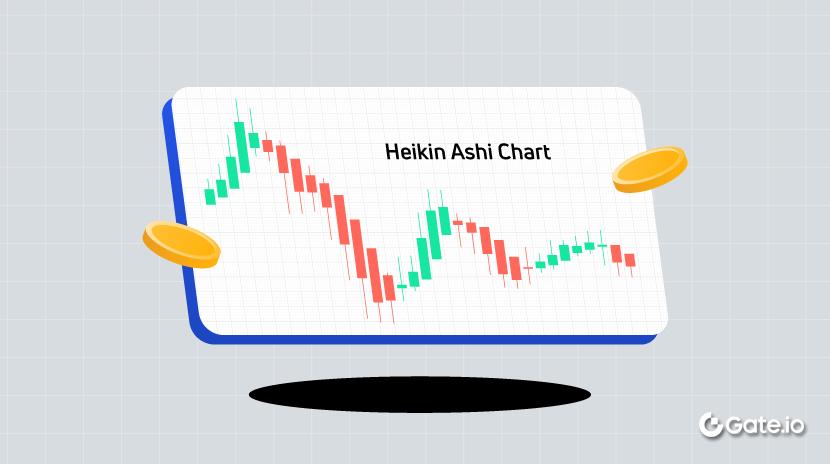
The Heikin Ashi Chart is a type of candlestick chart that provides a smoothed visual representation of price action, helping to eliminate market noise and identify trends in the market.
2026-03-24 11:52:24
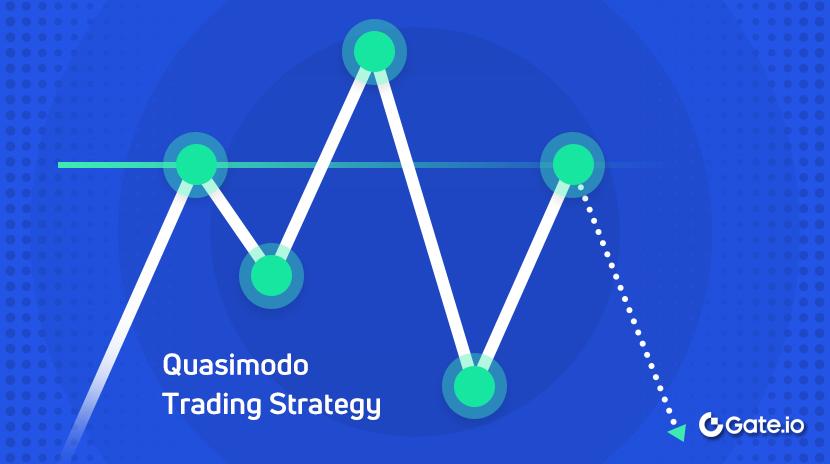
The Quasimodo trading strategy is a unique strategy used to spot potential buy and sell regions. In 2025, it has evolved significantly with AI-powered pattern recognition, new variations like nested and fractal QMs, and integration with DeFi platforms. The QM strategy remains highly profitable for trading cryptocurrencies, now featuring enhanced risk management techniques and impressive performance metrics such as a 72% win rate for continuation patterns. Modern traders leverage QM patterns for optimizing liquidity provision, yield farming, and arbitrage opportunities in the ever-evolving crypto markets.
2026-03-24 11:52:24
As a crypto investor, you should understand the relevance of crypto whitepapers and especially how to analyze them before making allocation decisions.
2026-03-24 11:52:24
Support and resistance are two of the most commonly used K-line technical analyses in trading, looking at resistance on an uptrend and support on a downtrend. However, the levels of support and resistance are not absolute. Typically, the level of support and pressure will change in response to repeated changes in market conditions. In some cases, the price support may become the resistance.
2026-03-24 11:52:24
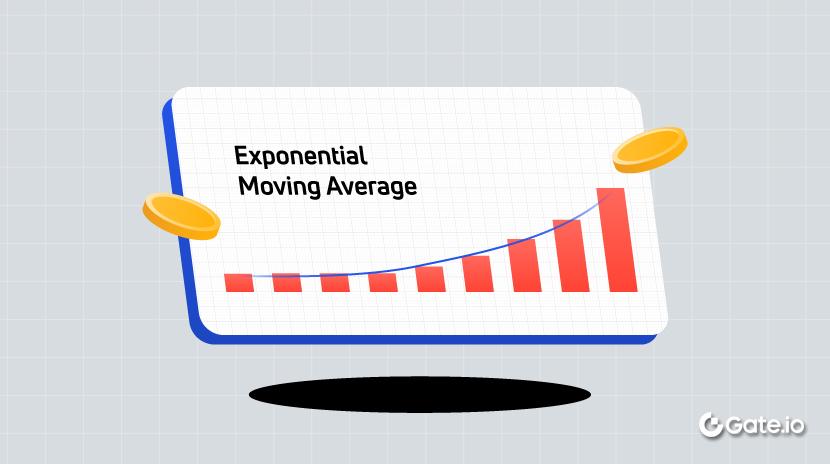
The Exponential Moving Average (EMA) is a trend-based technical indicator. In most cases, investors use the EMA as a support or resistance line in trading and a combination of short-period and long-period EMA indicators to forecast price movements.
2026-03-24 11:52:24
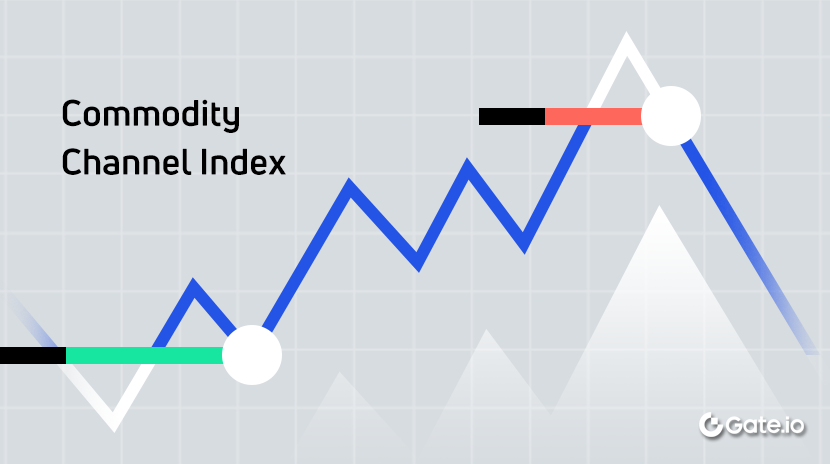
The Commodity Channel Index (CCI), also known as the momentum indicator, is one of the most common technical indicators used to measure whether market prices have exceeded the normal distribution range. It is a unique overbought/oversold indicator.
2026-03-24 11:52:24
Crypto index funds track the performance of a specific basket of assets, providing investors with more diversification through a single asset.
2026-03-24 11:52:24
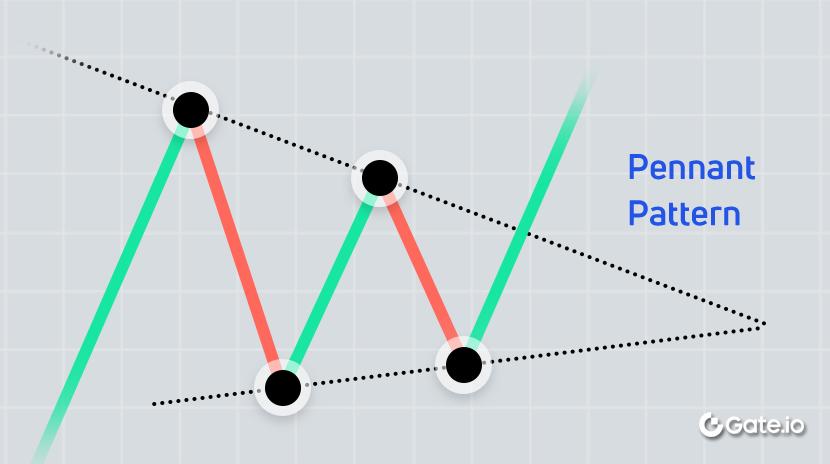
A Pennant is a trend continuation pattern, which follows price trends, either bullish or bearish. It helps traders monitor price trends.
2026-03-24 11:52:23
Risk management is vital to perform an informed investment. Developing risk management awareness and mastering necessary risk management skills are vital for crypto investors.
2026-03-24 11:52:23
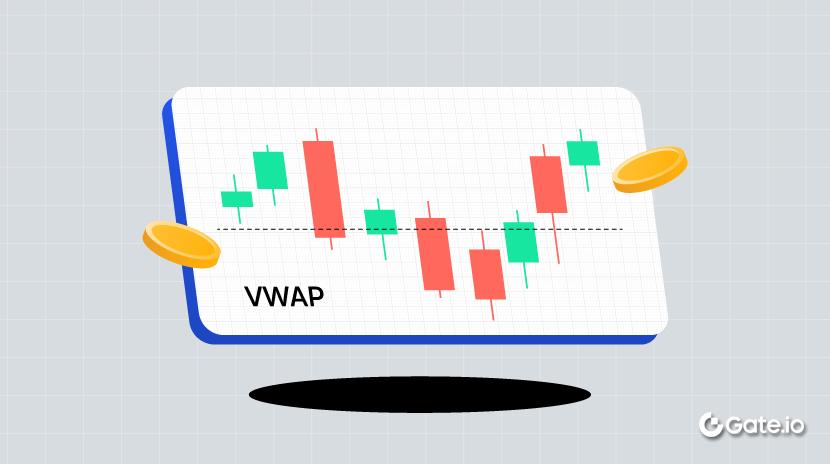
The Volume-Weighted Average Price (VWAP) is a technical analysis tool for measuring the average price weighted by volume. When the price is above the VWAP line, the market is in an uptrend, and when the price is below the VWAP line, the market is in a downtrend. Lots of traders and institutions use VWAP as a key indicator to judge buying and selling points.
2026-03-24 11:52:23