Monero (XMR) was hovering above the $500 mark at the time of recording on Saturday, with the 50-day exponential moving average (EMA) continuing to serve as an important support “buffer.” The upward momentum of open interest (OI) in the XMR futures market, along with the increasing long (long) positions, indicates that new capital is returning as traders bet on the recovery of this privacy coin. However, the technical picture around the $500 level remains unclear, as momentum indicators still signal caution, leaning towards a correction scenario.
Retail demand for Monero is gradually heating up
Monero is gradually regaining appeal among retail investors as the market begins to anticipate a revival of the “privacy money” narrative. According to data from CoinGlass, the open interest of XMR futures contracts has increased by 2.37% in the past 24 hours, reaching $217.69 million, showing that new capital is flowing back and pushing the open contract value higher.
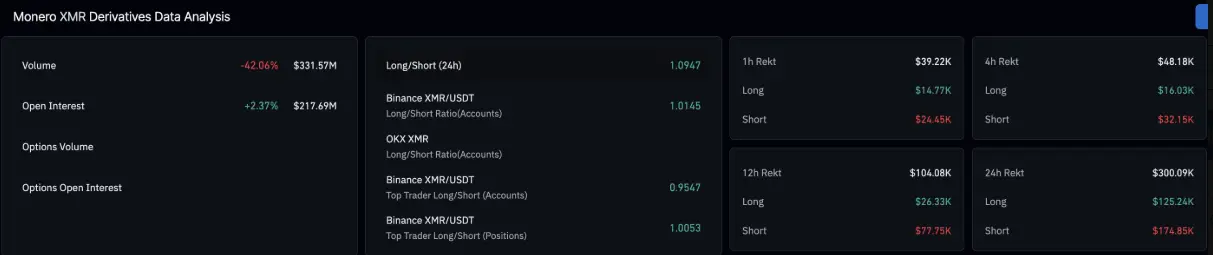 XMR Derivatives Data | Source: CoinGlassThis improvement is further supported by the funding rate remaining at a positive 0.0128%, reflecting optimistic trader sentiment. Notably, long (Long) positions account for up to 53.99% of the total open contracts during the same period, indicating that the “Long” side is clearly dominant in the market.
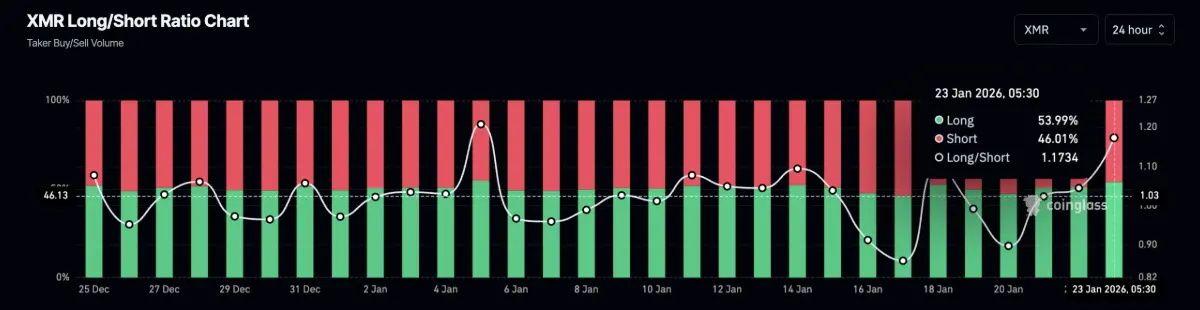 XMR Long/Short Ratio Chart | Source: CoinGlass## Technical Outlook: Is Monero Ready for a Bullish Return?
Monero remains resilient above the psychological $500 level after a strong recovery from the 50-day EMA around $488 earlier in the week, maintaining a short-term positive outlook for this privacy coin. Notably, the 50-day, 100-day, and 200-day EMAs continue to slope upward, reinforcing the foundation for an overall bullish trend.
However, technical signals are showing some caution. The MACD indicator’s MACD line is approaching the zero level after crossing below the signal line on the daily timeframe, accompanied by expanding negative histogram bars — a sign that correction pressure is gradually building.
Meanwhile, the RSI has retreated to around 49 and is moving sideways near the neutral line, reflecting a market in consolidation after a previous overbought rally.
![]https://img-cdn.gateio.im/webp-social/moments-b7dff94085b6b7aec6ccfaf643eeaf0b.webpDaily XMR/USDT Chart | Source: TradingViewFrom a technical perspective, the nearest support zone for XMR is at the 50-day EMA at $488. If the daily close breaches this level, the risk of a deeper correction increases, with targets at the 100-day EMA around $436 and the 200-day EMA at $381 — areas considered “shields” for the medium-term trend.
In a bullish scenario, if buying pressure helps XMR firmly rebound from the $500 zone, the recovery could extend to the R2 Pivot Point at $569, and further to the strong resistance zone near the R3 Pivot Point at $640.
SN_Nour
Disclaimer: The information on this page may come from third parties and does not represent the views or opinions of Gate. The content displayed on this page is for reference only and does not constitute any financial, investment, or legal advice. Gate does not guarantee the accuracy or completeness of the information and shall not be liable for any losses arising from the use of this information. Virtual asset investments carry high risks and are subject to significant price volatility. You may lose all of your invested principal. Please fully understand the relevant risks and make prudent decisions based on your own financial situation and risk tolerance. For details, please refer to
Disclaimer.
