How to Buy the Crypto Dip: 5 Data-Driven Signals Exposed
In February 2026, amidst a year-to-date market decline exceeding 20%, on-chain analytics pioneer Santiment published a critical framework outlining five data-driven signals for identifying strategic buying opportunities.
This move is more than a trading guide; it represents a maturation point for the cryptocurrency market, where objective behavioral and on-chain data are systematically leveraged to navigate volatility. For investors, it signals a shift from reactive speculation to informed, psychology-aware strategy, fundamentally changing how market bottoms are identified and capitalized upon in an increasingly complex digital asset landscape.
The 2026 Inflection Point: Why Dip-Buying Just Got a Data Overhaul
The cryptocurrency market in early 2026 presents a uniquely challenging environment. After a year-to-date drop of over 20%, the dominant question among investors is no longer simply “bull or bear?” but “where is the structural support?” Traditional technical analysis appears strained, and macro narratives offer conflicting signals. It is within this context of heightened uncertainty that Santiment’s release of a five-signal framework for buying the dip carries significant weight. This isn’t just another trading tip; it’s a formalized response to a market craving objective truth amidst the noise.
The timing is critical. We are at a stage in the market cycle where the “weak hands” – those driven by impulse and social media sentiment – are being systematically separated from long-term conviction holders. The volatility is shaking out opportunistic leverage and forcing a reassessment of asset fundamentals. Santiment’s guide arrives as a tool for this recalibration, providing a methodology to distinguish between a routine sell-off and a potential capitulation event that precedes a sustainable bounce. It addresses the core anxiety of the 2026 trader: how to act rationally when every chart seems to scream panic.
This evolution reflects a broader change in the crypto analyst community. The industry is moving past the era of gurus and price predictions based on patterns alone. The demand is now for forensic, real-time analysis of market participant behavior. By codifying these signals, Santiment is effectively arguing that the market’s emotional state is not just background noise; it is a quantifiable, leading indicator that can be systematically tracked and acted upon. The “why now” is clear: the market’s complexity and the stakes for investors have outgrown simplistic heuristics.
Deconstructing the Five Signals: From Social Panic to On-Chain Reality
Santiment’s framework is powerful because it constructs a cause-and-effect chain linking collective psychology directly to on-chain financial reality. It doesn’t treat social sentiment and blockchain data as separate worlds but as interconnected systems where one validates the other. Understanding this linkage is key to grasping why these signals work and who they ultimately benefit.
(Source: Santiment)
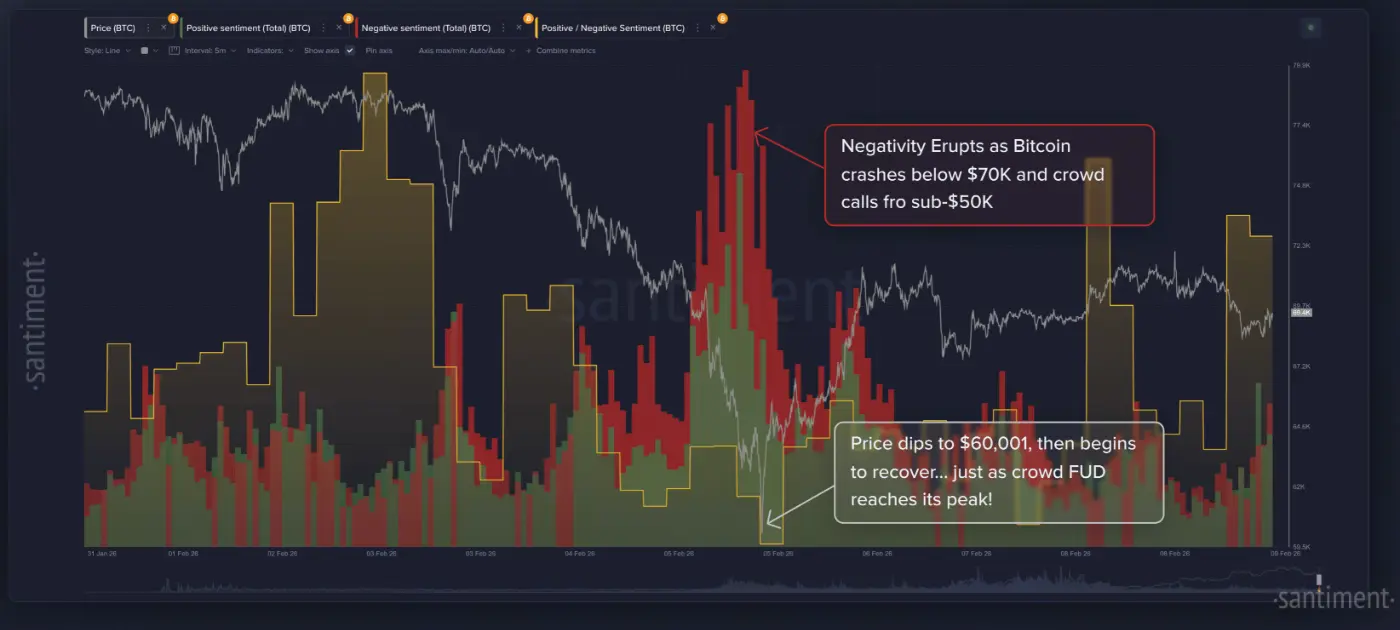
The first three signals – extreme negative social sentiment, the linguistic shift from “dip” to “crash,” and the trending of bearish keywords like “going to $0” – all measure the same underlying phenomenon: the peak of retail fear and capitulation. This isn’t merely about pessimism; it’s about the dominance of a unanimous, desperate narrative. When this occurs, the pool of potential sellers is often exhausted. Those susceptible to panic have already sold. This creates a supply vacuum. The beneficiaries of recognizing this signal are the contrarian investors who can source liquidity and maintain composure, using societal fear as their buy indicator.
The fourth and fifth signals ground this social psychology in hard economic data. Tracking mentions of “buy the dip” is a clever meta-indicator. Its unreliability as a lone signal is instructive; it shows retail traders talking about buying but often not executing until it’s too late. This lag between intention and action creates the window of opportunity. The most robust signal, the 30-day Market Value to Realized Value (MVRV) ratio, provides the final confirmation. When short-term holders are deeply underwater (“strongly undervalued” zone), selling pressure naturally abates because the incentive to realize a loss diminishes. This on-chain metric objectively identifies the point of maximum financial pain for the most recent cohort of buyers.
The parties under pressure in this model are the reactive retail traders who sell at the peak of social fear and the over-leveraged institutions forced to liquidate. The beneficiaries are the data-disciplined entities—sovereign funds, algorithmic trading firms, and seasoned OTC desks—that monitor these convergences. They use this framework not to catch the absolute bottom, but to identify a high-probability zone for accumulation with a favorable risk-reward profile, effectively turning market-wide panic into their strategic advantage.
Santiment’s Five-Dimensional Timing Framework
1. Social Sentiment Extremes (The Fear Gauge)
- Definition: Quantifiable spikes in negative commentary and FUD directly tied to major assets like Bitcoin and Ethereum.
- Data Source: Natural Language Processing (NLP) across forums, social media, and news.
- Operational Meaning: Acts as a contrarian indicator. Peak universal pessimism often coincides with local price bottoms as selling exhausts itself.
2. The “Dip” to “Crash” Linguistic Shift (The Capitulation Signal)
- Definition: The progression in crowd-sourced language from expecting a routine pullback (“dip”) to anticipating total collapse (“crash”).
- Data Source: Trend analysis of keyword pairs and phraseology.
- Operational Meaning: Flags a psychological breaking point. This shift indicates a move from concern to panic, a hallmark of capitulation events that frequently precede rebounds.
3. Trending Bearish Narratives (The Confidence Break)
- Definition: The rise of hyperbolic, zero-value narratives (e.g., “[Asset] is going to $0”) becoming mainstream discussion topics.
- Data Source: Tracking the velocity and spread of specific doom-based keywords and phrases.
- Operational Meaning: Suggests a breakdown in fundamental conviction among the retail cohort. This emotional surrender clears the path for a sentiment reset.
4. “Buy the Dip” Mentions (The Lagging Intent Indicator)
- Definition: A surge in discussions and plans to purchase during a decline.
- Data Source: Volume of social mentions combining “buy” and “dip” terms.
- Operational Meaning: Interestingly, a cautionary signal. High talk often occurs before actual widespread buying, marking a period where the bottom may be near but not yet in. It highlights the gap between crowd sentiment and crowd action.
5. 30-Day MVRV Ratio (The On-Chain Pain Gauge)
- Definition: A ratio comparing an asset’s current market cap to the realized cap of coins moved in the last 30 days. Values far below 0 indicate recent buyers are at a loss.
- Data Source: Direct, aggregated blockchain transaction data.
- Operational Meaning: Provides objective, financial confirmation of pain. When the MVRV enters the “strongly undervalued” zone, it quantifies that the most recent wave of demand is underwater, reducing the immediate probability of further sell-offs from this group.
How Data is Democratizing (and Professionalizing) Market Timing
Santiment’s framework is a symptom of a deeper, industry-wide transformation. The crypto analyst’s role is evolving from chart interpreter to behavioral data scientist. This shift has profound implications for market structure, leveling the playing field in some ways while raising the stakes in others. The availability of such granular sentiment and on-chain data means sophisticated strategies once reserved for hedge funds are now accessible to any dedicated retail investor with a subscription.
This democratization, however, comes with a caveat: it accelerates the market’s learning curve. Signals that were effective in the 2021 cycle may decay faster as more participants act on them. This forces continuous innovation in analytics, pushing firms like Santiment to develop more nuanced, composite indicators. The industry impact is a move towards a more efficient, if not less volatile, market where mispricings based purely on emotion are identified and arbitraged away more quickly. This pressures traditional “gut feel” traders and rewards those who build systematic processes around data ingestion and analysis.
Furthermore, this trend is blurring the lines between crypto-native analytics and traditional quantitative finance. The MVRV ratio, for instance, is a crypto-specific adaptation of realized capital concepts. Its acceptance as a core indicator paves the way for other blockchain-native metrics to enter the mainstream financial lexicon. The beneficiaries of this shift are the analytics platforms themselves and the educational content creators who can translate complex data into actionable insight. The losers are the pundits and influencers whose authority was based solely on opinion and narrative-spinning, now challenged by transparent, verifiable data.
Future Paths: The 2026-2027 Evolution of Market Intelligence
Based on this inflection point, we can project several plausible paths for the evolution of market intelligence and dip-buying strategies over the next 12-18 months.
Path 1: The Mainstreaming of Composite Indices (Most Likely)
The five signals will not remain static. The next logical step is for Santiment and competitors to create weighted, proprietary composite indices that algorithmically combine social sentiment, linguistic shifts, and on-chain metrics like MVRV into a single “Capitulation Score” or “Opportunity Zone” indicator. This productized index would become a standard dashboard item for professional traders, further institutionalizing the methodology. Retail would follow through simplified versions on consumer apps.
Path 2: The AI Arms Race and Signal Decay
As these signals gain popularity, an arms race will ensue using AI to detect them faster. AI agents will be trained to scan social sentiment and on-chain data in real-time, executing micro-dip buys automatically the moment a predefined threshold is crossed. This could lead to “flash accumulation” events, compressing the buying window from days to hours or minutes. A significant risk here is signal decay: if too much capital acts on the same automated trigger, the predictive power of the signal erodes, necessitating ever-more-sophisticated and latent indicators.
Path 3: Regulatory Scrutiny and “Insider Data” Debates
Should these data-driven strategies become overwhelmingly effective, they could attract regulatory attention. Regulators may question whether aggregated social sentiment data constitutes a form of market manipulation if used by large, coordinated actors. Furthermore, the line between public data and a material, non-public analytical edge could be debated. This path would create compliance overhead for funds using these strategies but could also solidify the legal standing of on-chain analytics as a legitimate, transparent research tool.
Practical Implications for Different Market Participants
The adoption of this framework has divergent practical implications across the crypto ecosystem. For the average retail investor, it provides a psychological anchor. Instead of feeling compelled to act on every panic-inducing headline, they can refer to objective data to gauge whether the market is in a state of extreme fear. It shifts their role from gambler to observer-with-a-checklist, which alone can prevent catastrophic emotional selling.
For active traders and fund managers, this becomes a core component of risk management and entry strategy. It doesn’t guarantee a bottom but defines a high-conviction zone for deploying capital. It allows for scaling into positions based on the confluence of signals rather than making a single, all-or-nothing timing bet. Their job now includes monitoring the divergence between social narrative and on-chain holder behavior, a key tell for market health.
For project founders and treasury managers, understanding these signals is crucial for managing community expectations and planning treasury deployments. If their project’s social sentiment is in extreme fear while its on-chain holder metrics remain strong (a divergence), that’s a strategic communication opportunity. Conversely, they might time buybacks or foundation purchases to coincide with these market-wide signals of capitulation, demonstrating savvy capital allocation and confidence to their community.
What is Santiment? The Company Behind the Data
Santiment is not merely a data provider; it is a behavioral analytics platform built specifically for the cryptocurrency market. Founded on the premise that blockchain data and crowd sentiment are alpha-generating assets, it has positioned itself as the bridge between raw on-chain information and actionable trading intelligence. Its core mission is to quantify the “why” behind price movements by tracking the actions and emotions of market participants.
Tokenomics and Business Model:
Santiment operates with a utility token, SAN. The token provides access to its platform, with tiered membership levels granting varying degrees of data depth, API access, and custom feed capabilities. This model aligns the platform’s success with user adoption. The more valuable the insights, the greater the demand for SAN to access them. Its business model is a hybrid of SaaS (Software-as-a-Service) via token-gated access and B2B enterprise data feeds for institutional clients.
Roadmap and Positioning:
Looking forward, Santiment’s roadmap is likely focused on three pillars: deeper AI/ML integration to provide predictive insights, expansion of its data universe to include more granular DeFi and NFT metrics, and the development of more turnkey, productized signals like the dip-buying framework for less technical users. Its positioning is unique—it is neither a pure trading terminal like TradingView nor a raw block explorer like Etherscan. It sits in the high-value middle ground as an insight engine, transforming terabytes of blockchain and social data into coherent market narratives and signals.
Conclusion: The Signal in the Noise Marks a New Market Maturity
The publication of Santiment’s five-signal framework in February 2026 is a milestone event that encapsulates the current state of the cryptocurrency market. It signifies a collective move away from superstition and toward empiricism. Buying the dip is being systematically deconstructed from a vague art form into a discipline involving psychology, linguistics, and hard economics.
This trend points to a future where crypto market cycles may become less driven by pure, unadulterated mania and panic, and more by the calculated interplay between emotional crowds and data-driven contrarians. It does not eliminate volatility but provides a sophisticated language for understanding and navigating it. For the long-term health of the industry, this maturation of analytical tools is profoundly positive. It offers a path for investors to build conviction not on hype, but on a verifiable understanding of market mechanics and participant behavior. The era of trading solely on narrative is closing; the era of trading verified by data is firmly here.