pippin (PIPPIN) To Rise Further? This Key Breakout Hints at Potential Upside Move

Key Takeaways
-
PIPPIN surged 19% in 24 hours and is up 142% on the week
-
Price broke out of a descending broadening wedge on the daily chart
-
Strong demand formed near $0.1612 before the rally began
-
PIPPIN reclaimed its 50-day moving average and cleared $0.41 resistance
-
Measured target points toward $0.7472 (~70% potential upside)
-
Losing $0.3407 could delay further gains
$PIPPIN (pippin) — a Solana-based memecoin themed around an autonomous AI unicorn created by Yohei Nakajima — is back in spotlight.
The token surged nearly 19% in the last 24 hours, extending its weekly rally to an impressive 142%, while pushing its market cap toward $450 million. Trading activity has also picked up sharply, with 24-hour volume jumping to $66.2 million (+35.87%).
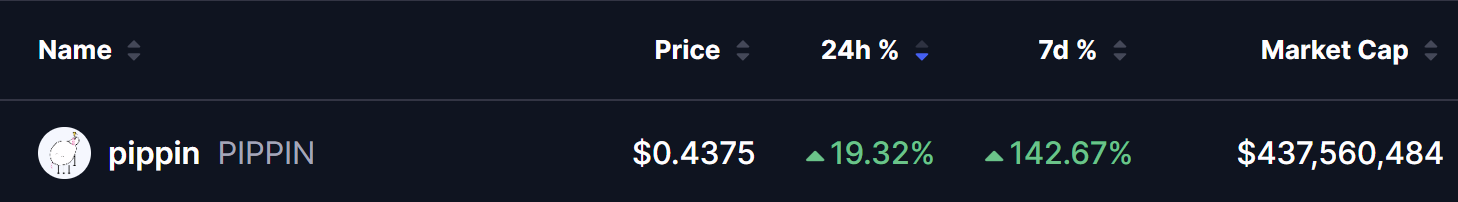
Source: Coinmarketcap
More importantly, the latest chart structure suggests this move may just be getting started.
Descending Broadening Wedge Breakout Signals Trend Shift
As shown on the daily chart, PIPPIN spent the past several weeks consolidating inside a descending broadening wedge — a bullish reversal pattern that often appears near the end of extended pullbacks.
Price found strong demand near the lower boundary of the wedge around $0.1612, where buyers stepped in aggressively. That defense triggered a steady recovery, allowing PIPPIN to reclaim its 50-day moving average before finally breaking above the wedge’s descending resistance near $0.41.
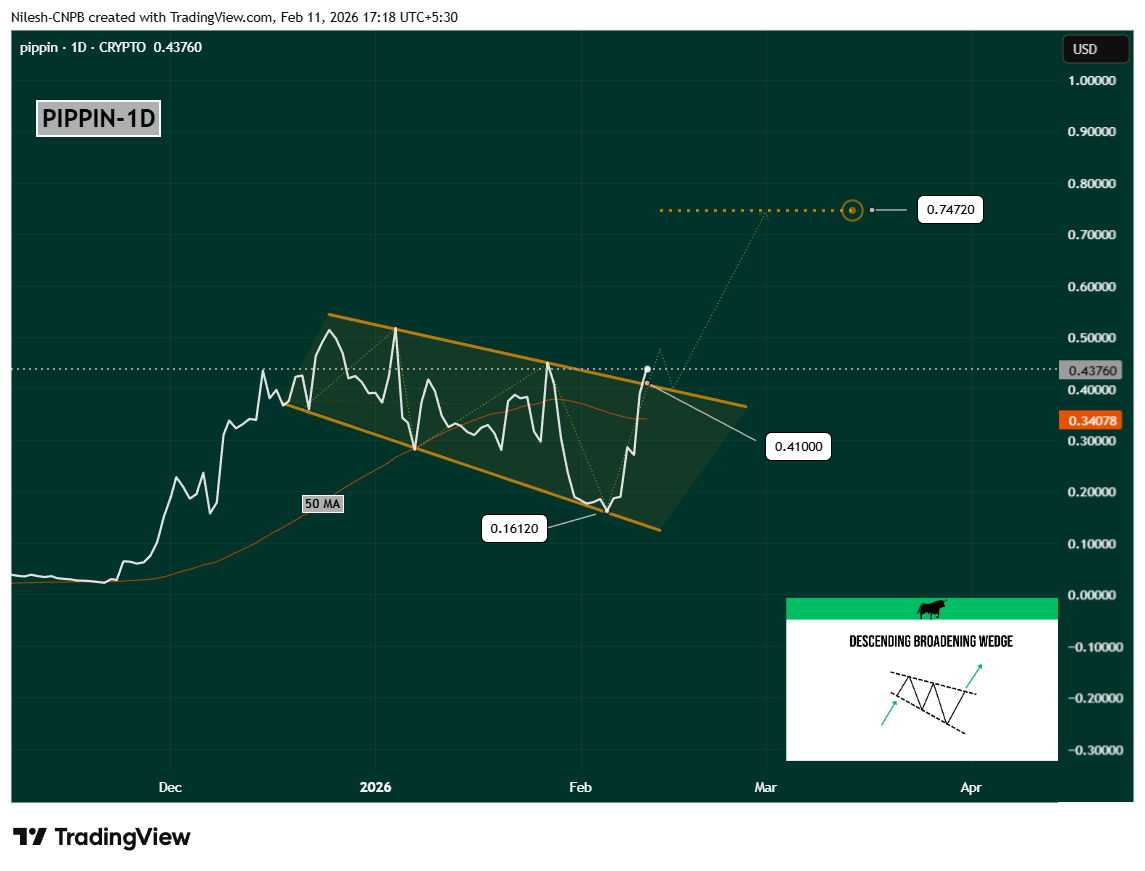
pippin (PIPPIN) Daily Chart/Coinsprobe (Source: Tradingview)
This breakout marked a clear shift in momentum.
Following the move, PIPPIN pushed above $0.4375, signaling early signs of trend reversal as buyers regained control.
What’s Next for PIPPIN?
From a technical perspective, the structure remains constructive.
If bulls can maintain control, PIPPIN may first look to retest the breakout zone near $0.41 and confirm it as new support — a common and healthy behavior after wedge breakouts.
Holding this level could pave the way for continuation higher. Based on the measured move of the descending broadening wedge, a potential upside target sits around $0.7472, implying roughly 70% upside from current levels if momentum stays intact.
This aligns with the broader breakout narrative: higher lows, reclaimed moving average, and expanding volatility — all classic ingredients of a developing bullish phase.
Key Risk to Watch
While the breakout is encouraging, it still needs confirmation — especially given PIPPIN’s historically volatile price action.
If price fails to hold above the former wedge resistance and slips back below the 50-day MA near $0.3407, PIPPIN could fall back into consolidation, delaying the next leg higher. A sustained move back inside the pattern would weaken the bullish thesis in the short term.
For now, however, buyers appear firmly in control, defending the breakout and keeping momentum tilted to the upside.
Disclaimer: The views and analysis presented in this article are for informational purposes only and reflect the author’s perspective, not financial advice. Technical patterns and indicators discussed are subject to market volatility and may or may not yield the anticipated results. Investors are advised to exercise caution, conduct independent research, and make decisions aligned with their individual risk tolerance.
About Author: Nilesh Hembade is the Founder and Lead Author of Coinsprobe, with over 5 years of experience in the cryptocurrency and blockchain industry. Since launching Coinsprobe in 2023, he has been providing daily, research-driven insights through in-depth market analysis, on-chain data, and technical research.