Gold Holds Key Support — Could This Pattern Trigger a Upside Breakout?

Key Takeaways
-
Gold is holding rising trendline support near $4,889 while forming a bullish ascending triangle on the 4H chart.
-
A reclaim of the 100 MA (~$5,012) followed by a breakout above $5,090 could open the door toward $5,698, implying 14%+ upside.
-
A decisive close below the ascending support would weaken the bullish setup and risk a deeper short-term correction.
Gold continues to captivate investors amid ongoing market volatility, geopolitical uncertainty, and shifting macroeconomic winds. As of mid-February 2026, spot XAU/USD is trading around $4,950–$4,990, showing a modest rebound from recent dips while consolidating after its explosive rally earlier this year.
At the same time,** Tether Gold (XAUT)** — the tokenized version backed 1:1 by physical gold — is tracking closely near $4,950, down about 1.84% on the day but still up over 14% year-to-date. Meanwhile, Bitcoin continues to lag around the mid-$60K region, highlighting gold’s relative strength so far in 2026.
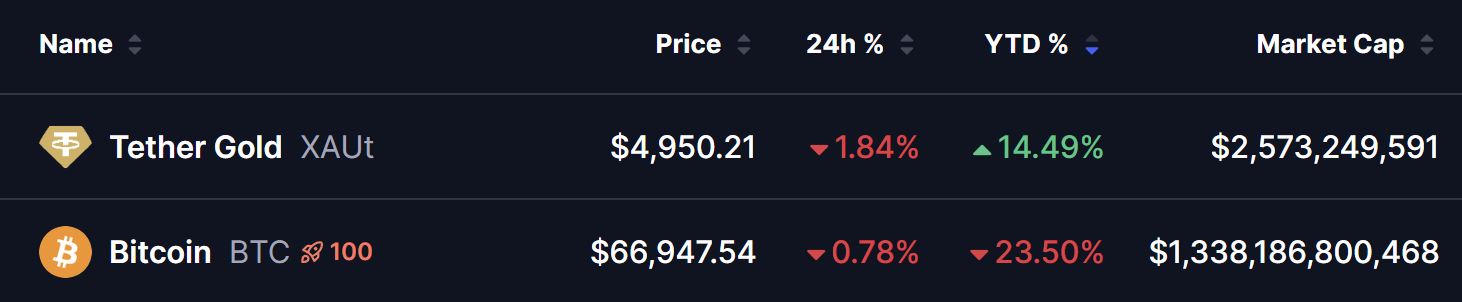
Source: Coinmarketcap
Ascending Triangle Still in Play
The attached 4-hour chart paints a constructive technical picture.
Gold is currently forming a classic ascending triangle — a bullish continuation pattern characterized by:
-
Flat resistance near $5,070–$5,090, where sellers have repeatedly capped rallies
-
Rising trendline support, built from higher lows, with the latest bounce coming from around $4,889
-
Buyers consistently stepping in at higher levels, showing growing demand
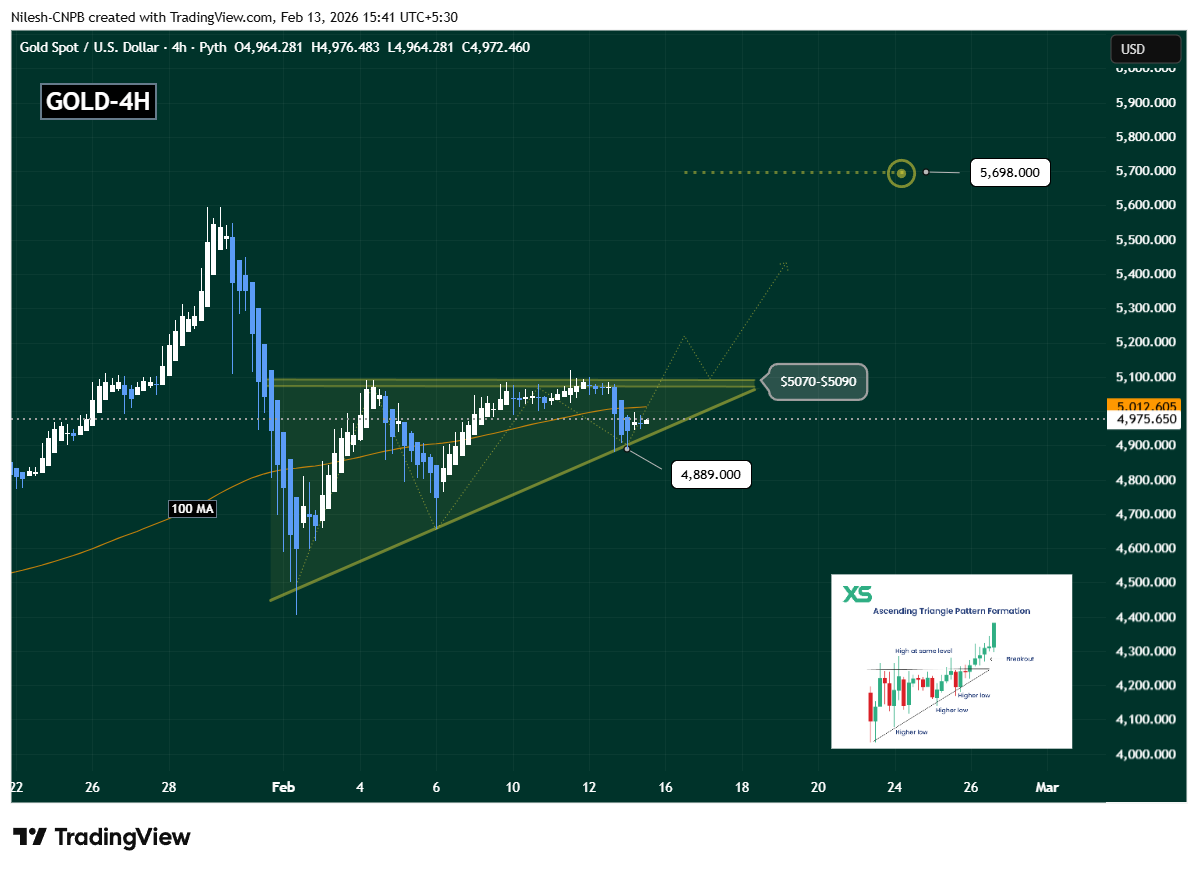
Gold (XAU) 4H Chart/Coinsprobe (Source: Tradingview)
Price is now hovering just above this rising support, suggesting bulls are still defending the structure.
However, gold remains below the 100-period moving average near $5,012, signaling that short-term momentum hasn’t fully flipped bullish yet. A reclaim of this level would be an important early confirmation.
What’s Next for Gold?
As long as gold holds the ascending trendline near $4,889, the bullish triangle remains intact.
The first step higher would be a clean move back above the 100 MA. If buyers manage that — followed by a decisive break and close above $5,090 — the chart opens the door for a measured move toward roughly $5,698, as projected on the pattern.
That would imply a potential 14%+ upside from current levels and likely confirm a fresh leg higher.
Momentum traders will be watching closely for expanding volume on any breakout attempt, which would strengthen the bullish case.
Key Risk to Watch
The bullish setup isn’t guaranteed.
A decisive 4H or daily close below the rising trendline would weaken the ascending triangle and could invite a deeper short-term pullback, shifting momentum back toward sellers.
Until then, gold remains in consolidation — but importantly, it’s consolidating above rising support, not breaking down.
Final Thoughts
Gold appears to be digesting gains rather than rolling over.
With higher lows still intact and resistance clearly defined, price is coiling for its next major move. If buyers can reclaim the 100 MA and push through the $5,090 ceiling, this setup could quickly transition from consolidation to another upside breakout.
For now, all eyes are on $4,889 support and $5,090 resistance — whichever breaks first is likely to define gold’s next directional move.
Disclaimer: The views and analysis presented in this article are for informational purposes only and reflect the author’s perspective, not financial advice. Technical patterns and indicators discussed are subject to market volatility and may or may not yield the anticipated results. Investors are advised to exercise caution, conduct independent research, and make decisions aligned with their individual risk tolerance.
About Author: Nilesh Hembade is the Founder and Lead Author of Coinsprobe, with over 5 years of experience in the cryptocurrency and blockchain industry. Since launching Coinsprobe in 2023, he has been providing daily, research-driven insights through in-depth market analysis, on-chain data, and technical research.