Kaspa Crosses 600 Million Transactions: One of Crypto’s Most Underrated Growth Stories
Kaspa just hit a big milestone that most networks can only dream about: 600 million confirmed transactions. A Kaspa community member showed the scale of that achievement by putting it next to Bitcoin’s long-term averages, and the comparison is honestly worth exploring.
Kaspa has been live for about 1,552 days, which works out to roughly 386,000 transactions per day on average. Bitcoin, despite being around far longer at over 6,000 days old, averages closer to 172,000 daily transactions. The takeaway is clear: Kaspa’s throughput and activity are operating at a completely different pace, and the network is proving that scalability isn’t just a buzzword.
On-chain, this looks like real usage. The transaction chart shows activity rising sharply into recent highs, with the last 30 days printing a strong upward curve. For a project that markets itself around speed and efficiency, that kind of growth is exactly what supporters want to see.
But here’s where things get complicated.
Kaspa Price Analysis: Growth Is Surging, But Price Action Isn’t Following
Despite the impressive network metrics, Kaspa’s price action has been far less inspiring.
On the Kaspa chart, we can see that token has spent weeks grinding lower from the early January highs near the $0.05 region. The trend has been defined by lower highs and persistent sell pressure, with only short-lived bounces along the way. Even after the recent transaction milestone, price is still hovering around the $0.032 zone, struggling to reclaim any meaningful upside structure.
Support zones
- $0.030–$0.031: This is the immediate floor where buyers have stepped in multiple times. A breakdown below this area would expose the next major support.
- $0.028–$0.029: The recent local bottom zone. If price slips back here, it signals weakness returning quickly.
- $0.024–$0.025: The deeper flush level from early February. That’s the line bulls absolutely cannot afford to lose.
Resistance zones
- $0.034–$0.035: The first overhead barrier. Kaspa keeps failing to build acceptance above this range.
- $0.040–$0.042: The bigger resistance band from the prior breakdown. A recovery rally would need to flip this zone to shift sentiment.
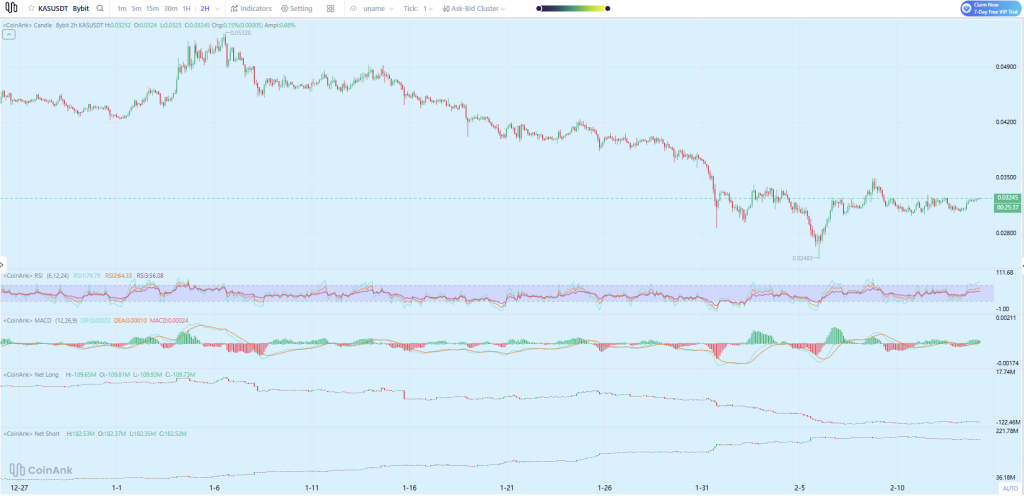
Source: CoinAnk
RSI
RSI is sitting in the upper-neutral zone, around the high 50s to near 60. That shows some stabilization, but it’s not signaling strong momentum. There’s no real breakout pressure here yet, more like price drifting sideways after a downtrend.
MACD
MACD has started to curl slightly bullish, but the move is weak. The histogram is barely positive, which usually points to a market that is trying to bottom but doesn’t have enough strength to trend higher yet.
Net longs vs net shorts
The positioning data is arguably the most telling. Net longs have been steadily declining over the past month, showing that bullish conviction has been leaking out. Net shorts remain elevated, and the imbalance suggests traders are still comfortable fading rallies instead of chasing upside.
That’s a very different setup compared to something like TAO, which just ripped 30% in one day on strong catalysts and aggressive positioning pressure. Kaspa’s on-chain growth is real, but the market is not rewarding it right now.
Kaspa may be one of the most scalable networks in crypto, but price action is still stuck in a slow bleed. Until the KAS price can reclaim key resistance levels and show buyers stepping in with force, the disconnect between adoption metrics and market performance remains hard to ignore.
For now, Kaspa’s fundamentals are surging. The chart, however, is still waiting for a reason to care.
Read also: Kaspa Is the Most Bullish Project in Crypto Right Now, CoinMarketCap’s Data Shows