Top 3 altcoins leading the market correction today - February 16
Meme coins like Dogecoin (DOGE) and Bonk (BONK), along with the privacy coin Zcash (ZEC), are becoming the focus of a correction wave as they lead the overall decline of the cryptocurrency market over the past 24 hours. After three consecutive days of recovery, DOGE, ZEC, and BONK unexpectedly reversed sharply downward on Sunday, as their gains were halted at key resistance levels. From a technical perspective, these altcoins are signaling weakness, indicating that the risk of further decline remains present as the market enters a new trading week under significant pressure.
Dogecoin Faces Risk of Losing Key Psychological Support
At the time of writing on Monday, Dogecoin is fluctuating around the psychological level of $0.1000, temporarily holding this important support after a 7% drop on Sunday. However, the recovery remains fragile as the 50-day exponential moving average (EMA) continues to act as a barrier, restricting upward momentum. The downward slope of this EMA further reinforces the view that the bearish trend still dominates the market.
On the support side, the likely retest zone is the October 10 low at $0.0950. If selling pressure increases, Dogecoin could fall further to the next strong support around $0.0800, corresponding to the February 6 low.
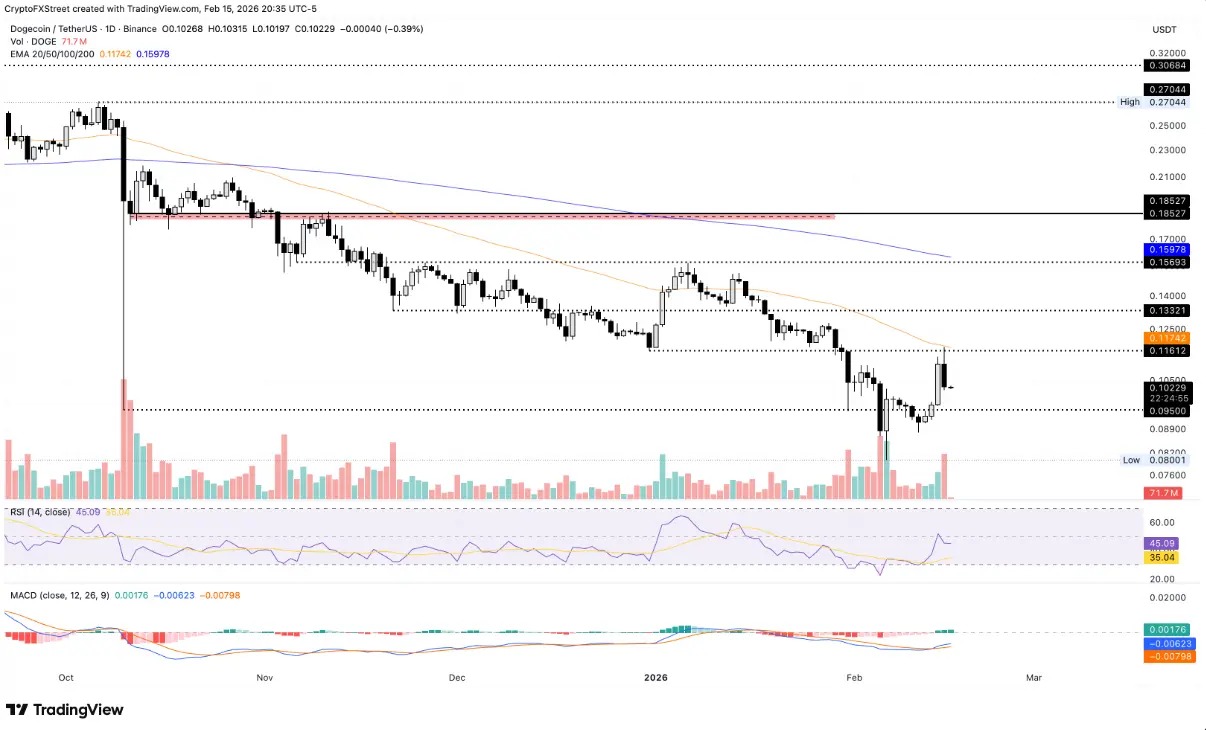 Daily DOGE/USDT chart | Source: TradingView Technical indicators on the daily timeframe still signal a neutral stance. The Relative Strength Index (RSI) is at 45, slightly below the neutral line, indicating a balance between buying and selling forces. Meanwhile, the MACD and signal line remain below zero, although the positive histogram bars are gradually expanding, suggesting weakening downward pressure.
To confirm a sustainable recovery, Dogecoin needs to reclaim the 50-day EMA at around $0.1174. If it surpasses this level, the price is likely to target the next resistance zone near $0.1332 — the area coinciding with the November 21 low.
Zcash Below $300 May Face Further Downward Pressure
Zcash plunged nearly 8% on Sunday after failing to break through the resistance trendline formed by the peaks on December 29 and January 7 on the daily logarithmic chart. On Monday, selling pressure remained dominant as the price continued to decline by over 1%, breaking below the 200-day EMA at around $298.
Just below this level, the next notable support zone is at the 38.2% Fibonacci retracement level near $231. This Fibonacci level is derived from the August 20 low of $34.45 to the November 7 high of $750, serving as an important buffer in a deeper correction scenario.
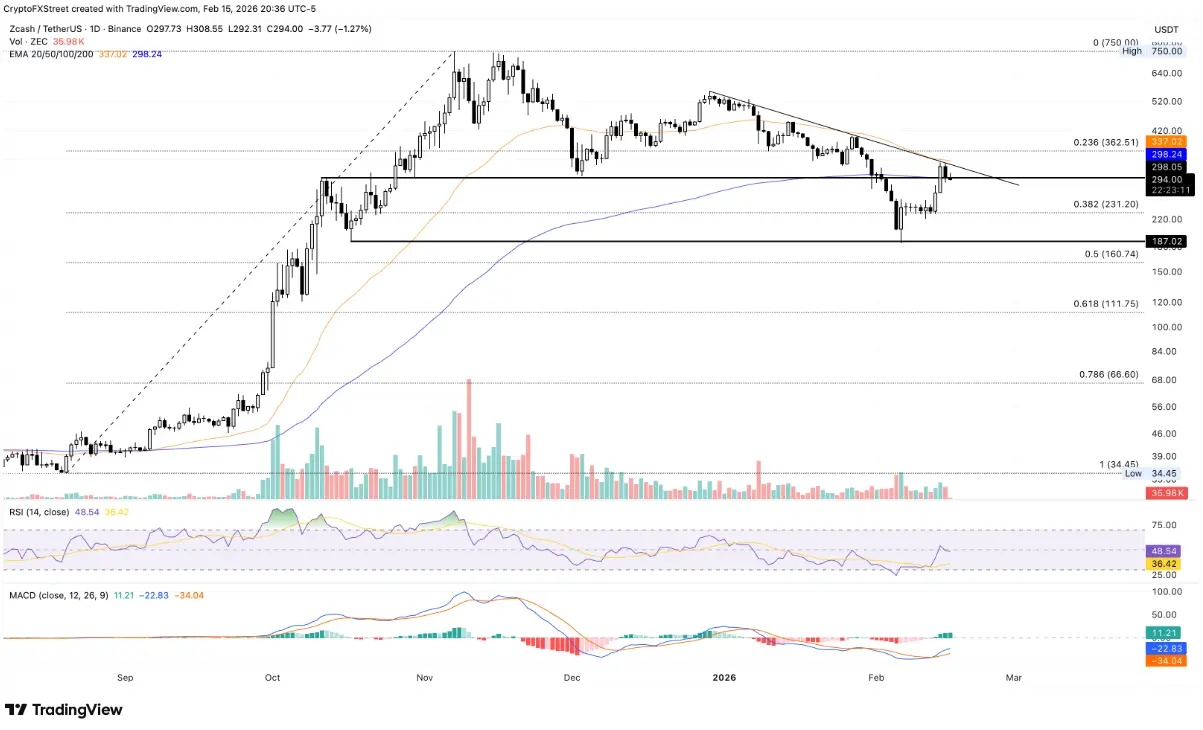 Daily ZEC/USDT chart | Source: TradingView Regarding momentum, the RSI on the daily chart is at 48, reflecting a neutral market condition. Meanwhile, the MACD and signal line are still trending upward, with positive histogram bars continuing to expand. This indicates that Zcash’s overall trend remains neutral to positive, despite the short-term correction.
In a recovery scenario, if the price bounces back from the 200-day EMA, Zcash could soon test the upper trendline, aligning with the 50-day EMA near $337. A clear daily close above this level could boost the momentum to extend the rally toward the 23.6% Fibonacci level at $362, before targeting the key psychological level of $500.
Bonk Cannot Break Through Key Resistance Zone
As of Monday, Bonk’s price remains above the $0.0000650 level, despite a 9% decline in the previous session. This correction nearly erases the 14% gain recorded on Saturday, increasing the risk of a retest of the February 5 low around $0.0000576. The current weakening also indicates that the resistance at $0.0000719 has been effective in halting the recovery attempt on Sunday.
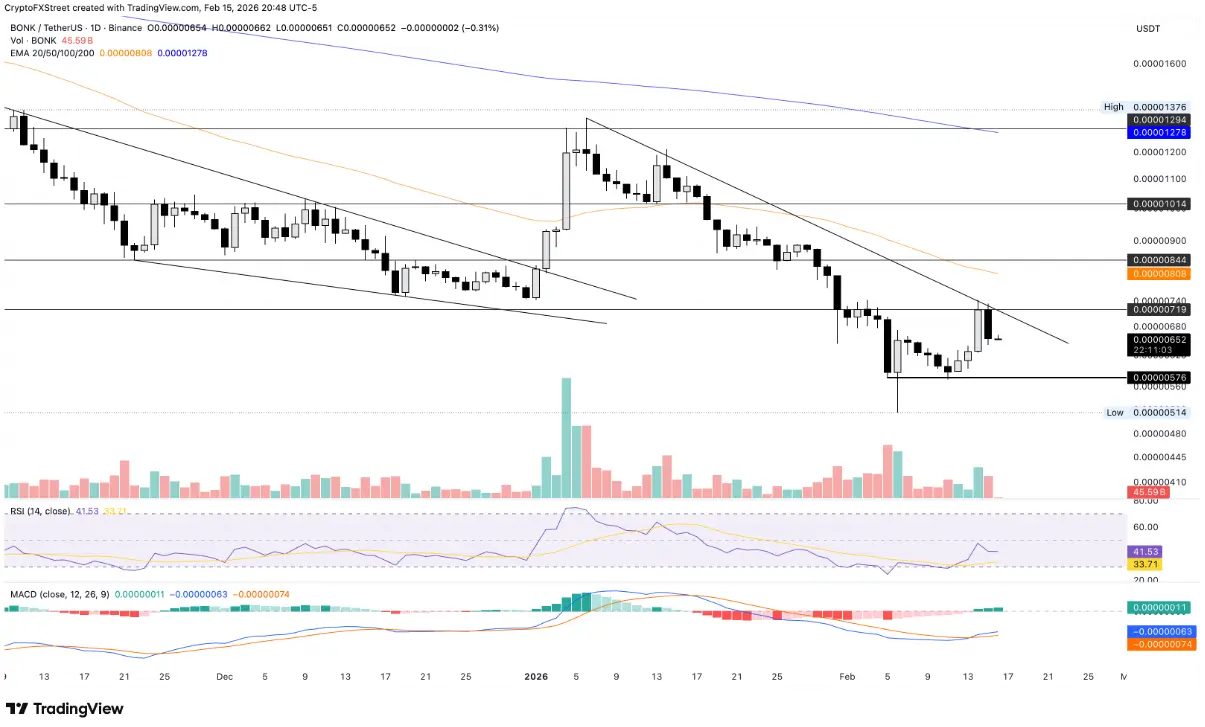 Daily BONK/USDT chart | Source: TradingView On the technical indicators, RSI is around 41, moving sideways just below the neutral level after a slight rebound from oversold conditions, suggesting selling pressure has eased somewhat. Additionally, the MACD remains in a bullish crossover since Friday, with the histogram bars above and continuing to grow — reflecting ongoing bullish momentum.
However, to establish a more sustainable recovery trend, Bonk needs to successfully break through the resistance at $0.0000719, opening the possibility of targeting the 50-day EMA at $0.0000808.