Cardano (ADA) faces a survival phase as retail buying momentum weakens
Cardano (ADA) is trading below the $0.2800 mark as of the time this article was written on Monday, after recording a 4% decline in the previous session. At the start of the week, interest from retail investors in ADA remains quite subdued, reflected in the continued decline of open contracts and the funding rate remaining in negative territory. From a technical perspective, Cardano is currently at a critical crossroads, as momentum has clearly weakened and is gradually shifting to a neutral state, signaling market hesitation.
Cardano Struggles to Maintain Attention in the Crypto Market
After a period of enthusiasm driven by the LayerZero integration plan and preparations for the March launch of the Midnight mainnet, Cardano is gradually losing its appeal among retail investors. These developments were announced by founder Charles Hoskinson on Thursday at Consensus Hong Kong 2026, an annual event organized by CoinDesk.
According to data from CoinGlass, the open interest (OI) of ADA futures contracts has sharply decreased to $447.07 million, a 9.55% drop within 24 hours. This indicates significant capital outflows from the ADA derivatives market, likely due to large-scale liquidations. During the same period, total liquidation value of long positions reached $932,080, far exceeding the $84,010 of short positions, reflecting a strong “sweep” of bullish bets. As a result, the long/short ratio plummeted below the equilibrium level of 1, now at only 0.9619, showing that bears are clearly in control of the ADA derivatives market.
Notably, the funding rate at -0.0076% further reinforces the bearish sentiment, as traders are required to pay fees to maintain short positions to keep swap prices aligned with the spot market. If this pressure persists, it could lead to a significant drop in derivative prices below the spot price, increasing the risk of a sharp short-term decline.
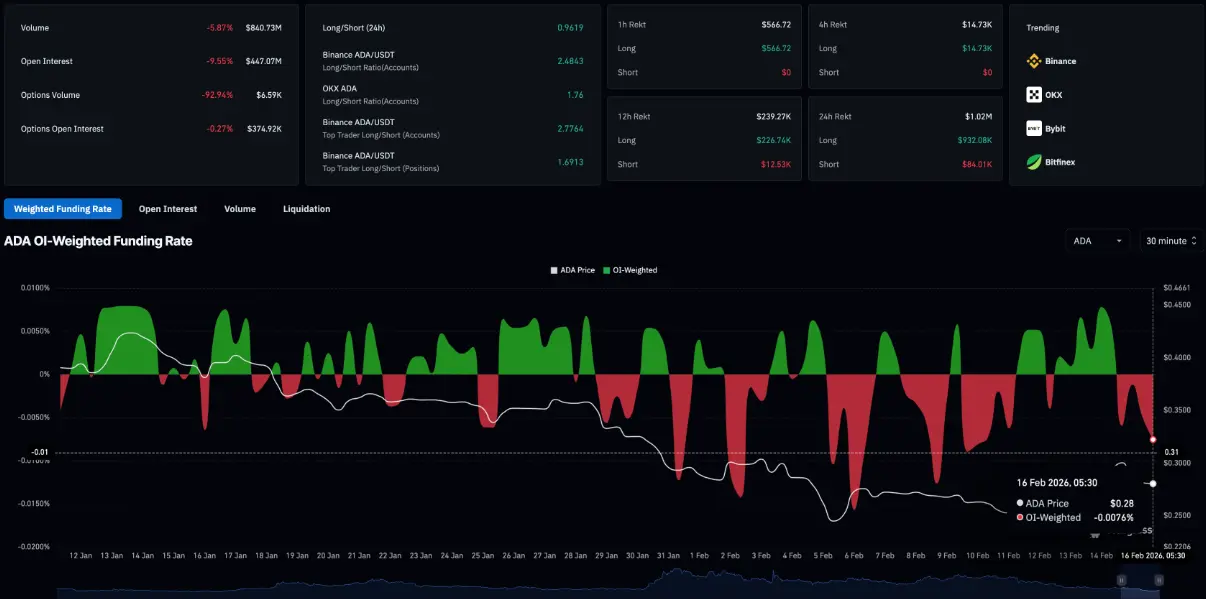 ADA Derivatives Data | Source: CoinGlass
Technical Outlook: Will Cardano Continue Its Downtrend?
After falling out of the top 10 largest cryptocurrencies by market cap, Cardano is still struggling to regain its lost momentum. At the time of writing, ADA is trading just above the 50-period EMA on the 4-hour chart, around $0.2772 — a short-term support zone. However, the steep downward slope of the 200-period EMA at $0.3129 continues to indicate a prevailing bearish trend.
In a negative scenario, if ADA loses the $0.2772 level, the price could retreat to test the 50% Fibonacci retracement at $0.2669. This level is derived from the February 3 high of $0.3050 down to the February 6 low of $0.2289 and is considered the next important support zone.
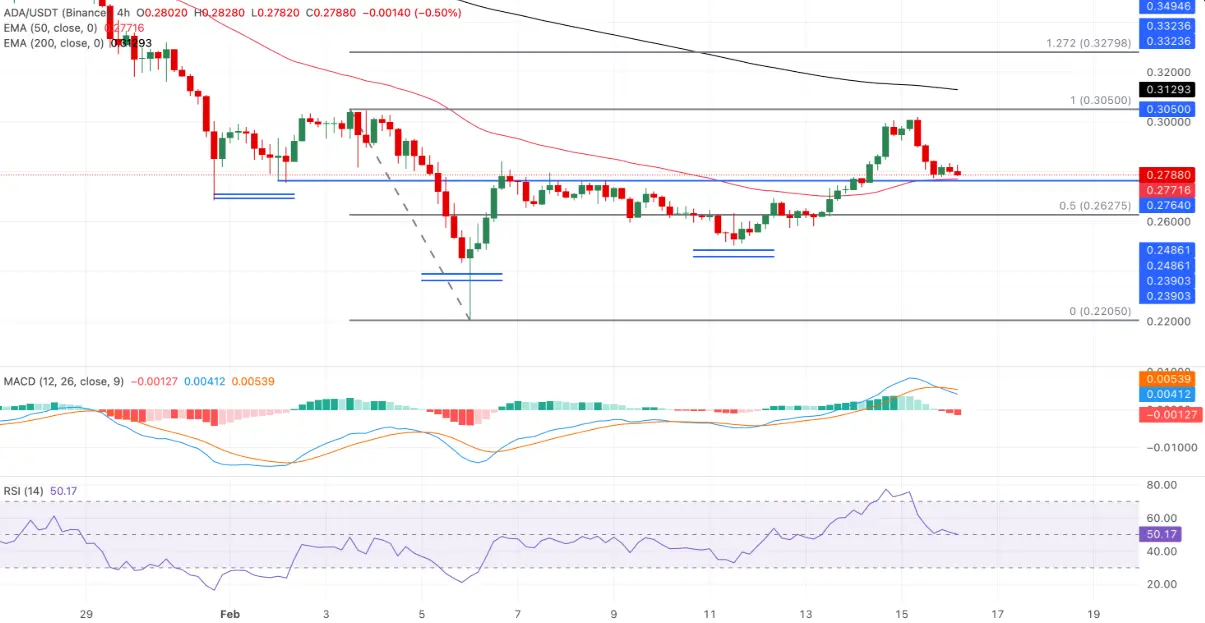 ADA/USDT 4-Hour Chart | Source: TradingView
Momentum indicators also send bearish signals. On the 4-hour timeframe, the MACD has crossed below its signal line earlier today, reflecting renewed selling pressure. The negative histogram continues to expand below zero, reinforcing the view that bears are in control of the short-term trend.
Meanwhile, the RSI currently hovers around 52 and moves sideways near the centerline, indicating that momentum is temporarily stable after the recent rebound but not strong enough to confirm a clear bullish trend.
However, the bullish scenario has not been entirely ruled out. The formation of higher lows, along with a breakout above the resistance at $0.2764 — which previously limited the recovery on February 6 — still offers hope for an upward trend. To establish a sustainable recovery, ADA needs to break above $0.3050, paving the way toward the 200 EMA at $0.3129 and further toward the 1.272 Fibonacci extension at $0.3279.
SN_Nour