Search volume for cryptocurrencies reaches its lowest level in 2022 – Is market demand drying up?
Cryptocurrency market psychology continues its prolonged downward trend, marking the fifth consecutive month ending in red in February, reflecting persistent selling pressure.
Negative signals continue to spread as the bears maintain control, clearly demonstrated through on-chain data and technical indicators. Market momentum remains weak, investor participation has declined, and liquidity conditions are still fragile.
In the context of a deep recession, investor behavior extends beyond typical price charts, providing important insights. External signals, especially online search behavior, can offer a deeper perspective on attention cycles and capital investment intentions.
This analysis uses Google search interest for the keyword “crypto” as a behavioral indicator to assess whether the market is approaching exhaustion or preparing for a structural recovery.
Decline in Search Interest
Search interest in cryptocurrency-related keywords has long been considered a reliable indicator of market engagement.
Growth periods in search activity often coincide with increased demand and rising asset values. Conversely, sharp declines in search volume typically reflect risk aversion and capital preservation tendencies among investors.
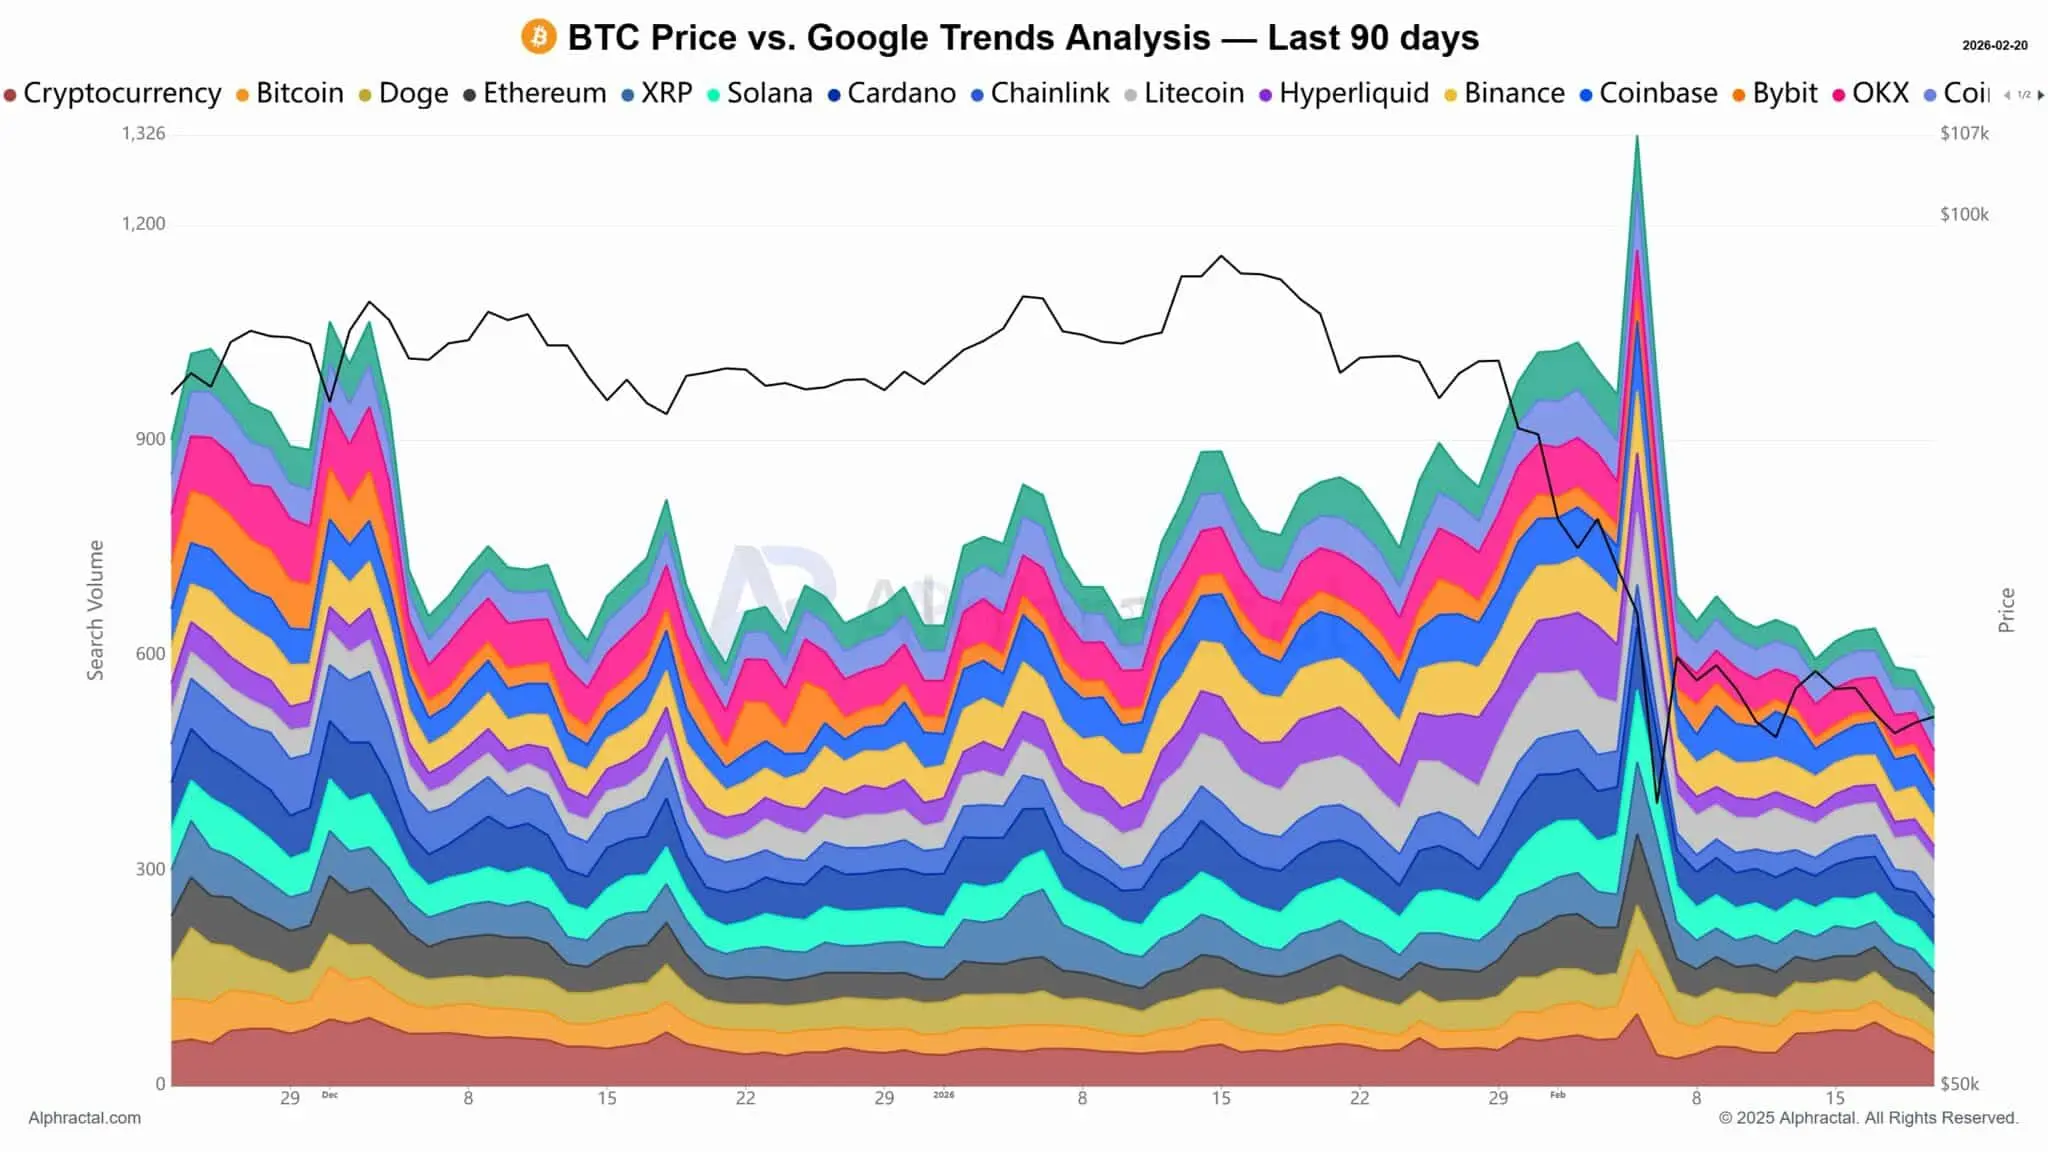 Source: Alphractal Historical data analysis shows a significant correlation between price volatility (black line) and changes in search interest. Although not perfectly synchronized, both indicators tend to move in the same direction across market cycles.
Currently, Google search interest in cryptocurrencies has fallen to one of the lowest levels since 2022. User engagement on major platforms like Twitter, YouTube, Facebook, and Instagram has also dropped sharply, further reinforcing the broad decline in attention.
This trend indicates that capital has shifted into safer assets such as stablecoins, fiat currencies, or traditional defensive assets.
The overall market decline has coincided with approximately $1.96 trillion USD being withdrawn from the sector, reflecting both deleveraging and risk-avoidance strategies.
Correlation Pattern Analysis
To identify potential turning points, Google Trends data for the “crypto” keyword has been analyzed based on historical price cycles. The results show that this index often closely tracks macro price movements with notable accuracy.
In previous cycles, low search interest levels often marked local lows and the early stages of broader recovery trends. Similar patterns were observed in May 2021, September 2023, October 2024, and April 2025, although usually with some delay relative to price action.
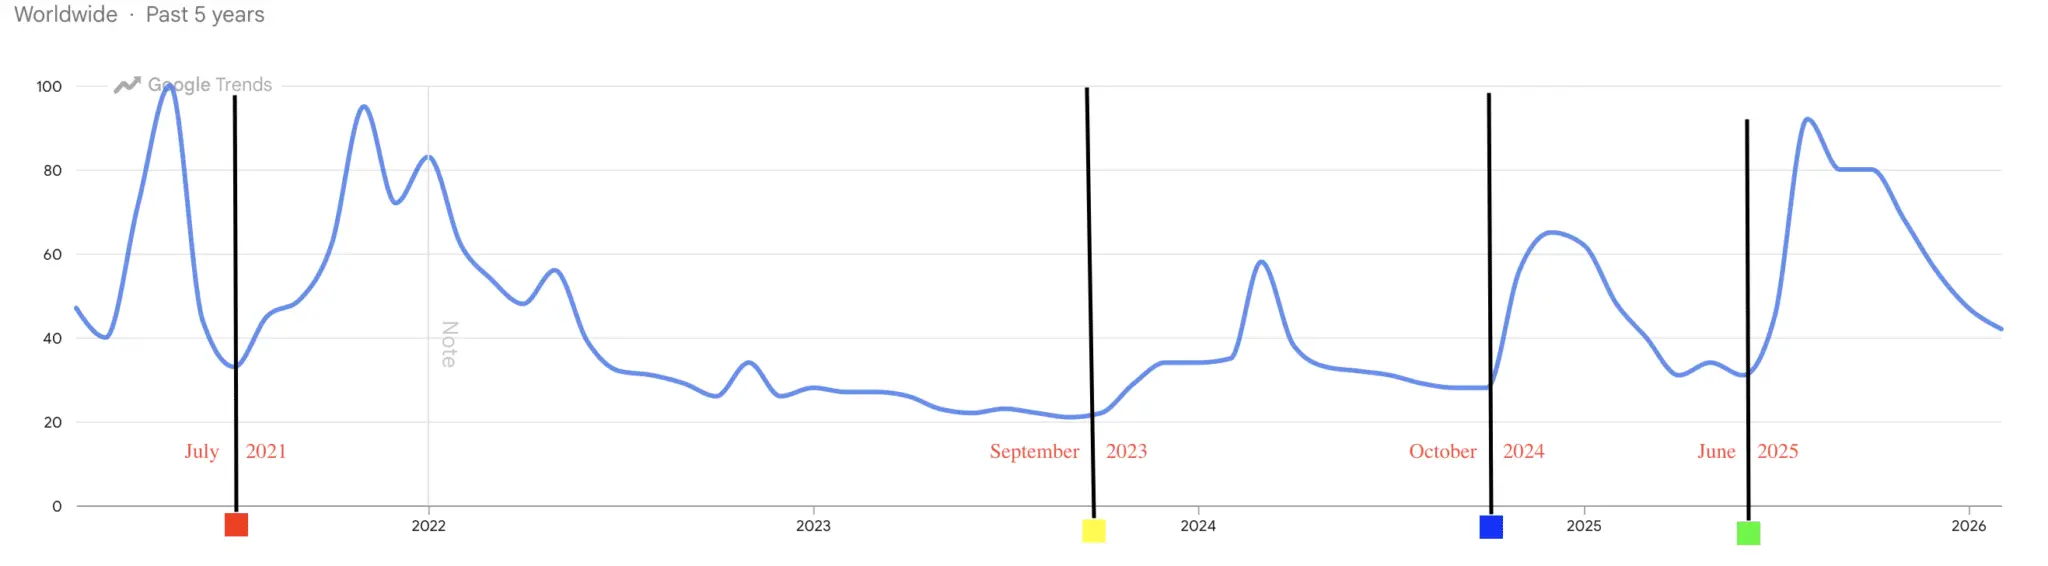 Source: Google Trends Two key thresholds of search interest at 31 and 28 have historically aligned with major market turning points. Currently, the index hovers around 42%, indicating that further tightening may be needed before market sentiment can reset.
While search interest alone does not guarantee an imminent recovery, these thresholds remain important in market structure. At the same time, price action is approaching a key support zone (marked in green on the chart), where previous accumulation phases have occurred.
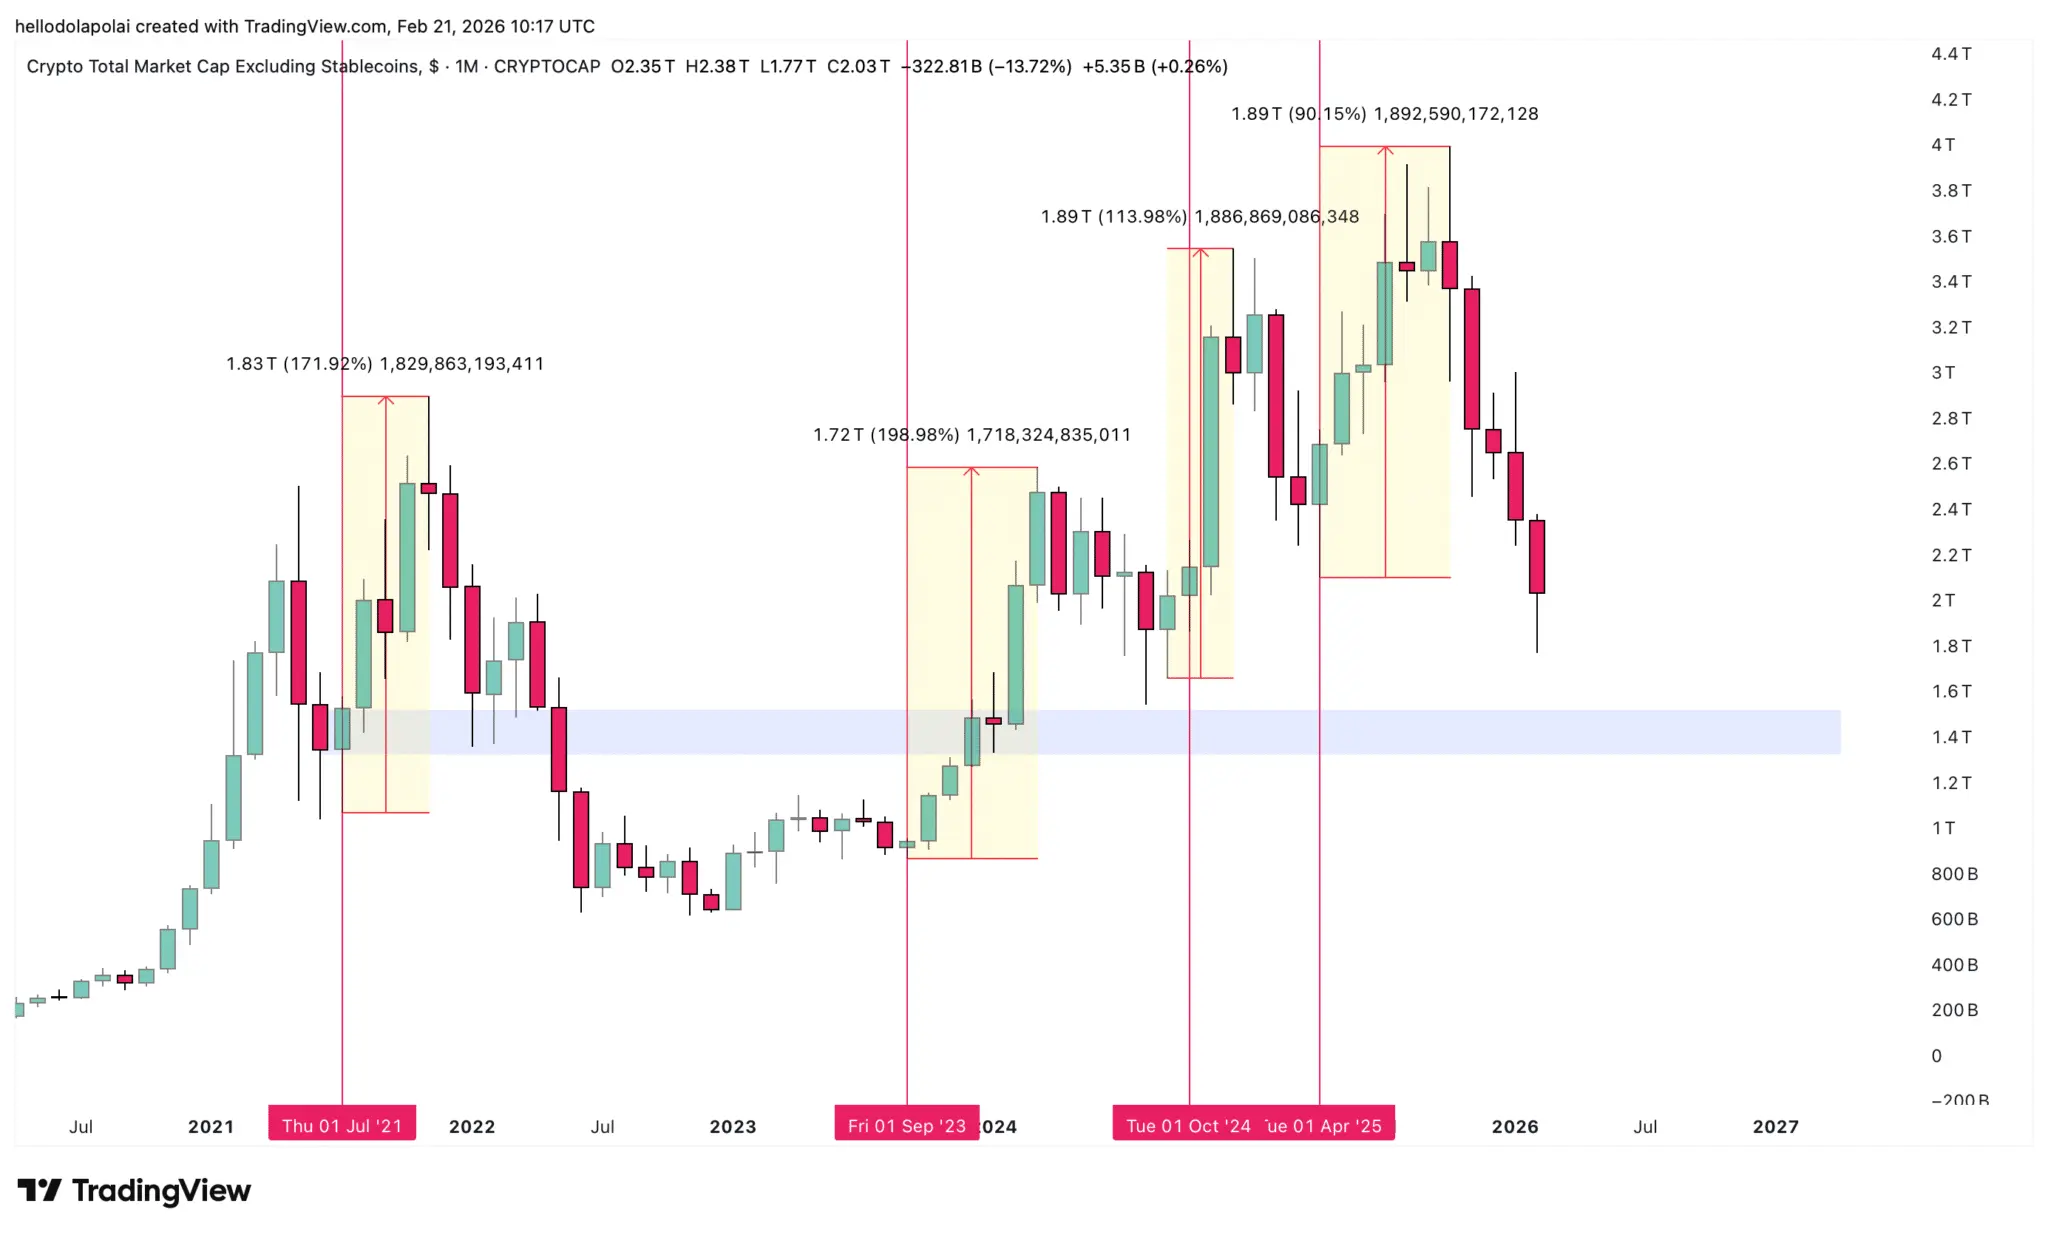 Source: TradingView In addition to search behavior, broader market sentiment indicators also provide supporting evidence.
Fear and Greed Index
The Fear and Greed Index has recently hit the “Extreme Fear” level, a zone often associated with medium-term recoveries in history.
Although this index does not pinpoint exact timing, similar past cases often coincided with accumulation phases followed by price expansions. The current levels represent one of the most pronounced fear environments in recent cycles.
Bitcoin Dominance as a Liquidity Indicator
Bitcoin still dominates a large portion of market liquidity, with a dominance rate of 58.29% according to CoinGlass data. Monitoring Bitcoin’s dominance can provide insights into initial recovery movements.
During recovery phases, capital tends to flow into Bitcoin first before moving into more volatile altcoins. Therefore, an increasing Bitcoin dominance often signals the first structural shift in liquidity conditions.
Key thresholds to watch include a break above 60%, with the 64% level serving as a more significant structural marker on the dominance chart. A sustained rise beyond these levels would indicate capital concentration and potential early-stage recovery conditions.
Currently, the market has not confirmed the start of a recovery phase. Liquidity remains limited, and downward volatility cannot be ruled out before the market stabilizes.
However, behavioral indicators and psychological compression suggest the market may be approaching a consolidation phase rather than being in the midst of a decline.