Ether.fi (ETHFI) To Rise Further? Key Harmonic Pattern Signals Potential Upside Move

Key Takeaways
-
ETHFI has formed a Bearish Bat harmonic pattern on the daily chart, suggesting potential upside toward the $0.609–$0.638 PRZ zone.
-
The token is testing the 50-day moving average near $0.57, a key level that could confirm short-term bullish momentum if reclaimed.
-
Holding above the $0.46 support zone remains crucial to maintain the harmonic structure and avoid invalidation.
The broader cryptocurrency market is showing a relief bounce as Bitcoin and Ethereum trade back in the green, each gaining around 3% over the past 24 hours. This rebound is helping several altcoins regain momentum, including Ether.fi, which has surged nearly 15% in the same period.
More importantly, ETHFI’s daily chart is now flashing a well-defined harmonic structure — a setup that often signals a continuation move before a potential reversal. In the current context, the pattern suggests that ETHFI could still have room to push higher in the short term.
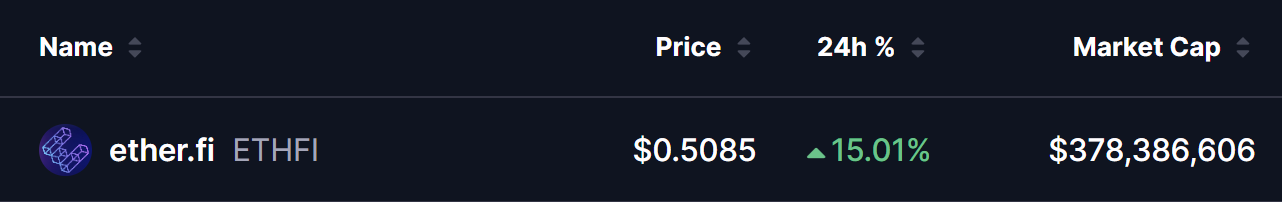
Source: Coinmarketcap
Bearish Bat Pattern in Play
On the daily timeframe, ETHFI appears to be forming a Bearish Bat harmonic pattern. Despite its name sounding negative, this structure typically allows price to rally toward its completion point, known as Point D, before any larger corrective move takes place.
The pattern began forming at Point X near the $0.638 level, followed by a sharp decline toward Point A. From there, the token rebounded into Point B before undergoing a deeper corrective move into Point C around the $0.42 zone. That area proved to be a key demand region, where buyers stepped in decisively and prevented further downside.
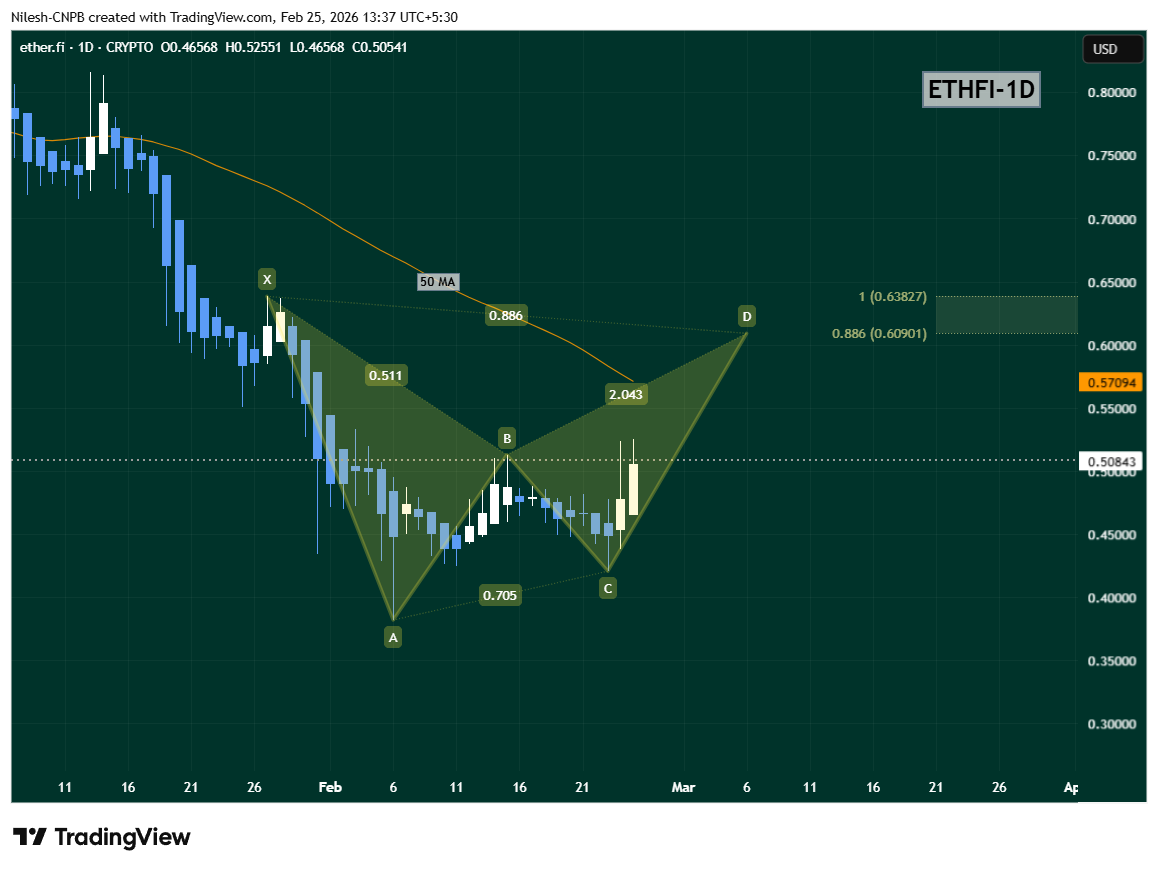
_Ether.fi (ETHFI) Daily Chart/Coinsprobe (Source: Tradingview) _
Since printing the Point C low, ETHFI has steadily recovered and is now trading around $0.50. This rebound signals that selling pressure is gradually weakening while bulls attempt to regain control of short-term momentum.
Adding further technical weight to the setup, the 50-day moving average sits near $0.57. Price is currently testing this level, making it a crucial inflection point. A successful reclaim and sustained hold above the 50-day moving average would strengthen the bullish structure and confirm improving momentum.
What’s Next for ETHFI?
If buyers continue defending the $0.46 support zone and manage to flip the 50-day moving average into support, the harmonic pattern points toward a move into the Potential Reversal Zone. Based on Fibonacci projections, this zone lies between $0.609, which aligns with the 0.886 extension, and $0.638, corresponding to the 1.0 extension of the pattern.
From current levels, that implies a potential upside move of roughly 19% to 25% before the pattern reaches full completion. Harmonic setups often see strong price reactions at this zone, meaning traders will likely monitor it closely for either continuation strength or early signs of exhaustion.
However, the bullish scenario depends heavily on maintaining current support. A breakdown below the $0.46 region would weaken the structure and could delay or invalidate the projected move toward the completion zone.
For now, ETHFI remains technically constructive. With broader market sentiment stabilizing and momentum attempting to shift, the harmonic pattern suggests that the next meaningful move could favor the upside — provided key levels continue to hold.
Disclaimer: The views and analysis presented in this article are for informational purposes only and reflect the author’s perspective, not financial advice. Technical patterns and indicators discussed are subject to market volatility and may or may not yield the anticipated results. Investors are advised to exercise caution, conduct independent research, and make decisions aligned with their individual risk tolerance.
About Author: Nilesh Hembade is the Founder and Lead Author of Coinsprobe, with over 5 years of experience in the cryptocurrency and blockchain industry. Since launching Coinsprobe in 2023, he has been providing daily, research-driven insights through in-depth market analysis, on-chain data, and technical research.