Cosmos Hub (ATOM) is experiencing a slight uptick, but downward pressure still exists.
The price of Cosmos Hub (ATOM) shows a recovery, trading around $2.05 at the time of writing on Wednesday, after a deep correction that started last week. However, weakening signals from on-chain data and the derivatives market still lean toward a bearish scenario, while technical analysis does not yet show clear signs of improvement.
Selling pressure on ATOM continues
Cosmos Hub’s Social Dominance data from Santiment clearly points to a negative outlook. This index reflects the proportion of discussions about ATOM across crypto media. Since mid-January, Social Dominance has been steadily declining, and the downward trend continued into February, dropping to just 0.416% on Wednesday. This trend indicates waning market interest and increasingly negative investor sentiment toward ATOM.
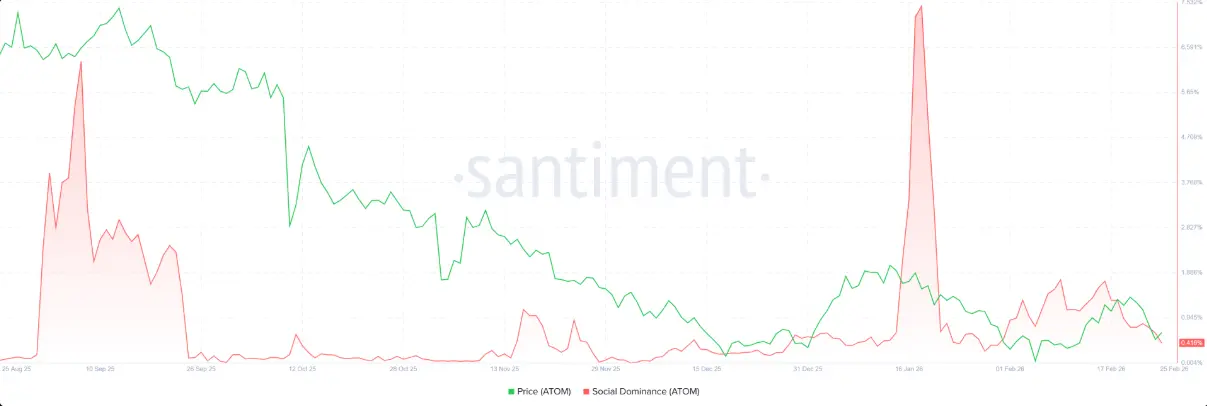 Social dominance chart of ATOM | Source: Santiment
In the derivatives market, the picture is also not very optimistic, as the funding rate for ATOM remains in negative territory — a typical sign of bearish sentiment. This index turned negative on Wednesday, reaching -0.0147%, approaching the level recorded last Sunday, just before ATOM experienced a sharp drop the next day. A negative funding rate means short sellers pay fees to long buyers, reflecting expectations of falling prices for Cosmos Hub.
Social dominance chart of ATOM | Source: Santiment
In the derivatives market, the picture is also not very optimistic, as the funding rate for ATOM remains in negative territory — a typical sign of bearish sentiment. This index turned negative on Wednesday, reaching -0.0147%, approaching the level recorded last Sunday, just before ATOM experienced a sharp drop the next day. A negative funding rate means short sellers pay fees to long buyers, reflecting expectations of falling prices for Cosmos Hub.
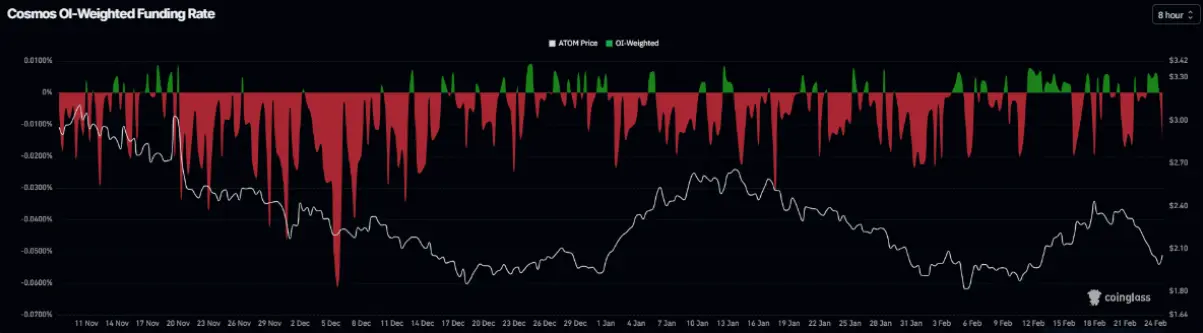 Cosmos Hub funding rate chart | Source: Coinglass
Adding to this perspective, the long/short ratio for ATOM was only 0.92 on Wednesday, and throughout this month, it has only exceeded 1 once. This indicates traders remain cautious about opening long positions. When the long/short ratio is below 1, the market is implicitly betting more on continued decline in Cosmos Hub’s price.
Cosmos Hub funding rate chart | Source: Coinglass
Adding to this perspective, the long/short ratio for ATOM was only 0.92 on Wednesday, and throughout this month, it has only exceeded 1 once. This indicates traders remain cautious about opening long positions. When the long/short ratio is below 1, the market is implicitly betting more on continued decline in Cosmos Hub’s price.
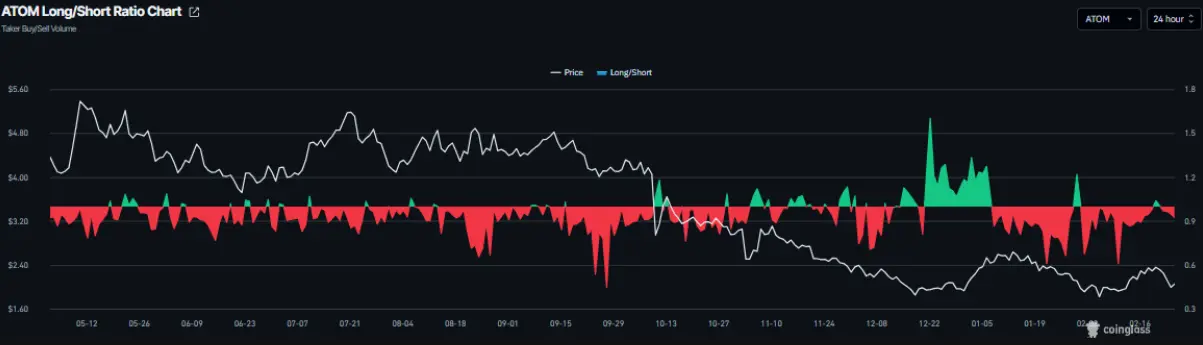 ATOM long/short ratio | Source: Coinglass
Cosmos Hub Price Forecast: Bears Limit Recovery
ATOM is fluctuating around $2.05 as of Wednesday. In the short term, technical signals lean toward cautious optimism, as the price rebounded from below $2.00. However, the recovery remains limited because ATOM continues to trade significantly below its 50-day and 100-day EMAs, which are around $2.19 and $2.39 respectively — restraining the overall upward trend.
The RSI indicator has recovered to 44 after leaving oversold territory and is trending upward, indicating buying pressure is improving but not yet strong enough to dominate. Meanwhile, the MACD has slightly dipped below the signal line and moved closer to zero; the shrinking histogram weakens bullish confidence and suggests the market may be entering a consolidation phase after the recent rebound.
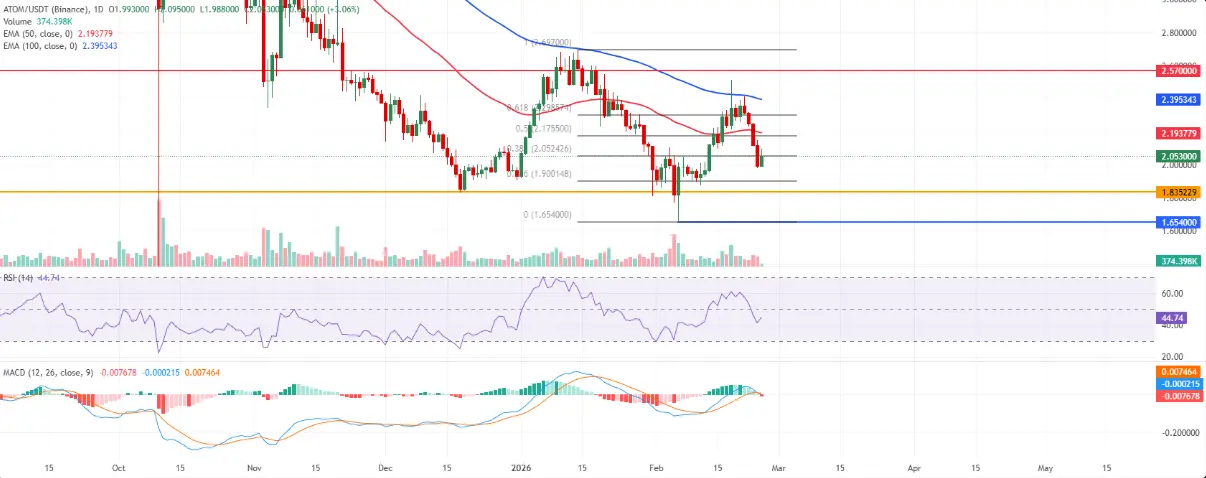 Daily ATOM/USDT chart | Source: TradingView
From a technical perspective, immediate support aligns with the 38.2% Fibonacci retracement level of the rally from $1.65 to $2.70 at $2.05 — the area where the price is currently trying to hold. Below that, a more significant support zone is at the previous horizontal bottom around $1.83.
Daily ATOM/USDT chart | Source: TradingView
From a technical perspective, immediate support aligns with the 38.2% Fibonacci retracement level of the rally from $1.65 to $2.70 at $2.05 — the area where the price is currently trying to hold. Below that, a more significant support zone is at the previous horizontal bottom around $1.83.
If ATOM maintains stability above $2.05, there is room for a corrective rebound, with initial resistance at the 50% Fibonacci level near $2.17, followed by 61.8% at $2.29. Further resistance is at the key horizontal level of $2.57, which protects the upper boundary of the current trading range.
Conversely, in a more negative scenario, a daily close below $2.05 could trigger selling pressure, pushing the price back to test the 23.6% Fibonacci level at $1.90; at that point, focus will likely shift to the lower support zone around $1.83.