Dogwifhat (WIF) to Bounce Back? This Potential Bullish Fractal Setup Suggests So!

Key Takeaways
-
Dogwifhat (WIF) is down nearly 46% in the last 90 days and remains 96% below its all-time high of $4.64.
-
A bullish fractal comparison with Cardano’s 2018–2020 structure suggests WIF may be nearing a macro bottom.
-
The $0.15–$0.20 zone is acting as a key higher-timeframe support region.
-
A breakout above $0.30 could confirm early reversal momentum.
-
A breakdown below current support would invalidate the bullish fractal thesis.
The broader cryptocurrency market has been locked in a deep downtrend over the past couple of months. Bitcoin and Ethereum have dropped roughly 30% and 38% respectively in the last 90 days. Memecoins have been hit even harder, with WIF sliding nearly 50% during the same period — and still trading around 96% below its all-time high of $4.64, according to CoinMarketCap.
However, beneath the surface of this correction, a larger fractal setup is beginning to attract attention — and it suggests that WIF may be approaching a key reversal point.
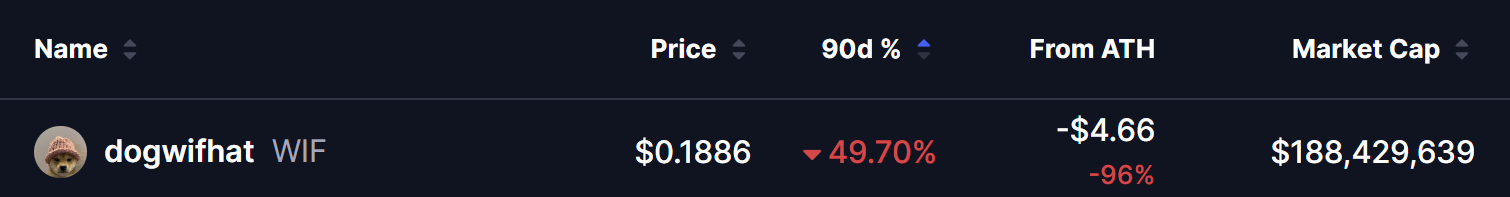
Source: Coinmarketcap
WIF Mirrors Cardano’s Historical Structure
According to the latest analysis shared by crypto analyst Quantum Ascend, Dogwifhat’s current structure closely resembles the historical price behavior of Cardano (ADA) between 2018 and 2020.
Back in 2018, ADA topped out and entered a prolonged corrective phase. The decline unfolded in a clear five-wave structure, gradually grinding lower while forming lower highs and lower lows. Sentiment turned extremely bearish, and many assumed the project had lost its momentum for good.
After completing that five-wave correction, ADA formed a rounded bottom near a major horizontal support zone. What followed was a powerful impulsive breakout that launched ADA into a multi-month rally heading into 2020–2021.
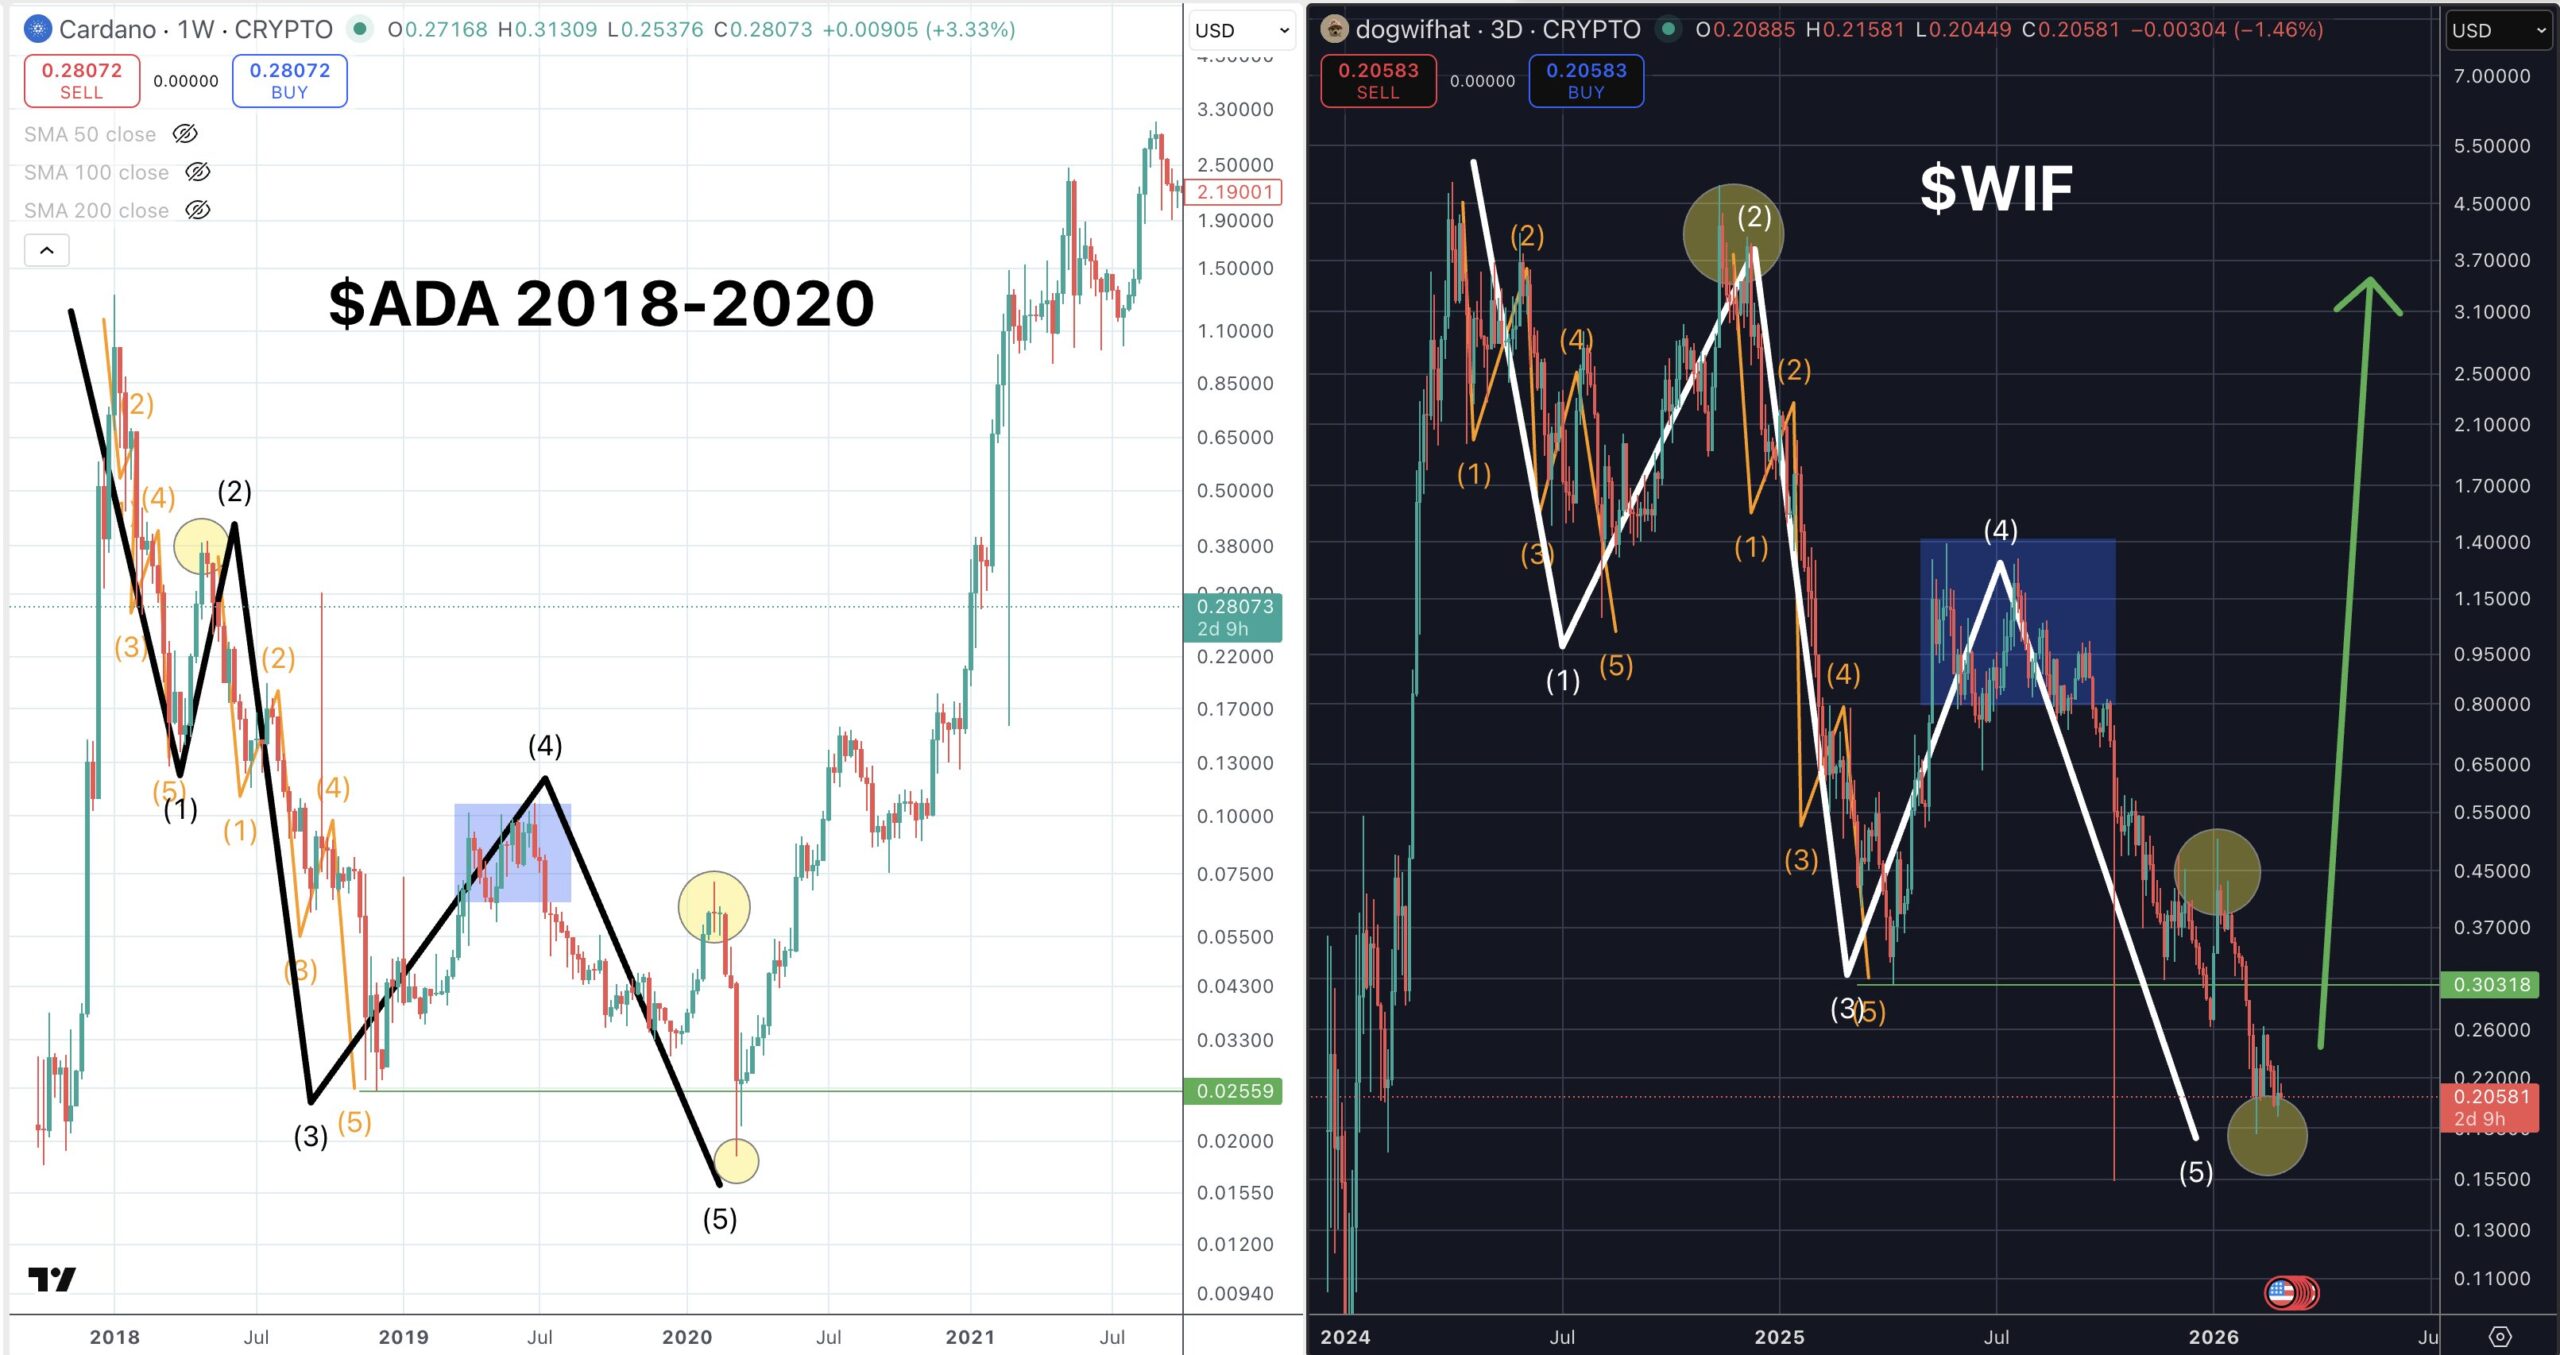
ADA and WIF Fractal Chart/Credits: @quantum_ascend (X)
Now, WIF appears to be following a similar roadmap.
On the 3-day chart, WIF has printed a comparable five-wave corrective structure from its $4.64 peak. Price action has been compressing toward a key horizontal support zone near the $0.15–$0.20 region — an area highlighted on the chart as a potential macro demand zone.
If the fractal comparison holds, WIF could be approaching the final stages of its corrective cycle.
What’s Next for WIF?
If this fractal continues to play out, WIF could form a macro bottom near its current support region.
The first sign of strength would likely be:
-
A strong bullish reversal candle on the higher timeframe
-
A shift from lower highs to higher highs on the daily chart
-
Increasing volume on upside moves
Should momentum return, the next major reclaim level sits around the $0.30 region — a prior breakdown zone that now acts as resistance. A confirmed breakout above that level could open the door toward a broader recovery phase.
In a more aggressive bullish scenario — similar to ADA’s historical rebound — WIF could eventually attempt a larger trend reversal, potentially targeting significantly higher levels over the long term.
Key Risk: Fractals Offer Perspective — Not Certainty
It’s important to remember that fractals are comparative tools, not guarantees.
Market structure, liquidity conditions, and overall risk appetite differ across cycles. ADA’s recovery occurred during the early stages of a broader crypto bull market. WIF’s trajectory will heavily depend on Bitcoin’s stability and whether the broader memecoin sector regains momentum.
A decisive breakdown below the highlighted support zone would invalidate the fractal thesis and could extend the corrective phase further.
For now, though, WIF’s structure suggests that downside momentum may be nearing exhaustion — and if history rhymes, a recovery phase could slowly begin to take shape in the months ahead.
Disclaimer: The views and analysis presented in this article are for informational purposes only and reflect the author’s perspective, not financial advice. Technical patterns and indicators discussed are subject to market volatility and may or may not yield the anticipated results. Investors are advised to exercise caution, conduct independent research, and make decisions aligned with their individual risk tolerance.
About Author: Nilesh Hembade is the Founder and Lead Author of Coinsprobe, with over 5 years of experience in the cryptocurrency and blockchain industry. Since launching Coinsprobe in 2023, he has been providing daily, research-driven insights through in-depth market analysis, on-chain data, and technical research.