Memecoin: Dogecoin, Shiba Inu, and Pepe show bearish signals at key levels
As the week begins, meme coins are struggling to fluctuate around key support levels after a prolonged week of decline. Dogecoin (DOGE) currently shows a short-term trend that is quite neutral, although the balance still leans slightly toward the negative. Meanwhile, investors holding Shiba Inu (SHIB) and Pepe (PEPE) should be especially cautious, as technical indicators suggest that downward momentum is gradually gaining dominance. Notably, the overall market sentiment remains risk-off, as escalating military tensions in the Middle East over the weekend continue to exert heavy pressure on the cryptocurrency market.
Dogecoin Shows Slight Downtrend
Dogecoin is hovering around $0.093 at the time of writing on Monday. In the short term, the price trend remains neutral but shows signs of weakening, as DOGE continues to trade significantly below the 50-day and 100-day exponential moving averages (EMA), which are converging in the $0.108–$0.125 range. This indicates that the main downtrend has not yet been broken. Notably, the price remains suppressed below the descending trendline from the peak of $0.218, reflecting ongoing selling pressure above, despite recent technical rebounds from below $0.091.
Regarding momentum, the recovery signals are quite cautious. The daily RSI has exited the oversold zone but is only oscillating around 40—indicating that buying strength is not yet sufficient to confirm a reliable reversal. At the same time, the MACD line has only slightly crossed above the signal line and remains near zero, implying that the current upward movement is mainly a correction within the downtrend rather than the start of a new bullish cycle.
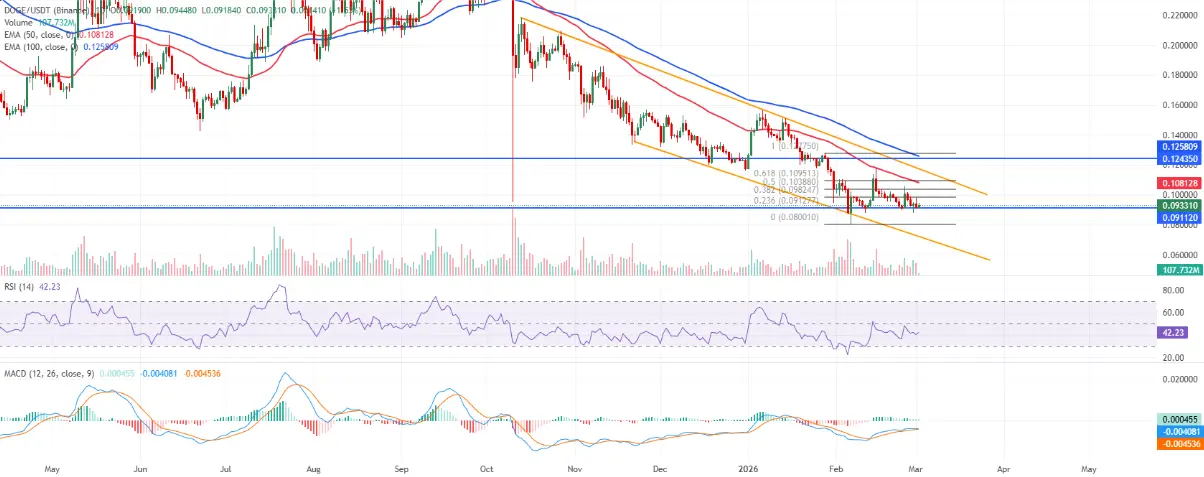 Daily DOGE/USDT chart | Source: TradingView
On the support side, the $0.091 level is critical, coinciding with a significant horizontal support and just above the 23.6% Fibonacci retracement at $0.091 (measured from the low of $0.080 to the high of $0.127). This is considered an important price base for the current accumulation phase. If the daily candle closes below this zone, the risk of DOGE weakening further toward lower Fibonacci levels is quite high, with the $0.080 bottom once again becoming a key focus.
Conversely, initial resistance appears around the 38.2% Fibonacci level at $0.098, followed by a more significant resistance zone at the 50% level near $0.103—where the downward-sloping moving averages could increase selling pressure. Only a decisive breakout and sustained hold above $0.103 would activate a scenario of extending the rebound toward the 61.8% Fibonacci level at $0.109. However, as long as DOGE remains below the horizontal resistance at $0.124 and the long-term downtrend line, any recovery is likely to face selling pressure again.
Shiba Inu Bears Target February 6th Low
The price of Shiba Inu (SHIB) has repeatedly failed to break through the weekly resistance zone around $0.0000068 in mid-February, before plunging over 22% in the following two weeks. By Monday, SHIB is trading around $0.0000056, indicating that selling pressure still dominates.
In a continued downtrend scenario, SHIB’s correction could extend toward the February 6th low of $0.0000050.
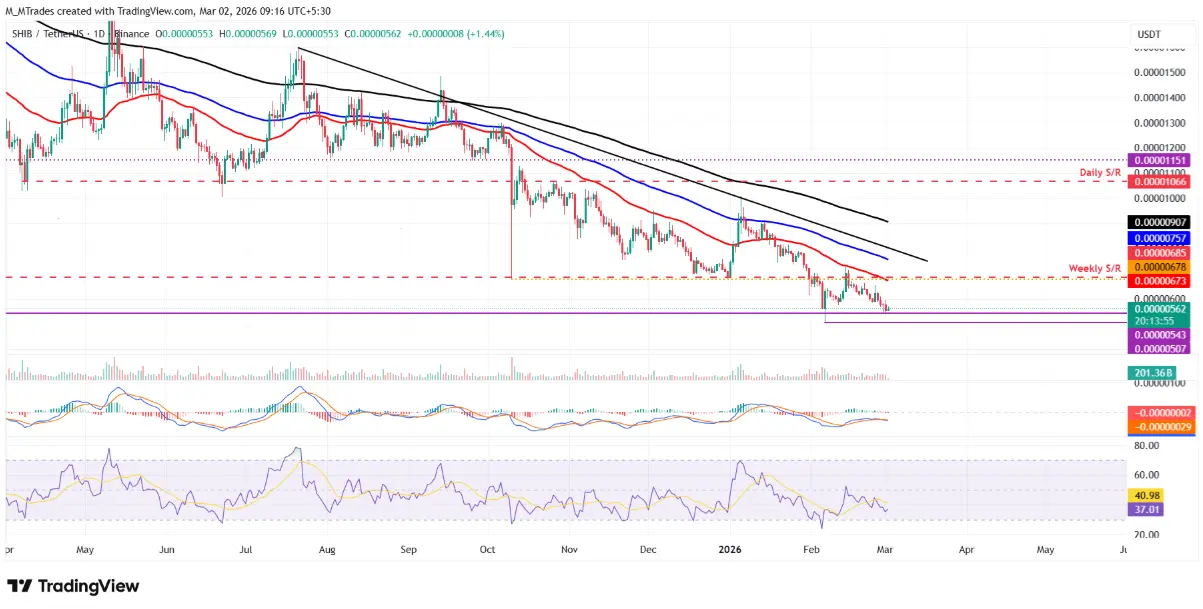 Daily SHIB/USDT chart | Source: TradingView
Technical indicators are also signaling a negative outlook. The daily RSI is at 37, below the neutral 50 threshold, reflecting increasing bearish momentum. Additionally, the MACD has crossed downward since Saturday, further reinforcing the short-term negative outlook.
However, if buying interest returns and SHIB manages a successful rebound, the price could potentially extend its upward move to retest the weekly resistance zone around $0.0000067.
Pepe Momentum Indicators Signal Downtrend
PEPE’s price failed to break above the 50-day EMA at $0.0000043 on Wednesday, triggering strong selling pressure that caused the coin to drop over 17% by Sunday. Currently, PEPE is fluctuating around $0.0000034.
If the correction continues, PEPE’s price is likely to retreat further to test the February 6th low of $0.0000031.
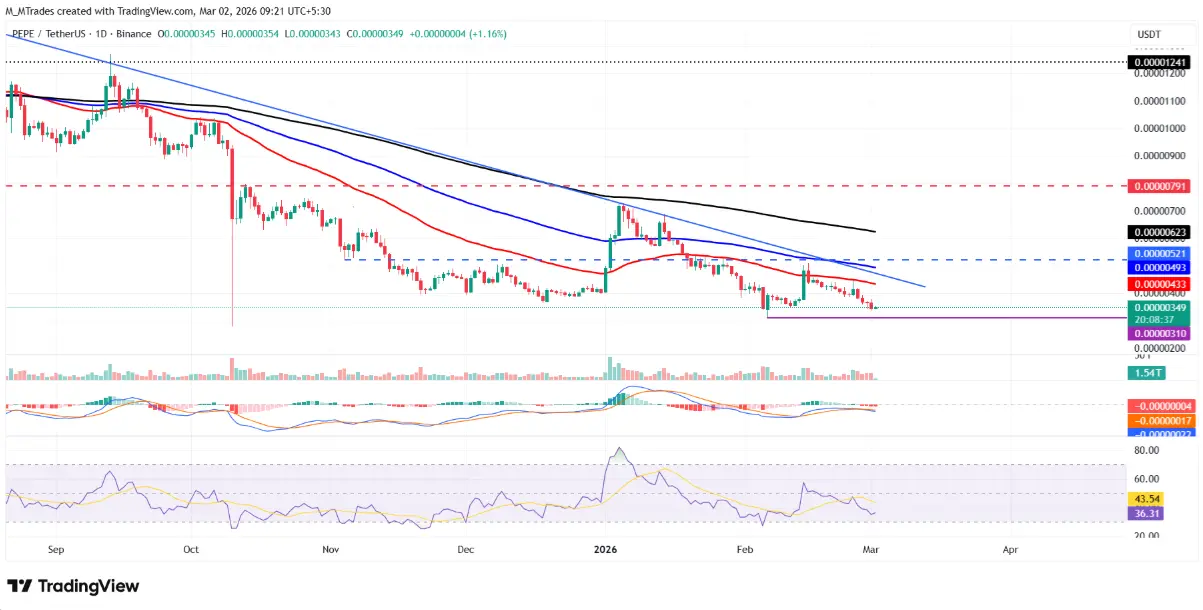 Daily PEPE/USDT chart | Source: TradingView
Notably, similar to Shiba Inu, key momentum indicators for PEPE such as RSI and MACD are also leaning toward a bearish trend, reinforcing the short-term weakening scenario.
On the other hand, if buying interest returns and helps PEPE recover, the price could attempt to re-establish an upward trend to challenge the 50-day EMA near $0.0000043.
Related Articles
Dogecoin (DOGE) to Bounce Back? This Key Emerging Fractal Chart Suggests So
Bitcoin Price News: BTC Downside Risk Grows While Pepeto Presale Hits $7.42M and Dogecoin and Solana Remain Shaky
$0 in Dogecoin ETF Daily Net Inflow: Cause for Concern? - U.Today