From 2026 to date, six technology companies—Amazon, Alphabet, Nvidia, Meta, Oracle, and SpaceX—have issued a record $182 billion in investment-grade bonds, up 1,300% from about $13 billion in the same period of 2025. These six firms account for nearly 15% of the total U.S. corporate bond issuance volume this year to date and contribute more than 50% of the increase in corporate bond issuance this year. In the same period, there were seven bond trades in the U.S. market with deal sizes of $25 billion or more; the number is comparable to the total number of such trades from 2019 to 2025—six of which involved the companies above, and the remaining one was from Salesforce.

This abnormal signal from the bond market points to a structural change that is already underway: the capital needs of AI infrastructure are fundamentally reshaping corporate financing behavior. In a July 2026 report, Deutsche Bank noted that the capital expenditure scale of hyperscale cloud computing companies has exceeded their operating cash flow, meaning these companies are using external financing or existing assets to support the expansion of AI infrastructure. In the first quarter of 2026, the four largest cloud providers again raised their full-year capital expenditure guidance, totaling $700 billion. Morgan Stanley further raised its capital expenditure forecasts for Amazon, Alphabet, Meta, Microsoft, and Oracle at the end of April. After the update, the five companies’ 2026 capital expenditures are expected to reach $805 billion, rising further to $1.116 trillion in 2027.
In this debt-driven capital expenditure supercycle, the benefits across different parts of the industry chain vary significantly. This article breaks down Nvidia, Amazon, Alphabet, Meta, and Oracle’s AI positioning and investment logic across four dimensions: chip supply, cloud computing platforms, AI ecosystem integration, and the application layer.
Nvidia: a direct reflection of compute scarcity
$NVDANvidia sits at the top of the AI capital expenditure chain. For every dollar invested in data center infrastructure, a substantial portion is directly converted into Nvidia’s GPU orders. This position makes its performance more sensitive to capital expenditure fluctuations than any other link in the industry chain.
On May 20, 2026, Nvidia released its first-quarter fiscal year 2027 results: revenue was $81.615 billion, up 85% year over year and up 20% quarter over quarter; GAAP net profit was $58.321 billion, up 211% year over year. Data center revenue reached $75.2 billion, accounting for 92% of total revenue, continuing to set a new quarterly record. This data validates a key logic: before the demand for compute power in AI training and inference peaks, Nvidia’s growth in performance is highly synchronized with the capital expenditure curve of hyperscale enterprises.
As of July 10, 2026, Beijing time, Nvidia’s closing price was $202.78, with a market capitalization of about $4.73 trillion and a P/E ratio of 31.05. Analysts’ average target price is $309.16. Market optimism about Nvidia is based on two assumptions: first, demand for AI chips is still expanding; second, Nvidia’s competitive barriers in the GPU market are deep enough.
But risks also come from the demand side. JPMorgan estimates that in 2026, the total global shipments of AI chips will be about 16.3 million units, including 6.8 million ASIC chips and 9.5 million general-purpose GPU units. The rise in ASIC share implies that cloud computing giants are exploring ways to bypass general-purpose GPUs—though GPUs still account for 58% of the market in the short term, once the substitution trend accelerates, it will create structural pressure on Nvidia’s market share. Additionally, Nvidia’s Beta is 2.21, significantly higher than peers, indicating its stock price has greater downside elasticity when the capital expenditure cycle turns.
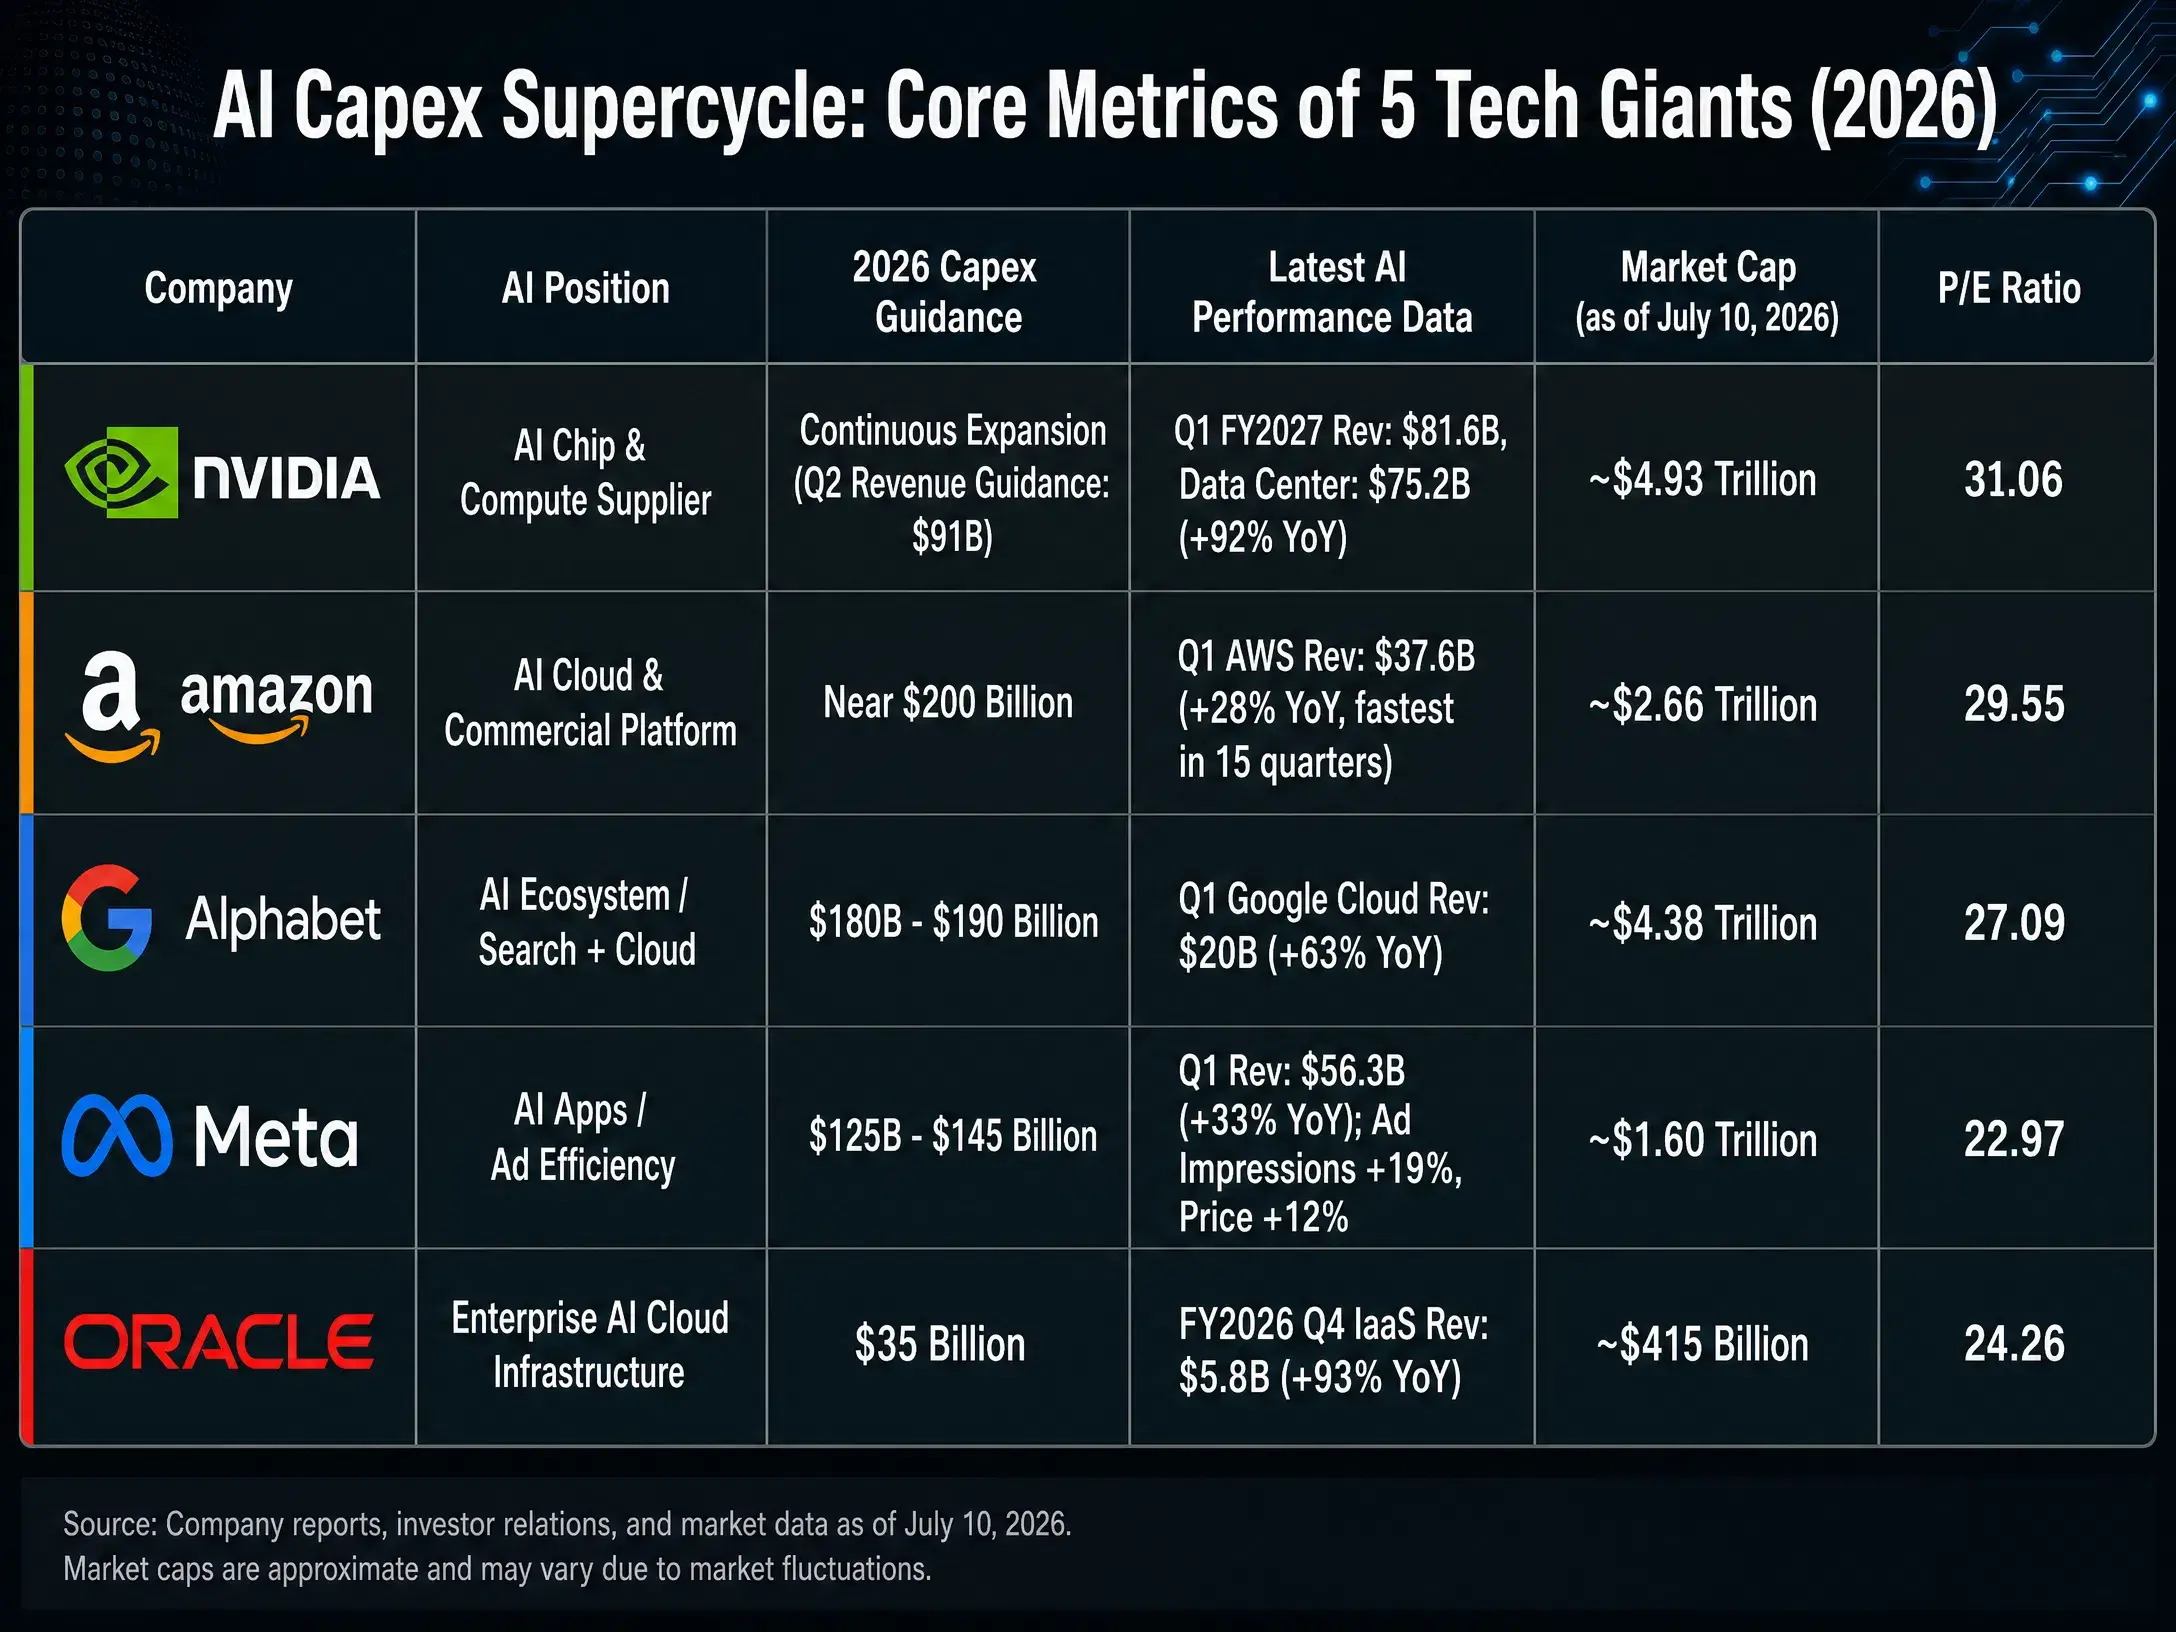
AI capital expenditure supercycle—core metrics comparison of five tech companies (2026)
Amazon: validation of its cloud business commercialization capability
Amazon’s AI story is not about chips—it’s about commercialization platforms. AWS, the world’s largest public cloud service provider, is the biggest channel for leasing AI compute power and deploying models. The significance of AI capital expenditures for Amazon is twofold: they are both a cost item (building data centers and purchasing chips) and a revenue item (renting computing resources to enterprise customers through AWS).
In the first quarter of 2026, Amazon’s total net sales were $181.5 billion, up 17%; net profit was $30.255 billion, up 77%. AWS segment revenue reached $37.6 billion, up 28%, the fastest growth rate in 15 quarters. AWS operating profit was $14.2 billion. Operating profit margin was 13.1%, the highest in history.
As of July 10, 2026, Beijing time, Amazon’s closing price was $247.04, with a market capitalization of about $2.68 trillion and a P/E ratio of 29.52. Analysts’ average target price is $318.82.
Amazon’s core investment logic is AWS’s monetization efficiency. Unlike pure chip suppliers, Amazon’s AI investments can generate steady recurring revenue through cloud service pricing mechanisms. For the second quarter of 2026, the company expects net sales of $194 billion to $199 billion, up 16% to 19%. But what warrants attention is that AI infrastructure capital expenditures are compressing free cash flow—whether AWS’s revenue growth can continue to cover the pace of capital expenditure expansion is the key metric for assessing its investment efficiency.
Alphabet: AI ecosystem integration above the search moat
Alphabet’s AI strategy spans the entire chain from chips (TPU) to models (Gemini) to applications (Search, YouTube, Cloud). This vertical integration provides it with the most monetization touchpoints along the AI commercialization path, but it also entails the largest scale of capital expenditures and the heaviest depreciation pressure.
In the first quarter of 2026, Alphabet raised its full-year capital expenditure guidance to $180 billion to $190 billion, nearly doubling versus 2025. As of July 10, 2026, Beijing time, Alphabet (GOOGL) closed at about $358.89, with a market capitalization of about $4.41 trillion. The P/E ratio is approximately 27.38.
Alphabet’s investment logic is built on the search business’s ability to generate cash flow. The “cash cow” nature of search ads provides resilience relative to peers in the face of large-scale capital expenditures. However, the potential impact of AI on the search business is a specific risk—if generative AI changes how users discover information, the business model of search ads may need to be restructured. Google Cloud’s growth rate is another factor to monitor: although the Cloud business is expanding, its scale still lags behind AWS and Azure, leaving uncertainty about its competitive position in the AI cloud services market.
In the first half of 2026, large-cap tech stocks showed clear divergence: Alphabet rose about 14%, while Microsoft fell 20% and Oracle declined 27%. To some extent, this divergence reflects how the market prices the different AI capital expenditure efficiencies of each company.
Meta: the AI application-layer logic driven by ad efficiency
Meta’s AI investment logic is the most direct—improving ad delivery efficiency. AI recommendation algorithms, generative ad creatives, and automated bidding tools, among other application-level tools, directly impact Meta’s core revenue source. The clarity of this “investment-to-return” chain is higher than in the cloud computing or chip space.
In the first quarter of 2026, Meta’s revenue was $56.31 billion, up 33% year over year. Ad impressions increased 19%, and the price per ad rose 12% in parallel. GAAP earnings per share were $10.44. The company expects 2026 capital expenditures of up to $145 billion, about twice its 2025 budget.
As of July 10, 2026, Beijing time, Meta’s closing price was about $631.48, with a market capitalization of about $1.64 trillion and a P/E ratio of 22.95. Analysts’ average target price is $824.86.
Meta’s valuation is the lowest among the five companies (P/E of about 23x), reflecting the market’s cautious view of the continued losses at Reality Labs and the AI investment’s return profile. The annualized revenue from AI bidding stack value-optimization suites has already exceeded $20 billion, proving that monetization paths for AI in advertising are already effective. But the core issue is this: capital expenditures jumped from about $70 billion in 2025 to $125–$145 billion in 2026—can the revenue growth rate keep pace accordingly?
Oracle: the follower of enterprise-grade AI cloud infrastructure
In the AI cloud infrastructure space, Oracle’s positioning differs from AWS and Azure—it emphasizes integrating enterprise databases with AI compute power, as well as differentiated positioning in multi-cloud architectures. This strategy provides a unique growth trajectory during the AI capital expenditure cycle.
Oracle’s fiscal Q1 results for fiscal year 2026, announced in September 2025, showed total revenue of $14.9 billion, up 12%. Cloud infrastructure (IaaS) revenue was $3.3 billion, up 55%. The company expects full-year cloud infrastructure revenue to grow 77% to $18 billion. Over the next four years, revenues are projected to reach $32 billion, $73 billion, $114 billion, and $144 billion respectively. Remaining performance obligations (RPO) reached $455 billion.
As of July 10, 2026, Beijing time, Oracle’s closing price was about $144.22, with a market capitalization of about $418.7 billion. The P/E ratio is approximately 23.46. Analysts’ average target price is $251.85.
Oracle’s investment logic is based on increasing AI compute demand from enterprise clients. The high growth rate in its cloud infrastructure (55%) and the sharp rise in RPO indicate that enterprise customers are migrating AI workloads to Oracle’s cloud platform. However, with a market cap of only about $415 billion, its scale is significantly smaller than the other four companies, so liquidity premium and risk resilience are factors to consider. In the first half of 2026, Oracle’s stock price fell 27%, the weakest among the five, reflecting market concerns about its capital expenditure efficiency.
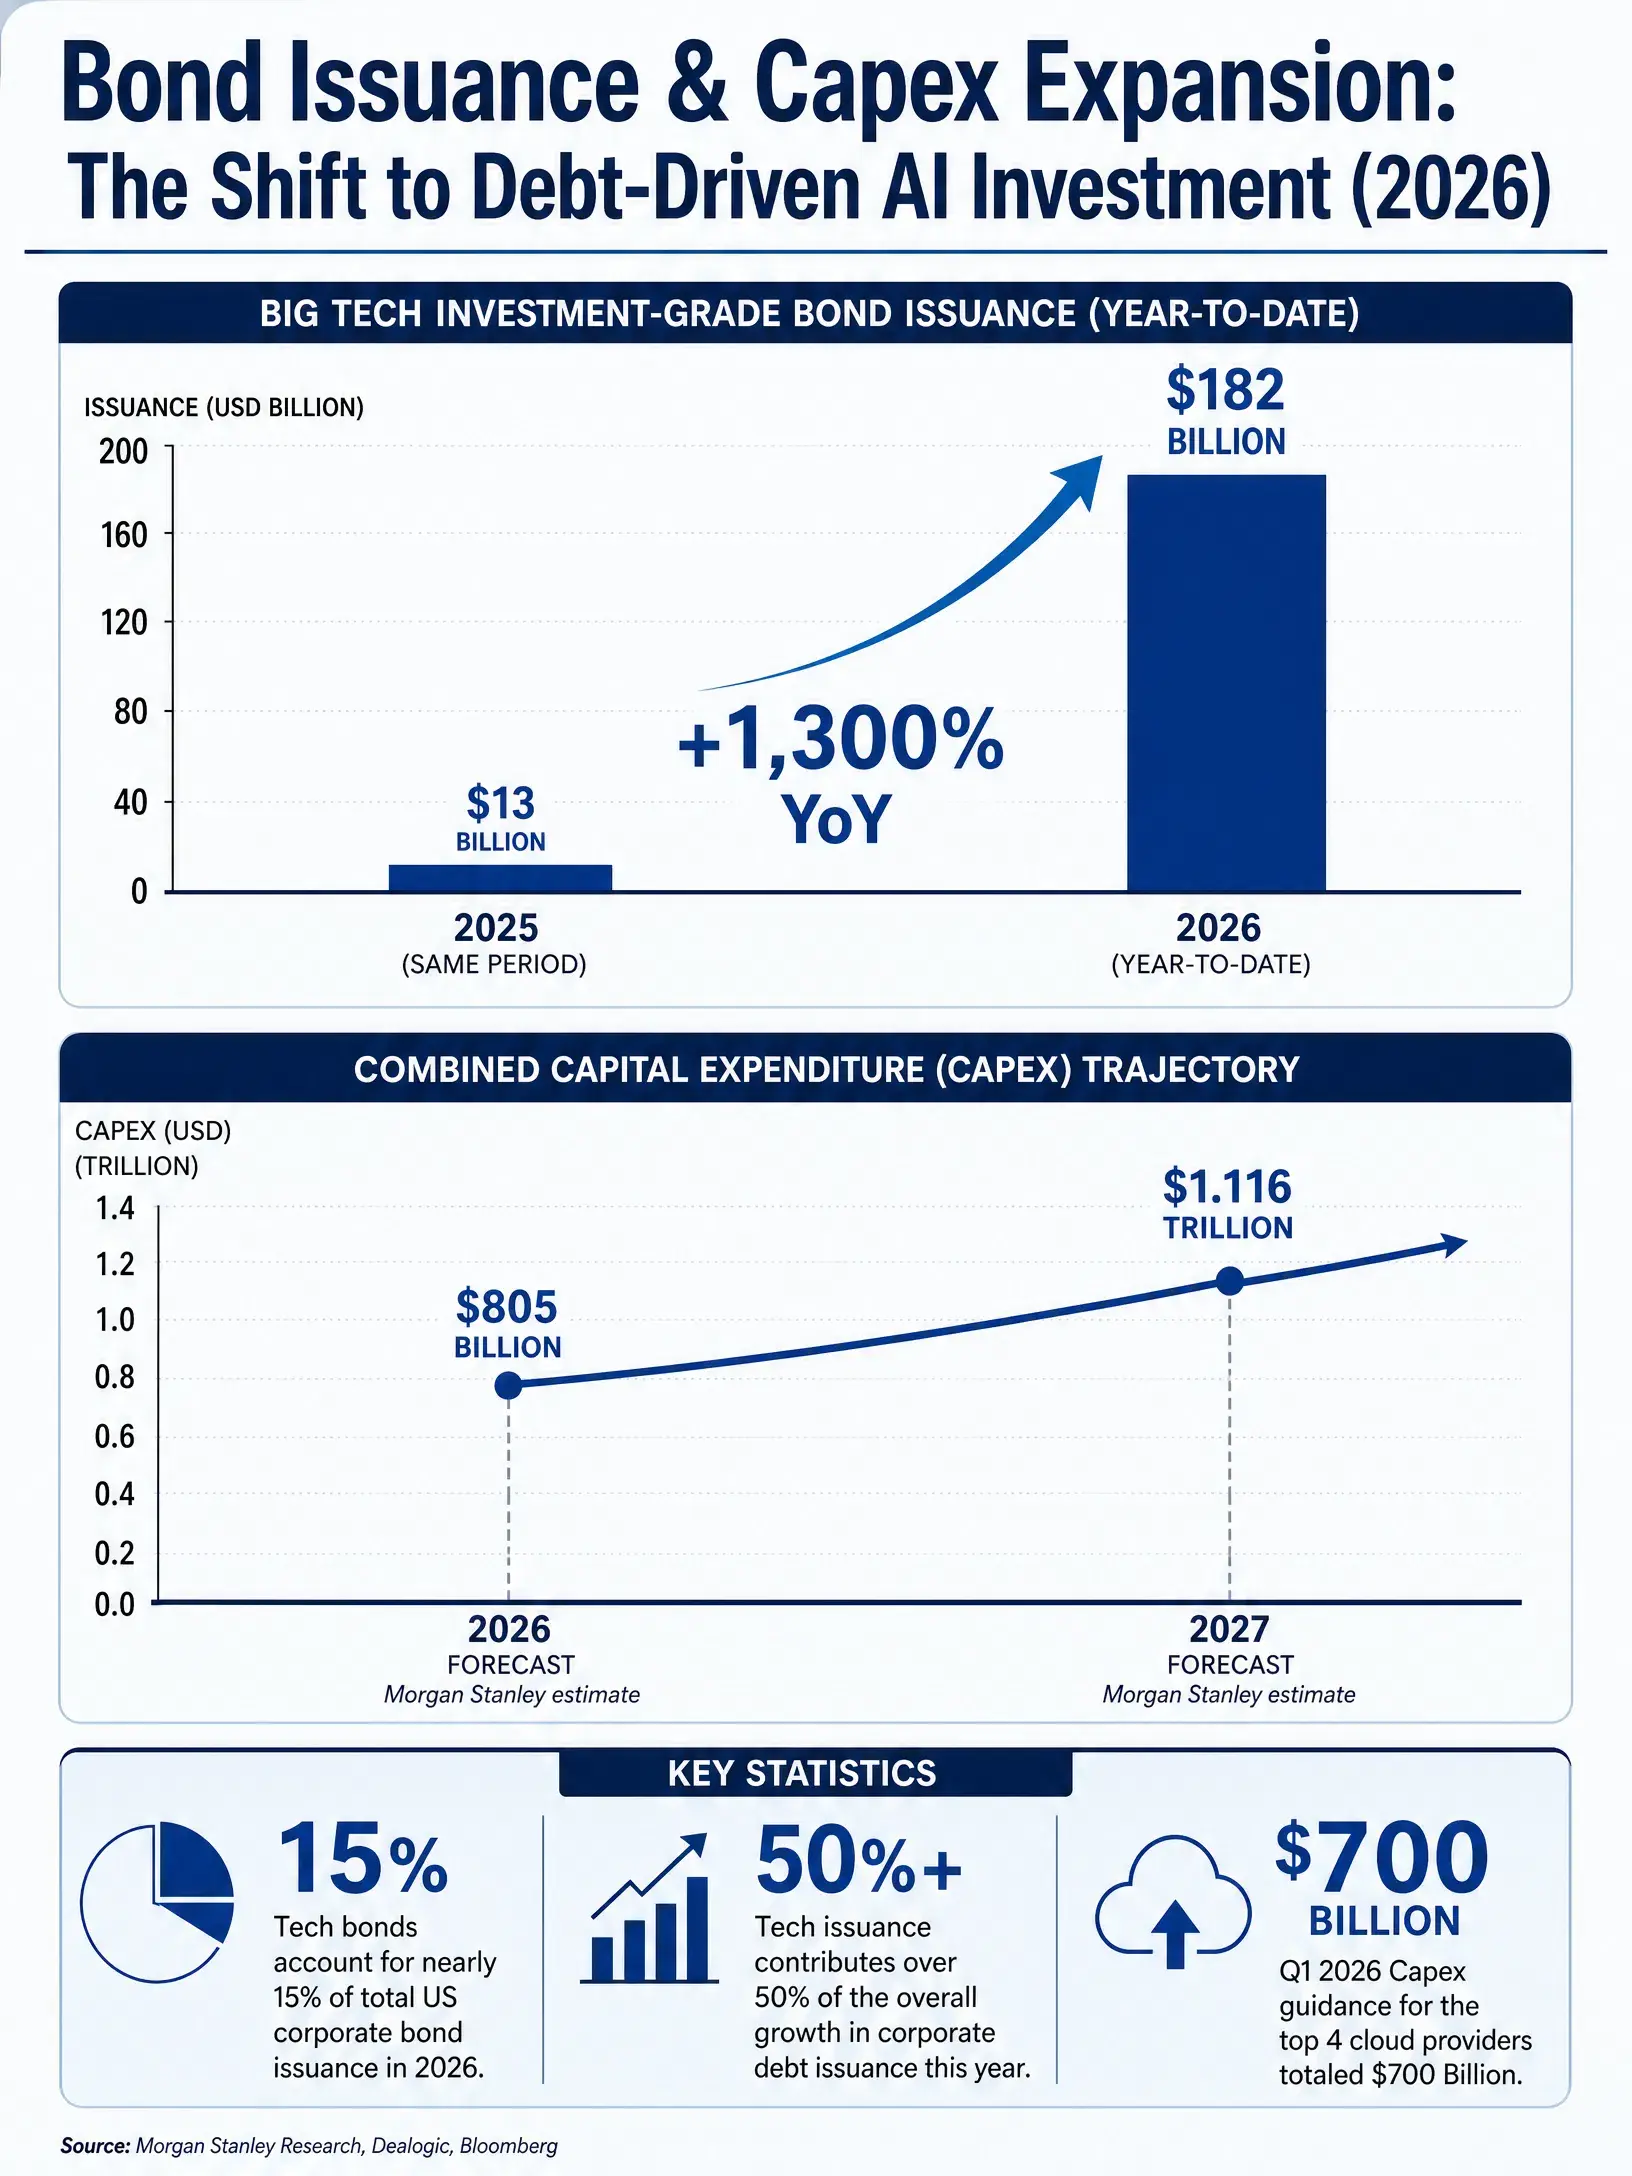
Bond issuance scale and capital expenditure expansion trend among six tech companies in 2026
Conclusion
The AI capital expenditure supercycle is reshaping the competitive landscape in the tech industry on two levels.
At the industry-chain level, the benefits differ sharply across links. Nvidia, as a chip supplier, is the most direct beneficiary of capital expenditures, but the ASIC substitution trend poses structural risks over the medium to long term. Amazon and Alphabet, as cloud service providers, serve dual roles—both bearing capital expenditures and benefiting from them—the key is whether their cloud revenue growth can keep pace with infrastructure spending expansion. Meta’s application-layer logic offers the clearest, shortest path to returns through improved ad efficiency, but the jump in capital expenditures puts pressure on profit margins. As a follower in enterprise-grade cloud infrastructure, Oracle’s growth is notable, but its scale and risk resilience still need to be tested.
On a macro level, a deeper question emerges: the AI industry needs to generate about $3 trillion in revenue to match the investment in chips and data centers—this figure may even be understated, as rising memory costs and increased use of specialized inference chips raise the revenue required per unit of capital expenditure. When the pace of capital expenditure expansion exceeds the growth of operating cash flow, the sustainability of debt financing will be challenged.
AI investment is shifting from “buying the future narrative” to “validating investment returns.” The market’s pricing logic for AI-related companies is moving from focusing on capital expenditure scale to emphasizing capital expenditure efficiency.
FAQ
Q1: What is the core impact of the AI capital expenditure supercycle on tech stocks?
AI capital expenditures are driving tech companies to raise financing through large-scale bond issuance. In 2026, the six tech companies have issued $182 billion in investment-grade bonds. Capital expenditure expansion directly boosts upstream demand such as chips and cloud infrastructure but also pressures free cash flow. The market’s pricing logic is shifting from “capital expenditure scale” to “capital expenditure efficiency,” with investors focusing more on ROI rather than just investment size.
Q2: What is Nvidia’s special position in the AI industry chain?
Nvidia is at the very top of AI capital expenditures, with every dollar invested in data centers translating directly into GPU orders. In fiscal Q1 2026, data center revenue was $75.2 billion, representing 92% of total revenue. However, the share of ASIC chip shipments has already risen to 42%, which could create medium- to long-term pressure on the general-purpose GPU market share.
Q3: How do the AI investment strategies of Amazon and Alphabet differ?
Amazon’s AI returns mainly come from AWS’s leasing of compute power to generate recurring revenue. In Q1 2026, AWS revenue was $37.6 billion, up 28%. Alphabet, on the other hand, monetizes across the entire chain—from Search and YouTube to Cloud—with a larger capital expenditure scale ($180–$190 billion), and benefits from the “cash cow” nature of search ads, providing stronger resilience under pressure.
Q4: Why is Meta’s AI investment considered to have the clearest return path?
Meta’s AI investments directly enhance ad delivery efficiency—AI recommendation algorithms, automated bidding, and generative ad creatives lead to measurable increases in ad impressions and prices. In Q1 2026, ad impressions rose 19%, and the price per ad increased 12%. The annualized revenue from AI-driven ad optimization suites has already exceeded $20 billion, demonstrating effective monetization.
Q5: What is Oracle’s position in the AI cloud market?
Oracle emphasizes integrating enterprise databases with AI compute power and has a differentiated approach in multi-cloud architectures. In fiscal Q1 2026, cloud infrastructure revenue grew 55% year over year to $3.3 billion, with full-year projections reaching $18 billion. However, with a market cap of about $415 billion, its scale is much smaller than AWS and Azure, which affects liquidity and risk resilience.


