Author: CryptoSlate
Translation: Deep潮 TechFlow
Introduction: This article explains an important market mechanism: before macro data is released, the Bitcoin derivatives market has already clearly signaled risk through three dimensions—funding rates, open interest, and liquidations. Understanding this logic allows you to see the market’s true pressure earlier than any narrative.
Full Text:
The Bitcoin derivatives market provides the best explanation for this week’s macro pressure.
Funding rates sharply turn negative, open interest remains high, and then the U.S. employment report is released. These three events together indicate that the market has already heavily positioned for downside hedging before the actual macro catalyst arrives.
Understanding this sequence is important because it explains how macro volatility enters the crypto market.
It usually appears first in perpetual contracts—the fastest to hedge, with the highest leverage usage.
Funding rates tell you which side is paying to maintain their position; open interest shows how much position remains in the system; liquidation data indicates when these positions start to break down.
On February 28, Bitcoin perpetual contracts’ funding rate dropped to about -6%, one of the most negative readings in nearly three months. Open interest denominated in BTC increased from about 113,380 BTC at the start of the year to 120,260 BTC.
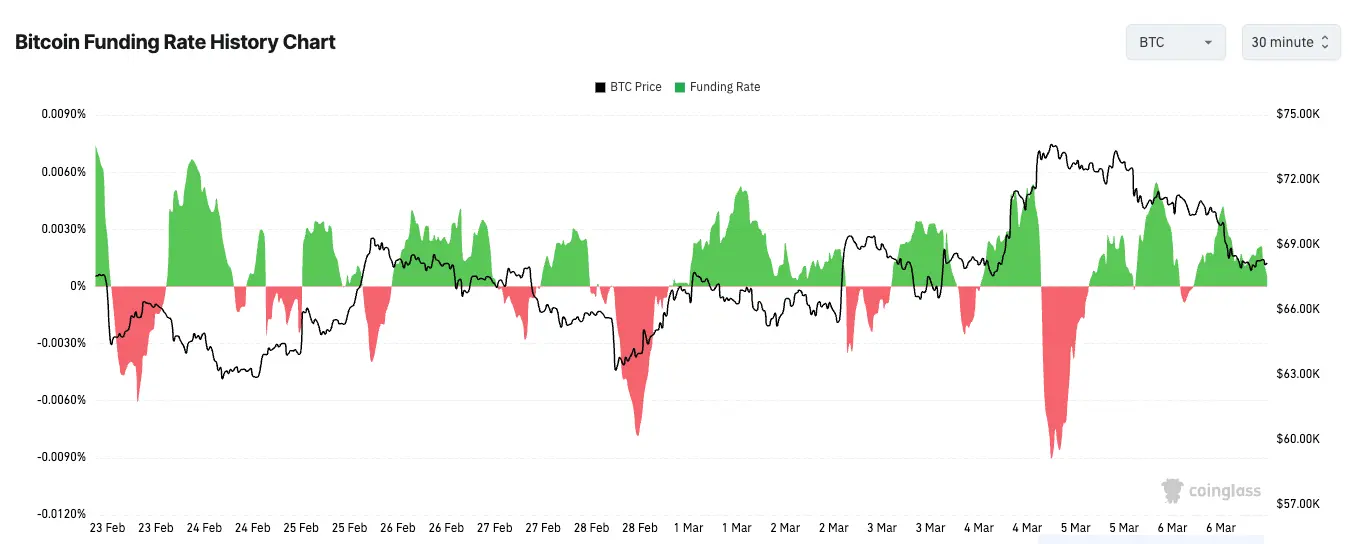
This combination is significant because it points to two things simultaneously: traders are heavily betting on downside, and they are doing so with increased leverage entering the market. The market is both very tense and very crowded.
This is the simplest way to understand how macro pressure enters the crypto market.
It appears in the derivatives ledger, not as a carefully packaged narrative or a neat economist’s report. Traders act there first because perpetual contracts offer good liquidity, low costs, and are always available.
When they are worried about growth, interest rates, or broader risk sentiment, they short perpetual contracts; these contracts fall below spot prices, and funding rates turn negative because shorts must pay longs to maintain their positions.
Why Negative Funding Rates Persist
But negative funding rates themselves are not a bottom signal; they only indicate the market’s directional tilt.
This distinction is important because traders tend to turn every extreme reading into a prediction.
Extremely negative funding rates can signal short covering; last week’s pattern clearly created this possibility. But when hedging demand is genuine, it can also persist longer than expected.
Extreme spikes and drops in funding rates reflect one-sided positions that can endure in strong directional markets.
This persistence usually comes from two sources.
Some traders hedge real spot exposure, meaning they’re not precisely predicting the next move but protecting their portfolios. Others are simple trend followers, willing to pay funding as long as the market continues moving in their favor. Both can keep funding rates negative even after initial panic subsides.
That’s why the real signal isn’t whether funding rates are negative. A more interesting pattern occurs when funding rates stay significantly negative while prices no longer make new lows. At that point, pressure begins to accumulate beneath the surface. Shorts are still paying to hold positions, but the market no longer rewards them in the same way. This is how short covering conditions form.
Employment Reports Bring Genuine Macro Input
This week’s macro catalyst comes from the U.S. labor market. On March 6, the Bureau of Labor Statistics reported a decrease of 92,000 non-farm jobs in February, with an unemployment rate of 4.4%.
Such reports often trigger broad re-pricing because they influence multiple market themes simultaneously. A softer labor market could lower yields if traders believe the Fed might adopt a more dovish path. It could also dampen risk appetite if traders interpret the data as a sign of genuine economic slowdown.
Crypto markets tend to react more intensely to this debate because leverage amplifies macro issues into position events.
If traders are already heavily short, even a brief easing in financial conditions can cause prices to spike sharply due to forced short covering.
If the data deepens risk-off sentiment, the crowded positions can continue to push prices down, as shorts remain confident and longs start to cut losses.
Funding rates serve as pressure gauges, open interest as fuel, and liquidations as the moment when pressure breaks through the system.
Liquidation Data as a Scoreboard
Liquidation data shows whether the market is orderly or passive.
Short liquidations often confirm short covering; long liquidations often confirm a downward washout. When both sides are liquidated in a short period, it indicates volatility has taken over, leaving little room for either side to hold their positions.
That’s why liquidation data is best used as confirmation. Funding rates set the conditions, but liquidations reveal whether those conditions are truly reflected in prices.
Open interest is equally important. If participation shrinks simultaneously, falling prices and negative funding rates don’t tell you much.
It might just mean traders are retreating to watch. But if open interest rises while funding rates are negative, it indicates new positions are being built with a bearish or defensive bias.
Tracking open interest in BTC terms can eliminate some distortions caused by price swings, so rising open interest during a price decline more clearly reflects market participation.
From this perspective, the past week isn’t really about Bitcoin’s strength or weakness, but about where pressure is accumulating.
The derivatives market had already shown a large short or hedging stance before the employment data was released.
The employment report then provided a real macro input for the broader markets to process.
When these two meet, crypto does what it usually does: larger candles, faster reversals, and more intense liquidation events, reflecting the shared macro uncertainty everyone faces.
Funding rates cannot predict price; they only indicate which way leverage is leaning. Open interest cannot tell you who is right; it only shows how much position is on the table. Liquidation data cannot explain the entire market; it only shows when the market becomes uncontrollable.
That’s why derivatives ultimately serve as the best macro explanation this week. Before narratives settle, the ledger has already mapped out the risk clearly. Traders are short, leverage remains in the system, and the employment report gave the market a real reaction target.
Everything that follows is just price discovering how crowded this room really is.