The significance of this CPI report goes far beyond “inflation is declining” itself. It forms a complete market logic chain: easing inflation pressure → reduced room for the Fed to hike rates → falling U.S. Treasury yields → risk-asset valuation repair. By breaking down this transmission mechanism, we analyze the benefiting logic for Tech Stocks and crypto assets in this rebound, and assess the policy outlook under Fed Chair Warsh’s “zero tolerance” stance.
Why Did U.S. CPI Become a Turning-Point Signal for the Market?
The key takeaway from the June CPI data is that it was “broadly below expectations.” In terms of the overall figure, the year-over-year CPI rise fell from 4.2% to 3.5%, a drop of 0.7 percentage points. On a month-over-month basis, the -0.4% decline marked the first negative month since six years ago. The year-over-year core CPI rise narrowed to 2.6%, down 0.3 percentage points from May’s 2.9%.
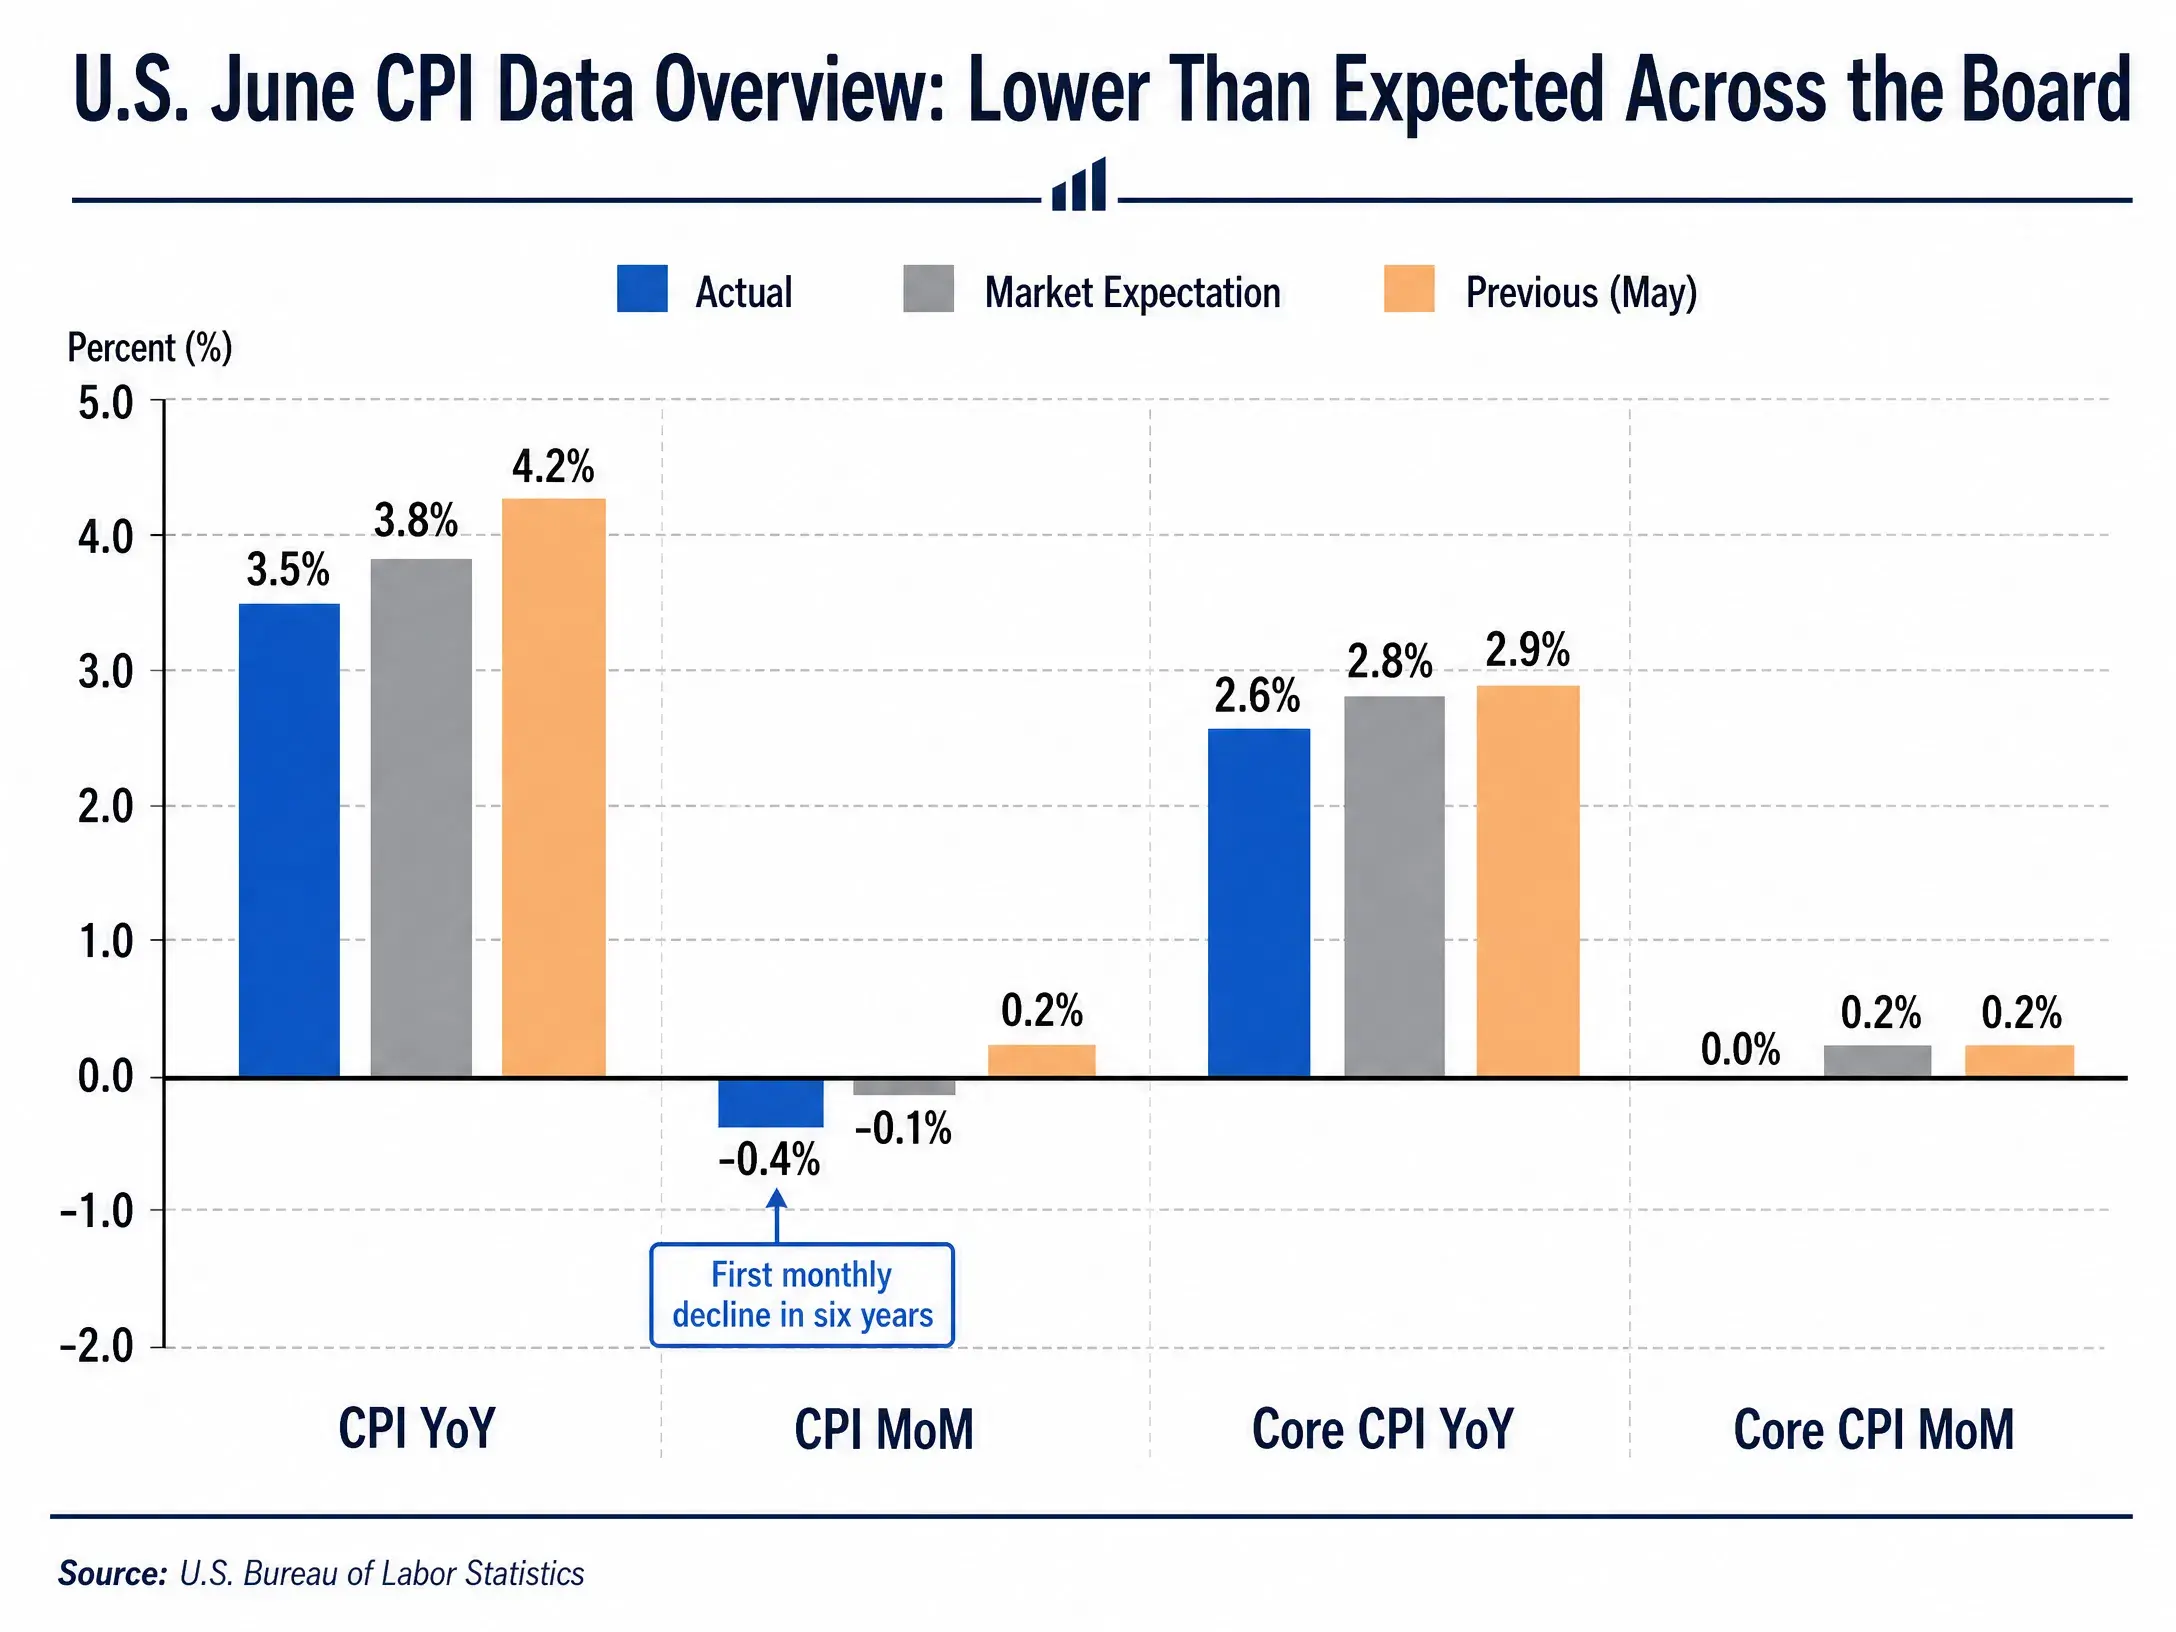
U.S. June CPI Snapshot — Broadly Below Expectations
The main force behind the easing of inflation came from energy prices. In June, U.S. gasoline prices fell 9.7% month over month, while overall energy prices fell 5.7% month over month—its largest single-month drop since April 2020. This sharply contrasted with May, when energy prices had risen and served as the main factor pushing overall inflation higher.
For the market, the signal carried by this data is that inflation is moving toward the Fed’s 2% target. Previously, the market’s concerns about inflation centered on two areas: first, the possibility that a rebound in energy prices could spread further into broader goods and services; second, that wage pressure in the labor market could make inflation more sticky. The June CPI data, to a certain extent, alleviated both concerns.
After the release, financial markets quickly repriced. The yield on U.S. 2-year Treasuries fell by 8 bps, and the yield on the 10-year Treasury fell to 4.524%. The U.S. Dollar Index fell about 0.4% to 100.90. Together, these moves point to one conclusion: market expectations for further tightening by the Fed have cooled markedly.
Why Is the Fed Still Staying Cautious?
Despite the moderate CPI data, Fed Chair Kevin Warsh said explicitly at the House Financial Services Committee hearing the same day that he has “zero tolerance” for persistent high inflation. This stance reflects the complex policy environment the Fed faces.
First, the inflation lesson from 2022 has kept the Fed highly alert to any signs of recurring inflation. Last year, the Fed cut rates, expecting inflation to run only slightly above the 2% target, but inflation actually stayed between 3% and 4%. This misjudgment has made the Fed more cautious in its current decision-making.
Second, wage pressure remains a potential source of inflation. Even though core CPI in June was flat month over month, the labor market’s tight conditions have not fundamentally eased. If wage growth continues to outpace productivity growth, service prices may still face upward pressure.
Third, the risk from energy prices has not been completely eliminated. The drop in inflation in June benefited largely from a sharp fall in energy prices during the Middle East ceasefire. However, geopolitical uncertainty remains. The U.S. military plans to reinstate a maritime blockade of Iranian ports, and tensions between the U.S. and Iran over control of the Strait of Hormuz persist. Any new supply shock could push energy prices back up.
Fourth, the AI investment wave may create a structural upward push on inflation. Large-scale AI capital expenditures are increasing demand for chips, data centers, and related infrastructure, which may translate to price pressure to some extent. Morgan Asset Management previously pointed out that how much AI demand could create structural upward pressure on prices is one of the key variables that central banks need to evaluate.
With these factors in mind, the probability that the Fed will keep rates unchanged at its meeting on July 28–29 has risen to 83.4%, but there is still a gap between “standing pat” and “turning to rate cuts.” China International Financial Company maintained its baseline view that there will be no rate hikes before year-end, but also warned that the hurdle for rate hikes has already been lowered. If one or two hotter inflation prints emerge in the future, it could prompt the Fed to hold further discussions on its rate-hike plan.
Which Stocks Benefit the Most?
Against the backdrop of easing rate expectations, Tech Stocks have become the most direct beneficiaries. The logic is that Tech Companies’ valuations are highly sensitive to interest rates because the present value of their future cash flows increases more when discount rates decline.
After the June CPI data release, the Nasdaq Composite Index rose 0.91%. Most large-cap Tech Stocks gained: NVIDIA up 4.06%, Google up 1.99%, Meta up 0.66%, Tesla up 0.36%, and Amazon up 0.07%.
NVIDIA’s rally was particularly notable. As a core supplier of AI computing infrastructure, NVIDIA is in a long capital expenditure cycle. Demand from global technology giants for AI chips remains strong, forming the company’s earnings base. Meanwhile, warming rate-cut expectations reduced the “penalty” the market applies to NVIDIA’s high valuation multiples—when interest rates fall, the market is willing to pay a higher premium for high growth.
The AI hardware sector performed even more aggressively overall. SK hynix surged more than 27% that day, and closed at a premium of more than 50% versus South Korea-listed shares; SanDisk rose more than 5%, and Micron Technology climbed nearly 5%. This shows that the market’s preference for AI hardware is spreading from leading stocks to the entire industrial chain.
A strong performance from large bank stocks provided another layer of support for the market. Goldman Sachs’ second-quarter profit beat expectations, and its stock jumped 9%; JPMorgan and Bank of America rose 2.5% and 1.9%, respectively. Early positives in bank earnings resonated with inflation data, jointly driving a rebound in risk appetite.
However, there was also divergence within Tech Stocks. Microsoft fell 1.55% and Apple dropped 0.77% that day. This divergence indicates the market is not buying all Tech Stocks the same way; instead, it is selectively allocating capital to sub-sectors with more growth certainty, such as AI hardware and semiconductors.
Why Are Crypto Assets Rising in Sync?
The performance of Bitcoin and Ethereum after the CPI release further validates crypto assets’ attribute as liquidity-sensitive assets.
Bitcoin started a rebound from its $62,314 24-hour low after the CPI data was released, reaching as high as $65,100 and setting the highest level since June 22. According to Gate market data, as of July 15, Bitcoin was temporarily around $64,725, up 3.6% over 24 hours. Ethereum performed even more strongly: after hitting a low of $1,774, it surged to a peak of $1,896, with a single-day gain of 5.04%.
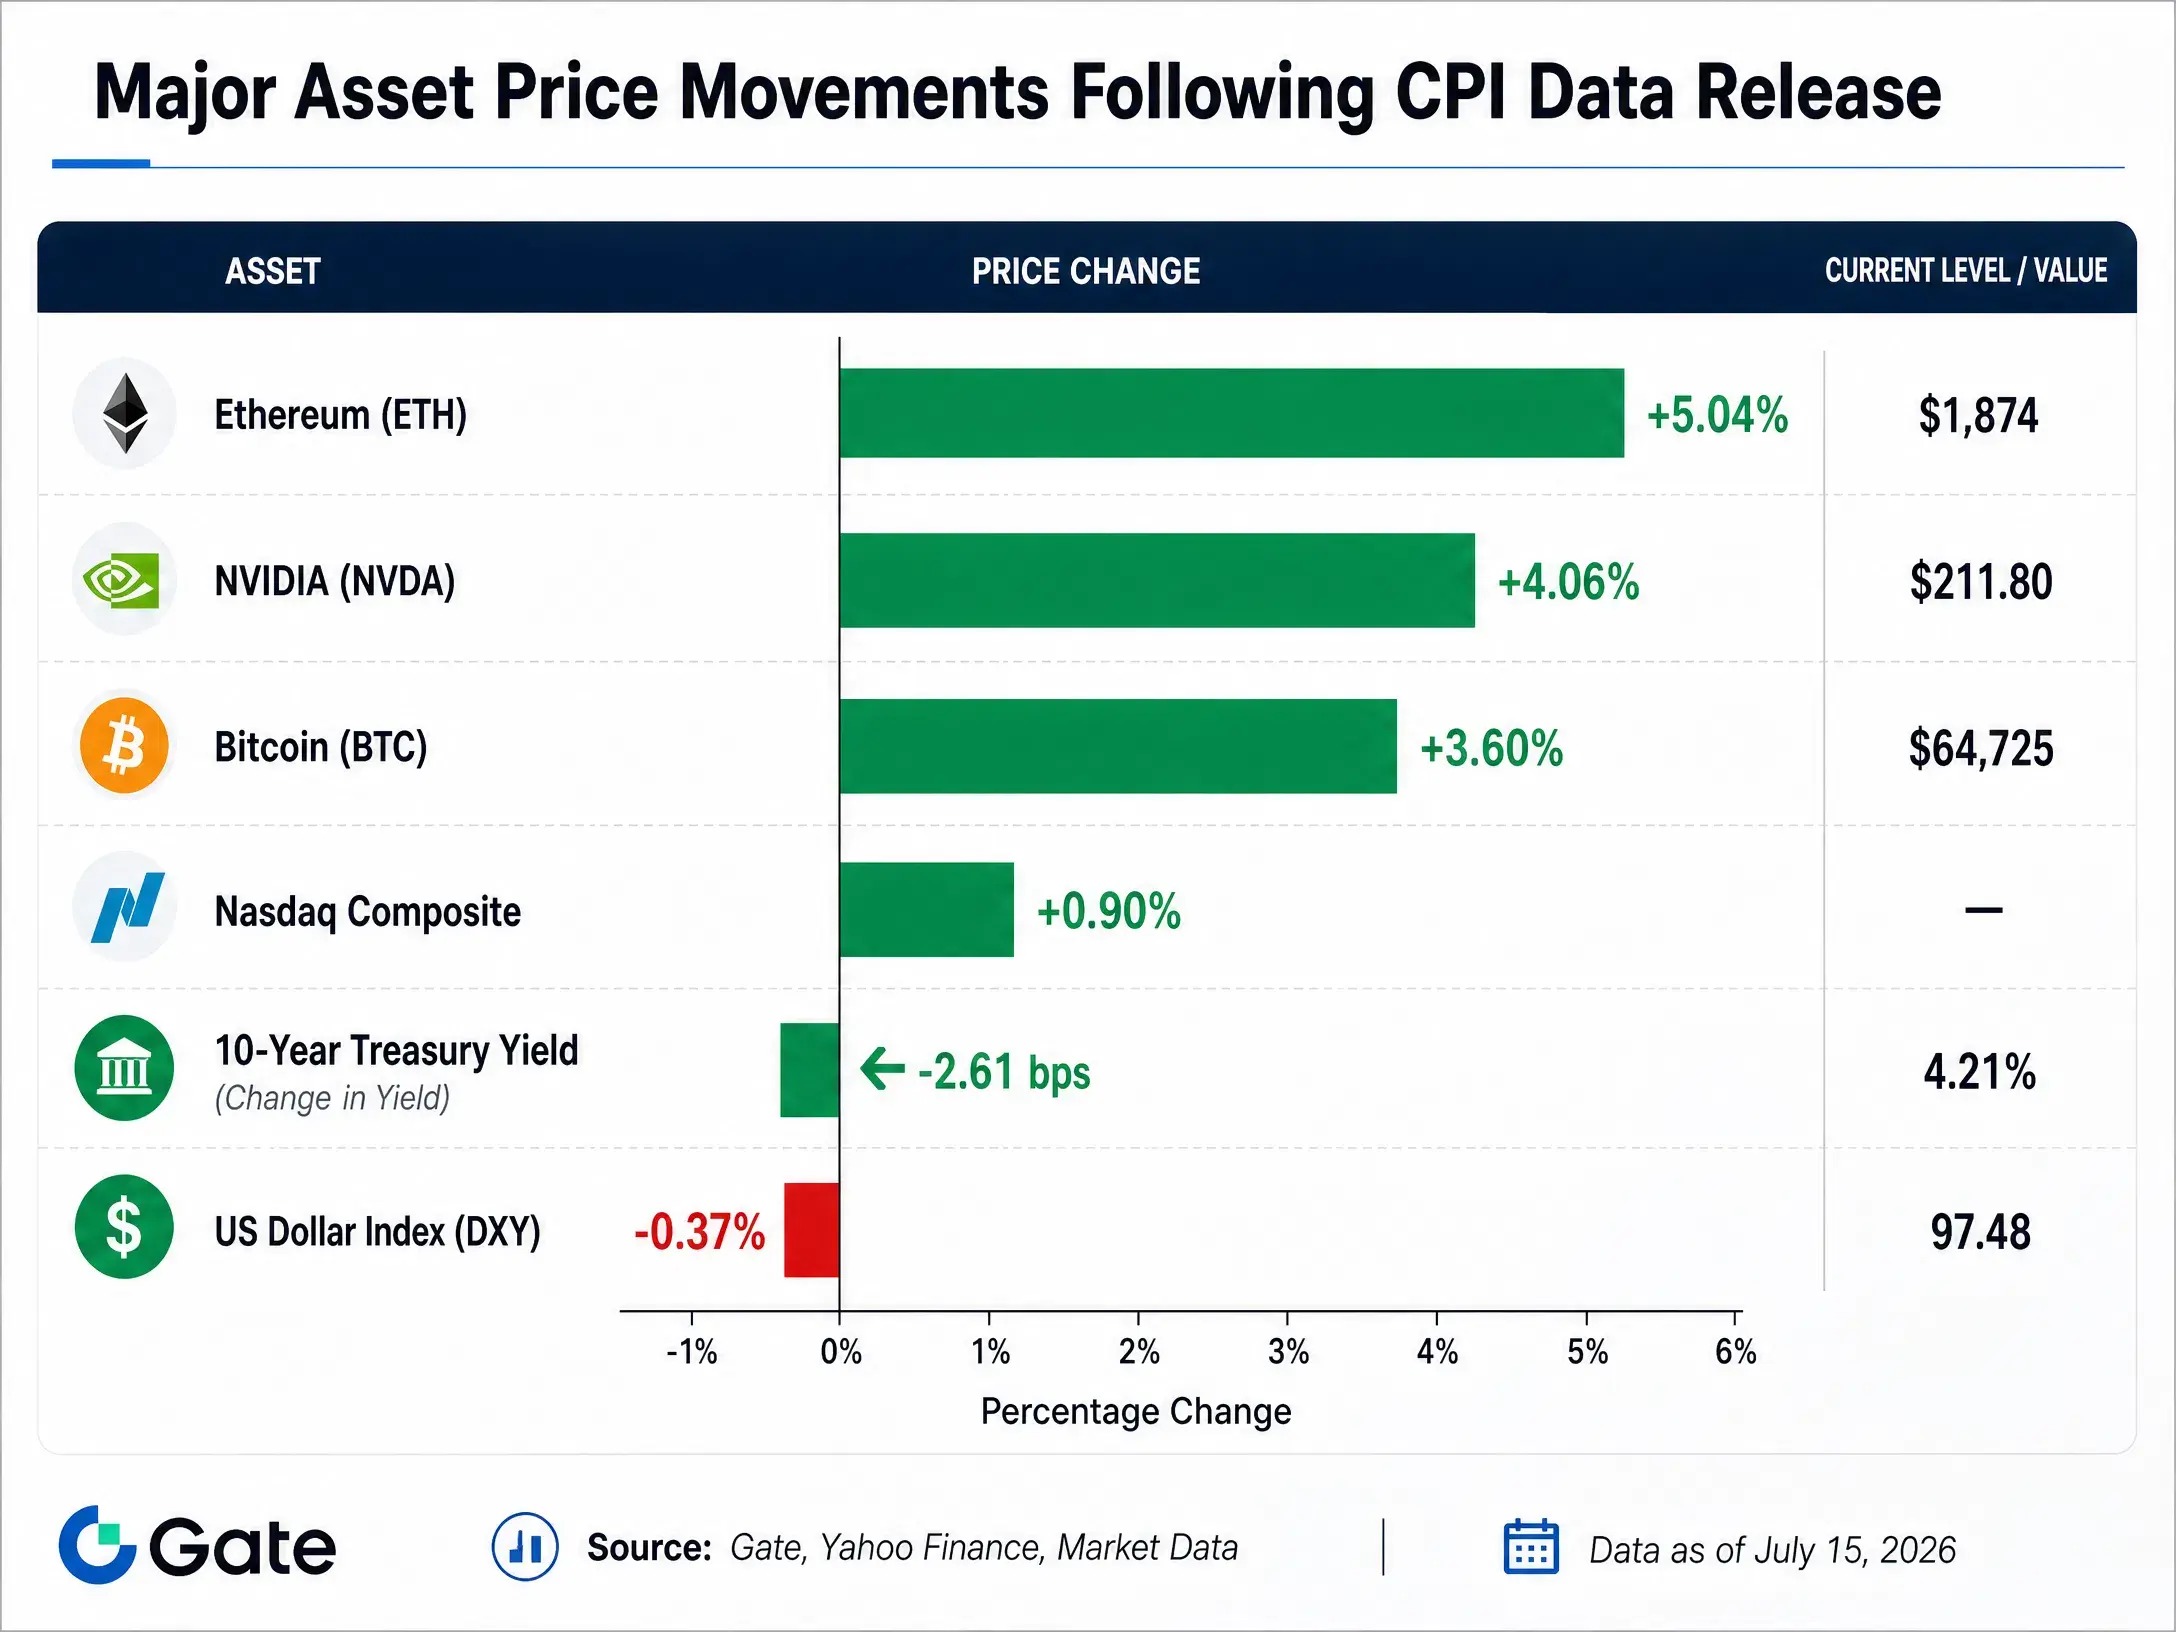
Major Asset Price Moves After the CPI Data Release
On-chain data shows that this rally came with a pronounced squeeze. Over the past 24 hours, about 69,762 people across the whole network were liquidated, with total liquidation amounts of approximately $355 million; liquidations on short positions reached $287 million, accounting for about 81%. This suggests that a sizable portion of market participants had previously bet that the CPI print would be hotter and that Fed rate-hike expectations would rise, and the directional reversal after the data forced these short positions to be closed, further amplifying the upside move.
Crypto assets and Tech Stocks share the same macro-driven logic. Easing inflation → falling rate-hike expectations → improved dollar liquidity → higher risk appetite → capital returning to high-volatility assets—this transmission chain also applies to the crypto market. Fabian Dori, Chief Investment Officer at crypto bank Sygnum, said that the latest inflation data released a positive signal, meaning the inflation pressure driven by a spring rise in energy prices is gradually subsiding rather than spreading further into broader areas, which is supportive for the crypto market.
From a longer-term perspective, U.S. spot Bitcoin ETFs recorded a net inflow of $90.4 million on July 10, led by BlackRock’s IBIT. Persistent inflows from institutional capital indicate that even in an environment with high macro uncertainty, the value of crypto assets as an alternative asset allocation is being recognized by more traditional investors.
That said, market participants also note that the Middle East situation remains an important variable affecting the crypto market. Escalation of geopolitical risks could again push up energy prices and inflation expectations, reversing the current “dovish expectations” trade.
Conclusion
The June CPI data provided the market with a clear signal: U.S. inflation is moving toward the 2% target, though the path may not be smooth. In the short term, the data significantly weakened expectations for the Fed to hike further, driving U.S. Treasury yields lower, the U.S. dollar weaker, and a broad rebound in risk assets.
Tech Stocks and crypto assets stood out especially during this process, reflecting the market’s repricing of interest-rate-sensitive assets. The rally in AI hardware leaders such as NVIDIA benefited from a dual logic—long-term trends in AI capital expenditures combined with short-term catalysts from loosening rate expectations; Bitcoin’s rebound also confirmed crypto assets’ characteristics as a barometer for liquidity expectations.
However, the market should not treat any single data print as confirmation of a trend. Fed Chair Warsh’s “zero tolerance” stance on inflation, geopolitical risks tied to energy prices, and potential structural inflation pressure from AI investment are all important constraints on a policy shift. Current market pricing for keeping rates unchanged in July is already fairly well accounted for, but expectations for rate cuts later this year remain far off.
For investors, understanding the transmission logic between CPI data and asset prices is more valuable in the long run than chasing short-term volatility from a single data release. Until inflation returns to the target range, each market interpretation of the data will come with a recalibration of the Fed’s policy path.
FAQ
Q: What are the specific CPI numbers for the U.S. in June?
U.S. June CPI fell 0.4% month over month, the first monthly negative growth since May 2020; year over year it rose 3.5%, below May’s 4.2% and the market’s 3.8% expectation. Core CPI was flat month over month and rose 2.6% year over year, also below expectations.
Q: How did market expectations for Fed rate hikes change after the CPI data release?
Before the data release, the market’s probability expectation for a 25 bps hike in July was 41.7%; after the release, it fell sharply to 15.5%. The probability of keeping rates unchanged in July rose from 58.3% on the prior day to 83.4%. However, the market still expects at least one rate hike before year-end.
Q: Why did Tech Stocks react so strongly to the CPI data?
Tech companies’ valuations are highly sensitive to interest rates. When rates fall, the discount rate applied to future cash flows decreases, boosting valuations. AI hardware stocks such as NVIDIA also have long-term tailwinds from the AI capital expenditures cycle, which is why they performed particularly well in this rebound.
Q: What is the logic behind Bitcoin’s rise?
Easing inflation → falling rate-hike expectations → improved dollar liquidity → higher risk appetite → capital returning to high-volatility assets—this transmission chain also applies to the crypto market. On the day, Bitcoin jumped from the $62,314 low to as high as $65,100.
Q: Will the Fed cut rates next?
In the short term, the likelihood of rate cuts is low. Most institutions expect the Fed to hold rates unchanged in 2026, with cuts possibly beginning only in the second half of 2027. Warsh’s “zero tolerance” stance on inflation means any recurrence of inflation could delay a policy shift.