
Key Takeaways
-
Near Protocol (NEAR) is gaining momentum, with price up nearly 18% over the past 30 days.
-
The daily chart shows a well-defined inverse head and shoulders pattern, signaling a potential bullish reversal.
-
NEAR is consolidating just below a key neckline resistance zone between $1.79 and $1.88.
-
Reclaiming the 100-day moving average near $1.96 would strengthen the bullish breakout case.
-
A confirmed breakout could open the door toward the $2.36 upside target.
-
Failure to hold above the $1.65 support zone may lead to further consolidation and delay the bullish setup.
The cryptocurrency market’s AI narrative has been gaining renewed traction, and Near Protocol (NEAR) is emerging as one of the standout performers. Over the past 30 days, NEAR has surged nearly 18%, and beyond the price action, the project continues to strengthen fundamentally.
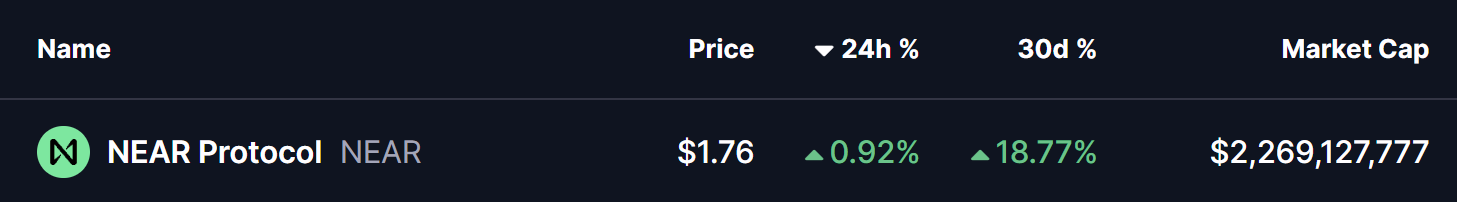
Source: Coinmarketcap
NEAR currently ranked as the third most active blockchain by 38.9 monthly users, trailing only BNB Chain and Solana — a signal that on-chain usage and developer activity remain strong.
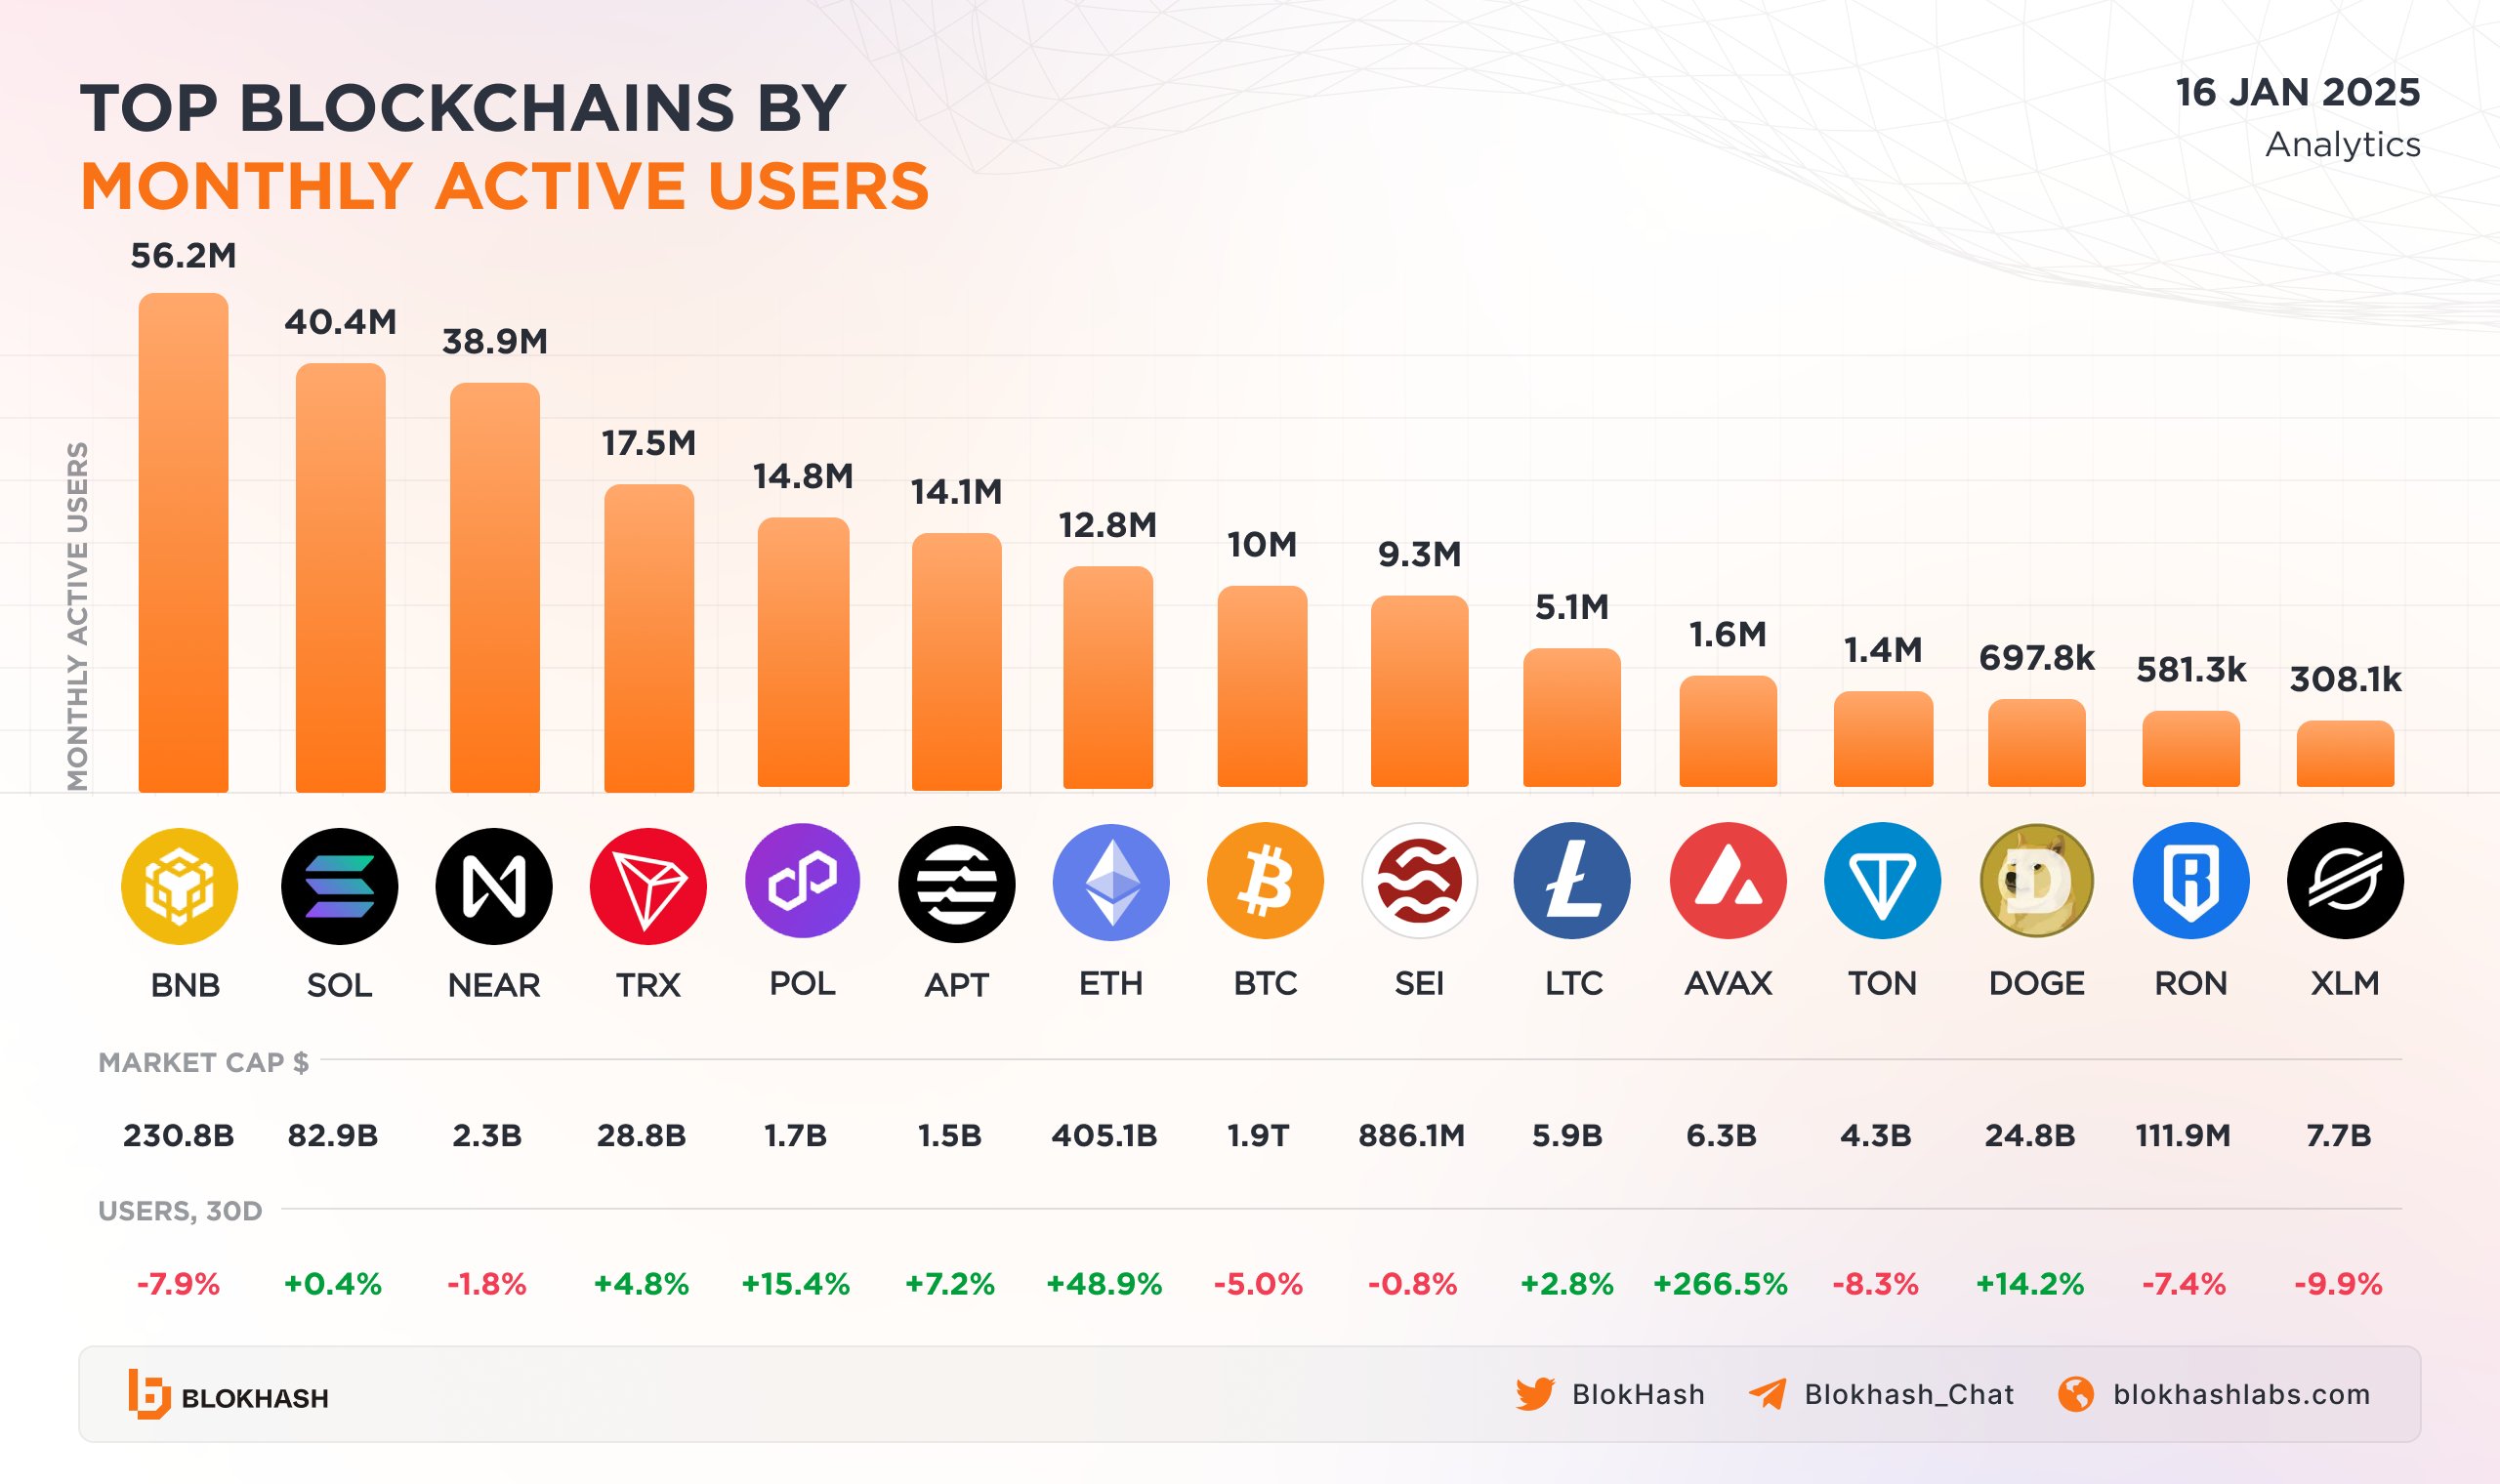
Top 10 Blockchains By Active Users/Source: @BlokHash (X)
More importantly, the daily chart is now revealing a classic bullish reversal structure, suggesting that NEAR could be positioning itself for a meaningful upside continuation.
Inverse Head and Shoulders Pattern Takes Shape
On the daily timeframe, NEAR has formed a well-defined inverse head and shoulders pattern, a setup widely regarded as one of the most reliable bullish reversal formations in technical analysis.
-
The left shoulder developed in early December near the $1.65 region, where selling pressure temporarily paused.
-
This was followed by a deeper decline toward the $1.45 area, forming the head, as broader market weakness weighed on price.
-
The right shoulder then emerged as NEAR once again found support near $1.65, signaling that sellers were losing control.
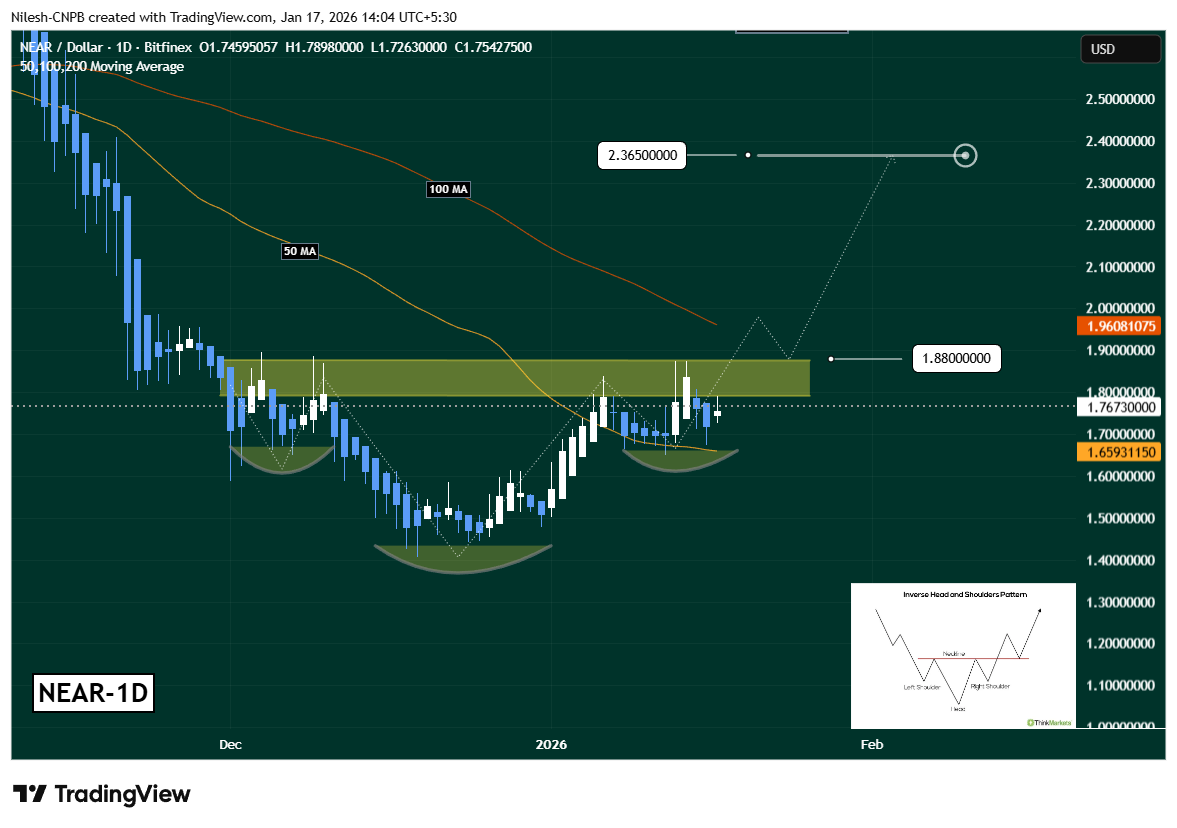
Near Protocol (NEAR) Daily Chart/Coinsprobe (Source: Tradingview)
Since completing this structure, NEAR has rebounded steadily and successfully reclaimed the 50-day moving average, which is now acting as dynamic support. At present, price is consolidating just below a key neckline resistance zone between $1.79 and $1.88, clearly highlighted on the chart.
This compression near resistance often precedes a volatility expansion, suggesting that a decisive move could be approaching.
What’s Next for NEAR?
For bullish momentum to gain confirmation, NEAR needs a strong daily close above the $1.79–$1.88 neckline, ideally followed by a successful retest of this zone as support. Such a move would validate the inverse head and shoulders breakout and confirm a shift in short-term market structure.
Additional strength would come from reclaiming the 100-day moving average near $1.96, which has capped price during the recent downtrend. A break above this level could accelerate upside momentum as sidelined buyers step back in.
If these conditions are met, the measured move projection from the inverse head and shoulders pattern points toward the $2.36 region, representing a potential upside of roughly 26% from the breakout area.
On the downside, failure to clear the neckline could lead to further consolidation. In that scenario, holding above the 50-day moving average and the $1.65 support zone will be crucial to keep the bullish structure intact. A loss of these levels would delay the breakout thesis and shift focus back to range-bound price action.
Bottom Line
NEAR Protocol appears to be coiling beneath resistance, supported by a textbook bullish reversal pattern and improving broader sentiment. While confirmation is still needed, the technical structure suggests accumulation rather than distribution, with buyers gradually gaining control.
Disclaimer: The views and analysis presented in this article are for informational purposes only and reflect the author’s perspective, not financial advice. Technical patterns and indicators discussed are subject to market volatility and may or may not yield the anticipated results. Investors are advised to exercise caution, conduct independent research, and make decisions aligned with their individual risk tolerance.
About Author: Nilesh Hembade is the Founder and Lead Author of Coinsprobe, with over 5 years of experience in the cryptocurrency and blockchain industry. Since launching Coinsprobe in 2023, he has been providing daily, research-driven insights through in-depth market analysis, on-chain data, and technical research.
Disclaimer: The information on this page may come from third parties and does not represent the views or opinions of Gate. The content displayed on this page is for reference only and does not constitute any financial, investment, or legal advice. Gate does not guarantee the accuracy or completeness of the information and shall not be liable for any losses arising from the use of this information. Virtual asset investments carry high risks and are subject to significant price volatility. You may lose all of your invested principal. Please fully understand the relevant risks and make prudent decisions based on your own financial situation and risk tolerance. For details, please refer to
Disclaimer.
Related Articles
Dogecoin Flashes Rare Trend Reversal Signal, DOGE Price to $0.15? - U.Today
Dogecoin (DOGE) shows signs of a bullish reversal after a Heikin Ashi green candle emerged, suggesting potential for a rally to $0.15. Increased whale accumulation and trading volume bolster confidence in DOGE's upward trend.
UToday22m ago
Ethereum Price: Analyst Flashes Major ‘Buy’ Signal, Rally to $2,600 Soon?
March 16, 2026 8:15 pm EDT
TheCoinRepublic29m ago
BTC broke through $74,000 this week, with short-term holders' profits surging to $18.4 million per hour.
Gate News reported that on March 17, according to Glassnode data, Bitcoin price made a modest breakthrough above $74,000 this week, with short-term holder realized profit (STH-Realized Profit, 12-hour simple moving average) surging to $18.4 million per hour. This is consistent with the pattern observed in February: short-term holders continuously drain momentum from each bounce at the $70,000 level, absorbing upward momentum before any real breakout can form.
GateNews1h ago
Gold Shop Gold Purchase Loss 8%! Real Test "On-Chain Gold" Token PAXG Total Fees Crush Taiwan Bank Passbook
There are three ways for Taiwanese people to buy gold: Taiwan Bank Gold Passbook, gold shops, and on-chain gold token PAXG. Surveys show that despite PAXG appearing complex, its fees are actually the lowest, at approximately 1.2-3.2%. Gold shop transaction spreads reach as high as 8%, while Taiwan Bank is 2.3%. PAXG offers 24-hour liquidity, but the threshold for redeeming physical gold is high. Your choice should consider security, fees, and liquidity needs.
動區BlockTempo1h ago
ETH Price Chart Sees Bullish Pattern on Repeat, Is $30,000 ETH ATH a Possibility?
Pioneer altcoin ETH price chart sees bullish pattern on repeat.
Another expert expects $30,000 ATH target for ETH.
How high can the price of ETH go this year?
The crypto market grows steadily bullish once again as the price of Bitcoin (BTC) reclaims prices above the $74,00 price range an
CryptoNewsLand2h ago
