Kaspa (KAS) is moving through a rough market phase, but development on the network continues in the background.
A major hardfork is scheduled for May, introducing smart contracts and native assets through a covenant-focused upgrade. The goal is to bring programmability directly to Layer 1.
Kaspa has now processed over 600 million transactions, showing that people are still using the network and that its BlockDAG system is handling activity well.
Even with that progress, the broader market drop in late February, driven by geopolitical tension, pulled most crypto prices down, including KAS. The KAS price was not spared and is now trading around $0.02985 after testing support.
- What the Kaspa Chart Is Showing
- What the Indicators Are Saying
- Kaspa Price Targets to Watch This Week
What the Kaspa Chart Is Showing
On the 4H chart, KAS remains in a broader downtrend. Price has been forming lower highs for weeks, and each bounce has struggled to gain momentum.
The recent correction took the Kaspa price down to the range of $0.024 to $0.025, but the token has since traded sideways in the range of $0.028 to $0.031. That range now defines the short-term battle zone.
Right now, KAS is trading just under $0.03. The market is no longer falling aggressively, but it also hasn’t broken structure. It looks more like stabilization after a drop rather than a confirmed reversal.
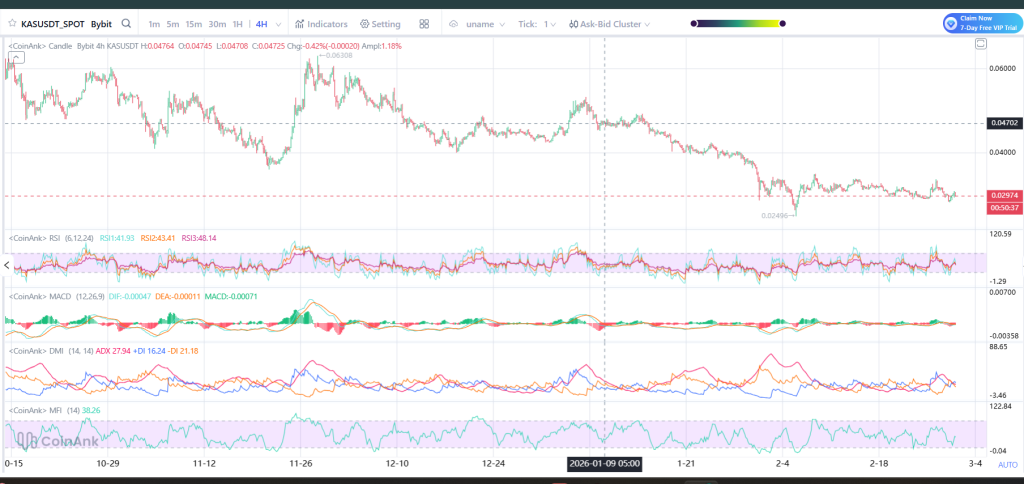
Source: Coinank
What the Indicators Are Saying
RSI is around the low 40s. That means the KAS price isn’t deeply oversold, but it’s not strong either. Buyers are not clearly in control.
MACD is flat with small bars, so there is no clear trend right now and no strong bullish signal.
DMI shows sellers slightly ahead, but not by much. The gap is small. MFI is also in the middle, which means money is flowing in and out evenly.
All of this points to one thing: the market is moving sideways, not making a big move yet.
_****Sei (SEI) Price at Historic Support as Experts Call It the “Final Gift”**
Kaspa Price Targets to Watch This Week
If KAS holds above $0.028, the next price to look at is $0.032. If it gets above $0.032, it can move toward $0.036–$0.038. After that, $0.047 is the next big level.
If the Kaspa price falls below $0.028, then $0.025 comes into view. If it drops under $0.025, the next area is around $0.022.
For now, KAS is trying to calm down after weeks of falling. The network news is positive, but the chart needs a move above $0.032 to look stronger. This week should show whether price starts climbing or tests lower levels again.
Disclaimer: The information on this page may come from third parties and does not represent the views or opinions of Gate. The content displayed on this page is for reference only and does not constitute any financial, investment, or legal advice. Gate does not guarantee the accuracy or completeness of the information and shall not be liable for any losses arising from the use of this information. Virtual asset investments carry high risks and are subject to significant price volatility. You may lose all of your invested principal. Please fully understand the relevant risks and make prudent decisions based on your own financial situation and risk tolerance. For details, please refer to
Disclaimer.
Related Articles
How likely is it that HYPE will increase fivefold? HIP-3 is the most powerful engine.
Author: Ishika Kumari, AMB Crypto
Compiled by: Peggy, BlockBeats
Editor's Note: Against the backdrop of increasing macroeconomic uncertainty and persistently low sentiment in the crypto market, an intriguing divergence is emerging: investor sentiment remains in the "extreme fear" zone, while some asset prices are gradually beginning to rise.
Recently, a decentralized derivatives trading platform
PANews17m ago
Bitcoin Finally Won? JPMorgan: Funds Shift After Iran Tensions, Bitcoin ETF Inflows Surpass Gold
JPMorgan report shows that since the onset of the Iran conflict, Bitcoin spot ETFs have experienced capital inflows of 1.5%, while gold ETFs have seen capital outflows of 2.7%. This phenomenon indicates that market preferences for safe-haven assets are shifting and reflects rising institutional investor attention on Bitcoin. However, institutions still prefer gold and maintain a cautious stance on Bitcoin. Analysts are optimistic about Bitcoin's long-term prospects and forecast a price target of $266,000.
ChainNewsAbmedia21m ago
On-chain activity is exploding, but Ethereum can't seem to gain momentum? Experts reveal the "fatal weakness": could drop to $1,500
CryptoQuant reports indicate that Ethereum faces an "adoption paradox," where despite network activity reaching new highs, the token price has declined. If the bear market continues, Ether could potentially fall to $1,500 by the end of the third quarter. Smart contract activity has risen while decoupling from Ether's price, with exchange inflows being a better reflection of price dynamics. Weak investment demand and continuous capital outflows remain the primary concern.
区块客30m ago
Pi Network Lists on Major CEX, Price Surges 30% in a Month Before Pi Day
Pi Network has seen a recent trading price increase of approximately 10%, primarily driven by the upcoming listing of the PI token on a major U.S. centralized exchange and Pi Day, which has boosted retail investor confidence. Technical analysis shows a bullish outlook in the short term, though caution remains warranted for the medium to long term. Community sentiment has warmed, indicating renewed retail interest, which provides support for short-term upside potential.
MarketWhisper1h ago
Ripple Splurges $750 Million on Share Buyback While XRP Continues Declining: Why Is the Company's Strategy Diverging from Token Value?
Ripple announced a $750 million stock buyback, with its company valuation potentially rising to $50 billion, yet the XRP token price continues to decline, exposing a decoupling phenomenon between the company and the token. Market confidence in Ripple and XRP is gradually diverging, requiring investors to clarify whether they are investing in company strength or token value, as they face challenges from regulation, utility, and market patience.
PANews1h ago
XRP Today's News: Rare Bottom Signal Appears, Technical Analysis Suggests Price Reversal Approaching
According to Glassnode data, XRP exhibits two major indicator signals indicating that the price is below its fair value, and the realized profit/loss ratio is approaching 1.0, which historically suggests a possible rebound. Additionally, XRP is consolidating within a symmetrical triangle pattern, with a key resistance at $1.50 and support at $1.30, as the market is about to experience a breakout in a specific direction.
MarketWhisper1h ago