
Hedera (HBAR) is in the news again, but the price chart still looks unsure. A senior U.S. transportation official recently secured a patent for a nationwide road usage system that runs on decentralized ledger technology and is compatible with Hashgraph. That is a serious use case tied to public infrastructure, not just crypto speculation.
However, the HBAR price slipped toward $0.10 as Bitcoin weakened. The market pulled back across the board, and HBAR followed. Volume eased slightly, hinting that aggressive selling may be slowing down.
So there’s a split picture right now: long-term utility talk on one side, short-term technical pressure on the other.
- Hedera Price Is Holding a Thin Line Near $0.10
- What the Indicators Are Saying
- HBAR Price Targets This Week
Hedera Price Is Holding a Thin Line Near $0.10
On the 4H chart, HBAR has been drifting lower for months. Each of the bounces has been smaller than the previous one. Price fell towards the $0.072 price level before rising again and finding support just under the $0.10 price level.
Right now, the price levels around $0.088-$0.10 are the levels to watch. The HBAR price is sitting almost exactly on it. That tells us buyers are defending this level, but not with much strength. The structure is flat, not impulsive. It looks more like a pause than a breakout.
There is also clear resistance above. The $0.11–$0.12 area has rejected the price several times. Until HBAR price breaks clean through the $0.12 price level, the trend is still weak. The chart isn’t falling, but it isn’t strong either.
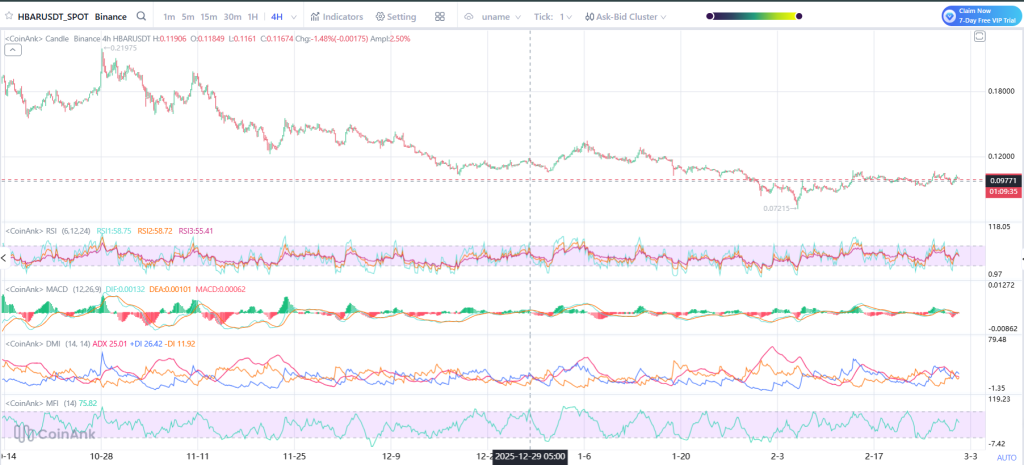
Source: Coinank
What the Indicators Are Saying
RSI is sitting around the middle range. It is not oversold and not overheated. That means there is room to move either way. Momentum is neutral.
MACD is close to flipping negative. The histogram bars are small. That shows there is no strong push from buyers right now. Direction is unclear.
DMI shows buyers and sellers are close, with no clear dominance. MFI is elevated but not extreme, which means money is flowing in and out without strong conviction.
Overall, the indicators point to consolidation. The market is waiting.
_****ChatGPT Predicts the Price of Cardano and Polkadot If the CLARITY Act Passes**
HBAR Price Targets This Week
If HBAR can continue to trade above the $0.088 to $0.10 area, the next area of interest would be the $0.11 level, with a break through the $0.12 level potentially leading to a move towards the $0.135 area.
If momentum builds beyond that, $0.15 becomes the next larger target from previous structure.
On the downside, losing $0.088 would expose $0.072 again. If that level fails, the next area sits near $0.065.
For now, the HBAR price is trying to stabilize. The government patent story adds weight to the long-term case, but this week depends on whether price can push back above $0.12 or slips under support again.
Disclaimer: The information on this page may come from third parties and does not represent the views or opinions of Gate. The content displayed on this page is for reference only and does not constitute any financial, investment, or legal advice. Gate does not guarantee the accuracy or completeness of the information and shall not be liable for any losses arising from the use of this information. Virtual asset investments carry high risks and are subject to significant price volatility. You may lose all of your invested principal. Please fully understand the relevant risks and make prudent decisions based on your own financial situation and risk tolerance. For details, please refer to
Disclaimer.
Related Articles
VIA Soars 23.45% in Minutes — Traders React to Whale Activity
VIA's price surged by 23.45% in five minutes, currently trading at $0.002026. The rise is linked to increased whale activity and broader market trends, prompting traders to monitor key resistance and support levels.
Coinfomania8m ago
CryptoQuant: Ethereum Adoption Paradox Deteriorates, Price May Fall to $1500
Ethereum faces an "adoption paradox," where network activity reaches record highs but ETH price has fallen sharply, showing a divergence between the two. Analysis points out that current network activity growth primarily comes from automated contracts like DeFi, rather than genuine user demand, which intensifies selling pressure. If the bear market continues into 2026, ETH could fall to $1,500. Attention should be paid to changes in capital inflows and exchange inflows to determine whether ETH will emerge from the bear market.
MarketWhisper10m ago
Crypto market rebounds this morning, BTC touches $72,000, funding rates return to neutral
The crypto market rebounded on March 13, with Bitcoin recovering to 72,000 USD and Ethereum recovering to 2148 USD. Funding rates on major exchanges returned to neutral levels, indicating that bearish sentiment has eased. The funding rate is a mechanism that adjusts the relationship between contract prices and asset prices.
GateNews34m ago
Cardano Price Near Key Pivot as Macro Liquidity Signals Shift
Key Insights
Analyst Dan Gambardello links Cardano’s monthly RSI reset and macro liquidity cycles to conditions that previously preceded ADA’s explosive 2020–2021 rally.
ADA trades near $0.26 while the $0.288 moving average forms resistance, and the $0.24 to $0.25 zone continues acting as
CryptoFrontNews50m ago
Solana Tests $90 Resistance as Fibonacci Confluence Signals Key Turning Point
Key Insights
Solana price is nearing a major resistance near $90 where Fibonacci retracement and value area levels align, creating a decisive technical barrier.
Market structure shows the rally forming part of an ABC corrective pattern, keeping the broader consolidation intact while price tr
CryptoFrontNews55m ago
Easing oil price surge! US Treasury Secretary: Open to purchasing Russian offshore oil, Bitcoin breaks through 72,000
The United States temporarily opened purchases of stranded Russian oil at sea to ease soaring oil prices, causing oil prices to decline. Bitcoin surged past $72,000. Meanwhile, gold ETFs experienced capital outflows, indicating increased institutional participation in the Bitcoin market and improved market liquidity.
CryptoCity55m ago