Analyst Says Not Buying Kaspa (KAS) Here Is a “Disservice” – Here’s WhyTraders are talking more about Kaspa (KAS), but this time it’s not about excitement or noise.
One market watcher said skipping Kaspa at these prices would feel like doing his family a disservice. He’s aiming for $0.23 and pointed out that he was already buying when KRC20 first launched, even near the highs.
Now that the KAS price has cooled off and the project has continued to build, he says he feels even better about it. Right now, KAS is changing hands around $0.0298.
- Here’s What Kaspa Chart Is Showing
- Why the Analyst Is Confident
- What Needs to Happen Next For Kaspa
Here’s What Kaspa Chart Is Showing
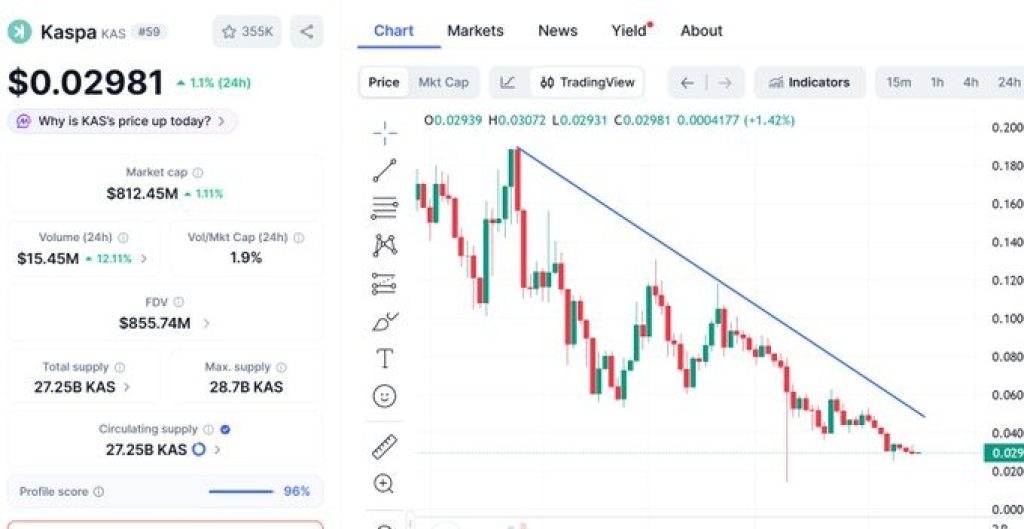
Looking at the chart, Kaspa has been in a clear downtrend for months. The KAS price previously peaked much higher before steadily printing lower highs under a descending trendline.
That blue trendline on the chart shows consistent rejection from sellers over time. Every bounce has been capped beneath it.
However, something different is happening now. The KAS price has moved sideways near the $0.029–$0.03 region after a prolonged decline.
Instead of sharply breaking down, price is compressing near recent lows. That often signals exhaustion rather than panic selling. The steep flush lower has already happened. Now the market is trying to find balance.
_Source: _****X/Finance Freeman
Why the Analyst Is Confident
The tweet highlights one key point: fundamentals versus price. The analyst spoke about everything about Kaspa as a project is stronger today than it was during previous highs. That’s a common long-term investor thesis, development improves while price pulls back.
The $0.23 target mentioned in the tweet likely refers to a short-to-mid-term technical move. From current levels, that would represent a meaningful bounce if momentum builds. Importantly, the tone isn’t about chasing strength. It’s about accumulation during weakness.
_****XRP Price Prediction: What Happens If Ripple’s $100B Payments Network Expands?**
What Needs to Happen Next For Kaspa
Right now, KAS is sitting under a long-term descending resistance line. For a stronger recovery, price would need to break above that trendline and hold above the $0.035–$0.04 area.
That would shift short-term structure and open the door toward the mid-$0.05 region. On the downside, if $0.029 fails, the next support area comes slightly below near $0.025.
At this stage, the chart shows stabilization, not a confirmed reversal. The analyst’s conviction is based on long-term belief in the project. The KAS chart shows compression after a prolonged drop. Whether that turns into a bounce or another leg lower will likely define the next few weeks.
For now, the Kaspa price is at a decision point, and that’s exactly where long-term buyers usually start paying attention.
Disclaimer: The information on this page may come from third parties and does not represent the views or opinions of Gate. The content displayed on this page is for reference only and does not constitute any financial, investment, or legal advice. Gate does not guarantee the accuracy or completeness of the information and shall not be liable for any losses arising from the use of this information. Virtual asset investments carry high risks and are subject to significant price volatility. You may lose all of your invested principal. Please fully understand the relevant risks and make prudent decisions based on your own financial situation and risk tolerance. For details, please refer to
Disclaimer.
Related Articles
Michael Saylor: Strategy - There is a time lag between buying Bitcoin and price appreciation
Gate News reports that on March 12, Strategy founder Michael Saylor posted: "There is a time lag between when we purchase Bitcoin and when the Bitcoin price skyrockets."
GateNews21m ago
Why OXT Just Skyrocketed 21.97% in 30 Minutes
OXT price surged 21.97%, now at $0.0211, driven by macroeconomic trends and increased trading activity. Analysts suggest the bullish sentiment in major cryptocurrencies boosts altcoin interest, while traders watch key resistance and support levels.
Coinfomania25m ago
BTC Rises 0.79% in 15 Minutes: On-Chain Large Capital Inflows and Favorable Macro Policies Drive Market Upswing
2026-03-12 15:15 to 2026-03-12 15:30 (UTC), BTC recorded a +k-line return of 0.79%, with price fluctuating between 69702.5 and 70428.9 USDT, reaching an amplitude of 1.04%. Trading activity was robust during this time window, with noticeably elevated market attention and intensified short-term volatility.
The primary driver of this price movement was on-chain large fund flows and increased institutional participation. During the same period, multiple large transfers exceeding 1,000 BTC flowed into exchange cold wallets, with whale addresses concentrating their buying activities. [Text appears to be incomplete]
GateNews29m ago
ETH 15-minute surge 0.94%: On-chain capital inflows and technical upgrade expectations resonate to drive gains
2026-03-12 15:15 to 2026-03-12 15:30 (UTC), ETH fluctuated within 1.15%, with price rising from 2047.22 USDT to 2070.72 USDT, achieving +0.94% gains. During the same period, market attention increased, trading volume expanded significantly, volatility enhanced compared to daily levels, and on-chain activity and capital flow data expanded synchronously, indicating concentrated efforts from bullish forces.
The main driving forces behind this price movement stem from concentrated on-chain capital inflows and technical upgrade expectations resonance. On-chain data shows that during the anomaly period ETH activity
GateNews29m ago
Bitcoin-to-Gold Ratio Shows Bullish Divergence, Bitcoin ETF Net Inflows of $906 Million Over the Past Month
On March 12, Bitcoin's ratio against gold displayed bullish divergence, indicating weakened selling pressure and potentially serving as a reference point for Bitcoin's long-term trend bottom. Bitcoin ETF net inflows reached approximately $906 million, while gold ETF experienced single-day outflows of $3 billion, forming a notable divergence. Despite ETF trading volume being lower than US equities, there remains significant room for institutional capital entry. Historically, Bitcoin has often rebounded following geopolitical turmoil.
GateNews31m ago
REQ Soars 21.77% — What Does This Mean for Traders?
Request Network (REQ) surged 21.77% within an hour, reaching $0.0839 amid growing trader interest. Market conditions, bullish sentiment, and DeFi trends may be driving this rally, while traders monitor key resistance and support levels for future movements.
Coinfomania1h ago