
Gold just went through a sharp shakeout. Today, the XAU price dropped nearly $300, catching many traders off guard. But not everyone believes the move marks the start of a deeper slide.
Analyst Shirley argues that the decline may already be complete and expects a rebound into the end of the week. At the center of her view is one key area: $5,000–$5,050.
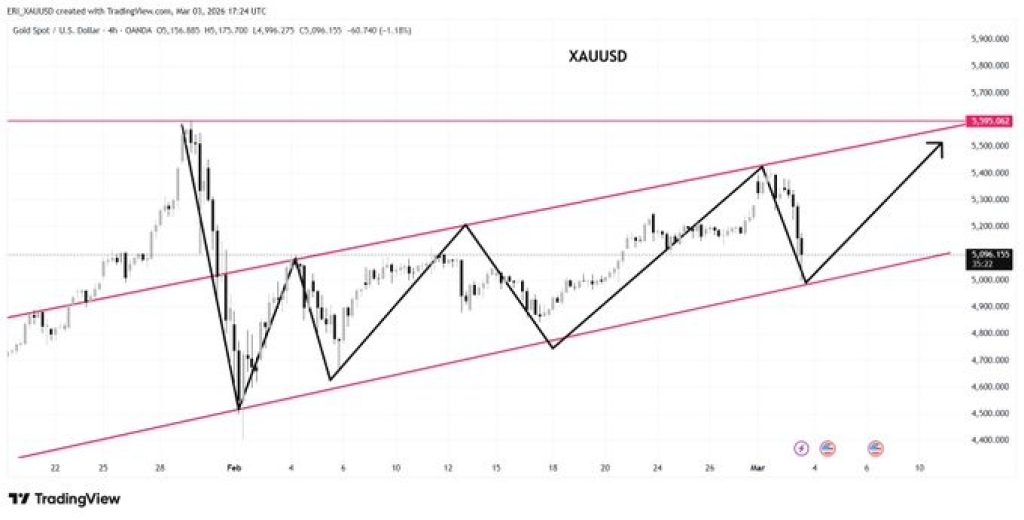
Looking at the chart, gold has been trading inside a rising channel for weeks. Each pullback has found support along the lower boundary of that channel before pushing to new highs. The recent drop sent the Gold price back toward that lower trendline again, right into the $5,000 region.
That area lines up with previous reaction zones and the lower structure of the channel. So far, buyers have stepped in there repeatedly. If this pattern continues, the latest dip could simply be another higher low within an ongoing uptrend.
Source: X/Shirley
Here’s Where Gold Price Could Go
Shirley is looking to add gold between $5,000 and $5,050.
Her thinking is clear. If buyers defend that pocket, price could work its way back toward the top of the rising channel, which comes in around $5,350 to $5,400. That’s the area gold has struggled with before.
If it breaks above that ceiling and stays there, new highs would be within reach.
But if the gold price slips under $5,000 and can’t get back above it, the setup starts to crack. In that case, a slide toward the mid-$4,800s would be on the table.
Even with the recent swings, she hasn’t changed her bigger view. She still sees gold pushing toward $6,300 this year, as long as the wider environment, rising prices, global tensions, and central bank moves, keeps supporting hard assets.
_****3 Stocks To BUY NOW In March 2026**
Disclaimer: The information on this page may come from third parties and does not represent the views or opinions of Gate. The content displayed on this page is for reference only and does not constitute any financial, investment, or legal advice. Gate does not guarantee the accuracy or completeness of the information and shall not be liable for any losses arising from the use of this information. Virtual asset investments carry high risks and are subject to significant price volatility. You may lose all of your invested principal. Please fully understand the relevant risks and make prudent decisions based on your own financial situation and risk tolerance. For details, please refer to
Disclaimer.
Related Articles
Michael Saylor: Strategy - There is a time lag between buying Bitcoin and price appreciation
Gate News reports that on March 12, Strategy founder Michael Saylor posted: "There is a time lag between when we purchase Bitcoin and when the Bitcoin price skyrockets."
GateNews21m ago
Why OXT Just Skyrocketed 21.97% in 30 Minutes
OXT price surged 21.97%, now at $0.0211, driven by macroeconomic trends and increased trading activity. Analysts suggest the bullish sentiment in major cryptocurrencies boosts altcoin interest, while traders watch key resistance and support levels.
Coinfomania25m ago
BTC Rises 0.79% in 15 Minutes: On-Chain Large Capital Inflows and Favorable Macro Policies Drive Market Upswing
2026-03-12 15:15 to 2026-03-12 15:30 (UTC), BTC recorded a +k-line return of 0.79%, with price fluctuating between 69702.5 and 70428.9 USDT, reaching an amplitude of 1.04%. Trading activity was robust during this time window, with noticeably elevated market attention and intensified short-term volatility.
The primary driver of this price movement was on-chain large fund flows and increased institutional participation. During the same period, multiple large transfers exceeding 1,000 BTC flowed into exchange cold wallets, with whale addresses concentrating their buying activities. [Text appears to be incomplete]
GateNews29m ago
ETH 15-minute surge 0.94%: On-chain capital inflows and technical upgrade expectations resonate to drive gains
2026-03-12 15:15 to 2026-03-12 15:30 (UTC), ETH fluctuated within 1.15%, with price rising from 2047.22 USDT to 2070.72 USDT, achieving +0.94% gains. During the same period, market attention increased, trading volume expanded significantly, volatility enhanced compared to daily levels, and on-chain activity and capital flow data expanded synchronously, indicating concentrated efforts from bullish forces.
The main driving forces behind this price movement stem from concentrated on-chain capital inflows and technical upgrade expectations resonance. On-chain data shows that during the anomaly period ETH activity
GateNews29m ago
Bitcoin-to-Gold Ratio Shows Bullish Divergence, Bitcoin ETF Net Inflows of $906 Million Over the Past Month
On March 12, Bitcoin's ratio against gold displayed bullish divergence, indicating weakened selling pressure and potentially serving as a reference point for Bitcoin's long-term trend bottom. Bitcoin ETF net inflows reached approximately $906 million, while gold ETF experienced single-day outflows of $3 billion, forming a notable divergence. Despite ETF trading volume being lower than US equities, there remains significant room for institutional capital entry. Historically, Bitcoin has often rebounded following geopolitical turmoil.
GateNews30m ago
REQ Soars 21.77% — What Does This Mean for Traders?
Request Network (REQ) surged 21.77% within an hour, reaching $0.0839 amid growing trader interest. Market conditions, bullish sentiment, and DeFi trends may be driving this rally, while traders monitor key resistance and support levels for future movements.
Coinfomania1h ago