Trade
Basic
Futures
Futures
Hundreds of contracts settled in USDT or BTC
TradFi
Gold
Trade global traditional assets with USDT in one place
Options
Hot
Trade European-style vanilla options
Unified Account
Maximize your capital efficiency
Demo Trading
Futures Kickoff
Get prepared for your futures trading
Futures Events
Participate in events to win generous rewards
Demo Trading
Use virtual funds to experience risk-free trading
Earn
Launch
CandyDrop
Collect candies to earn airdrops
Launchpool
Quick staking, earn potential new tokens
HODLer Airdrop
Hold GT and get massive airdrops for free
Launchpad
Be early to the next big token project
Alpha Points
Trade on-chain assets and enjoy airdrop rewards!
Futures Points
Earn futures points and claim airdrop rewards
Investment
Simple Earn
Earn interests with idle tokens
Auto-Invest
Auto-invest on a regular basis
Dual Investment
Buy low and sell high to take profits from price fluctuations
Soft Staking
Earn rewards with flexible staking
Crypto Loan
0 Fees
Pledge one crypto to borrow another
Lending Center
One-stop lending hub
VIP Wealth Hub
Customized wealth management empowers your assets growth
Private Wealth Management
Customized asset management to grow your digital assets
Quant Fund
Top asset management team helps you profit without hassle
Staking
Stake cryptos to earn in PoS products
Smart Leverage
New
No forced liquidation before maturity, worry-free leveraged gains
GUSD Minting
Use USDT/USDC to mint GUSD for treasury-level yields
More
# 行情分析
881.94K
GateUser-93b660b8
10.9 Bitcoin & Ethereum Evening Market Analysis and Trading Strategies
Core Trend Analysis of BTC/USDT
· 4-hour level analysis: After the price hit the high of $124,000, the bullish momentum has significantly weakened, confirming the effective resistance of the upper Bollinger Band. The current K-line is showing a three consecutive bearish candlestick pattern retracing to the mid-band support, with weak short-term rebound momentum. The death cross formed at the high on the MACD indicator is still ongoing, and the green momentum bars continue to expand, reinforcing the bearish signal for the cu
- Reward
- like
- 1
- Repost
- Share
Pak_Wuuu:
wow, great strategyCredibility Analysis: Driven by the DTCC government bond tokenization pilot expectations, CC shows a clear decoupling trend from the broader market. After the "double halving," supply pressure sharply decreases, and prices continue to stay above multiple EMA lines.
Key Levels: Resistance: $0.18 (Recent high) / $0.20 Support: $0.14 (EMA cluster support) / $0.13
Trading Plan: Entry zone: $0.15 - 0.16, build positions in batches.
Take profit: First target $0.18; medium-term target $0.25.
Stop loss: $0.13.
Discipline: This asset is heavily influenced by policy news. If there is a delay in the DTCC
CC3.4%
- Reward
- 1
- Comment
- Repost
- Share
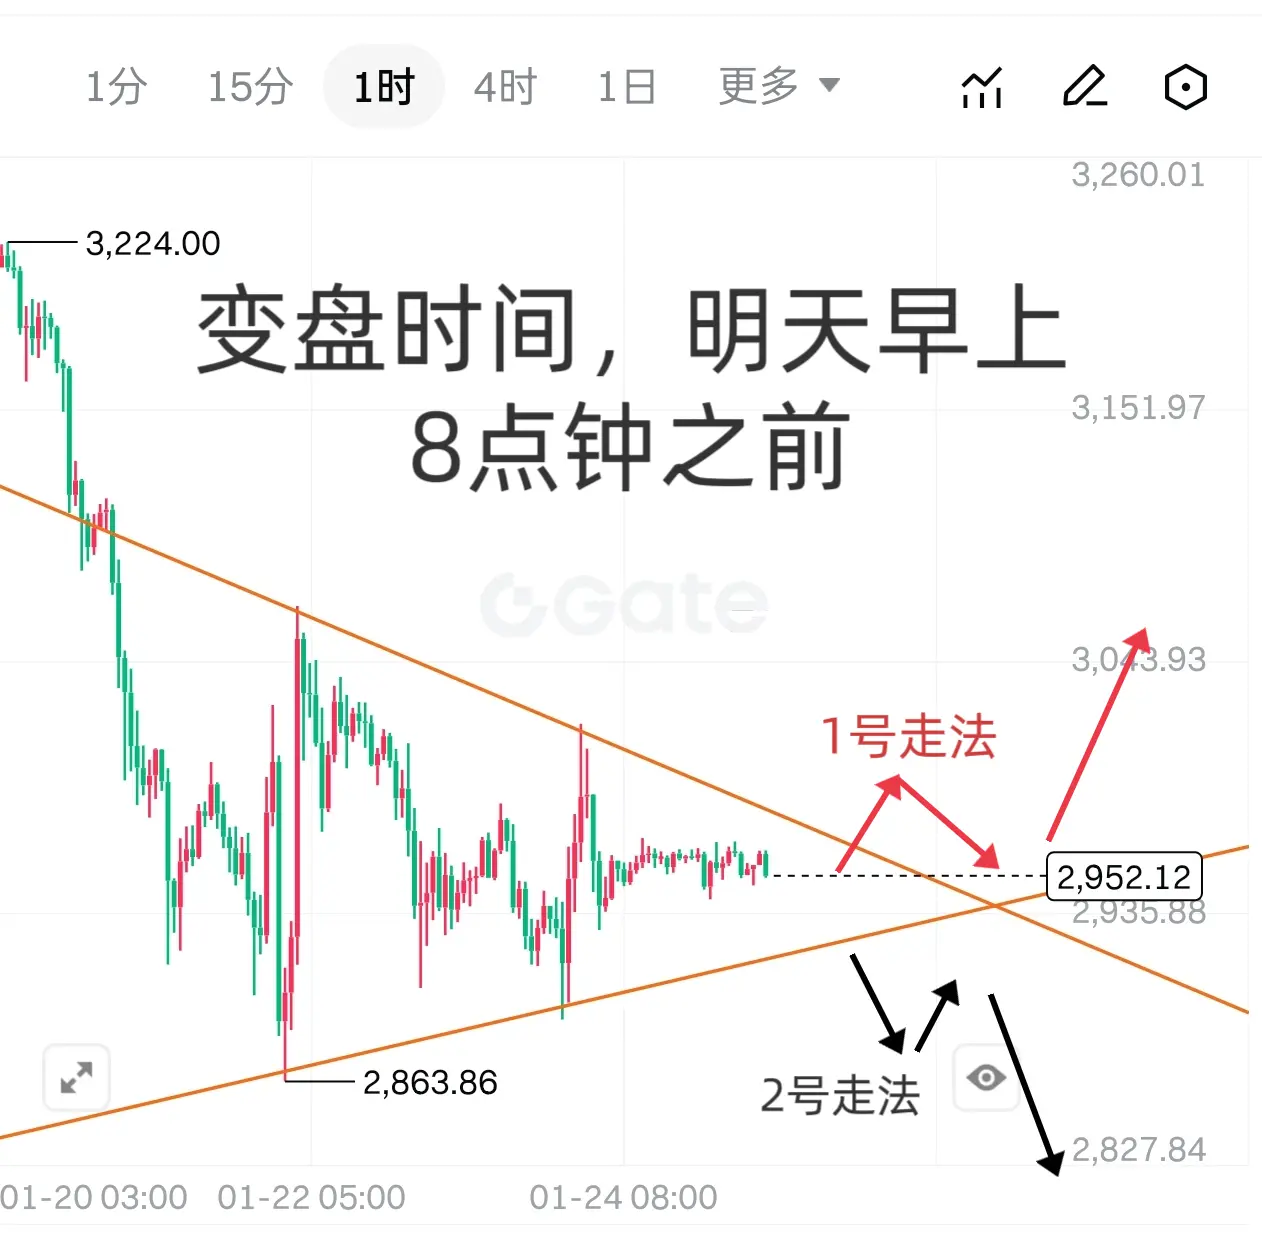
Bitcoin and Ethereum Reversal Countdown! Precise Levels + Candlestick Signals
Author: Trading Master
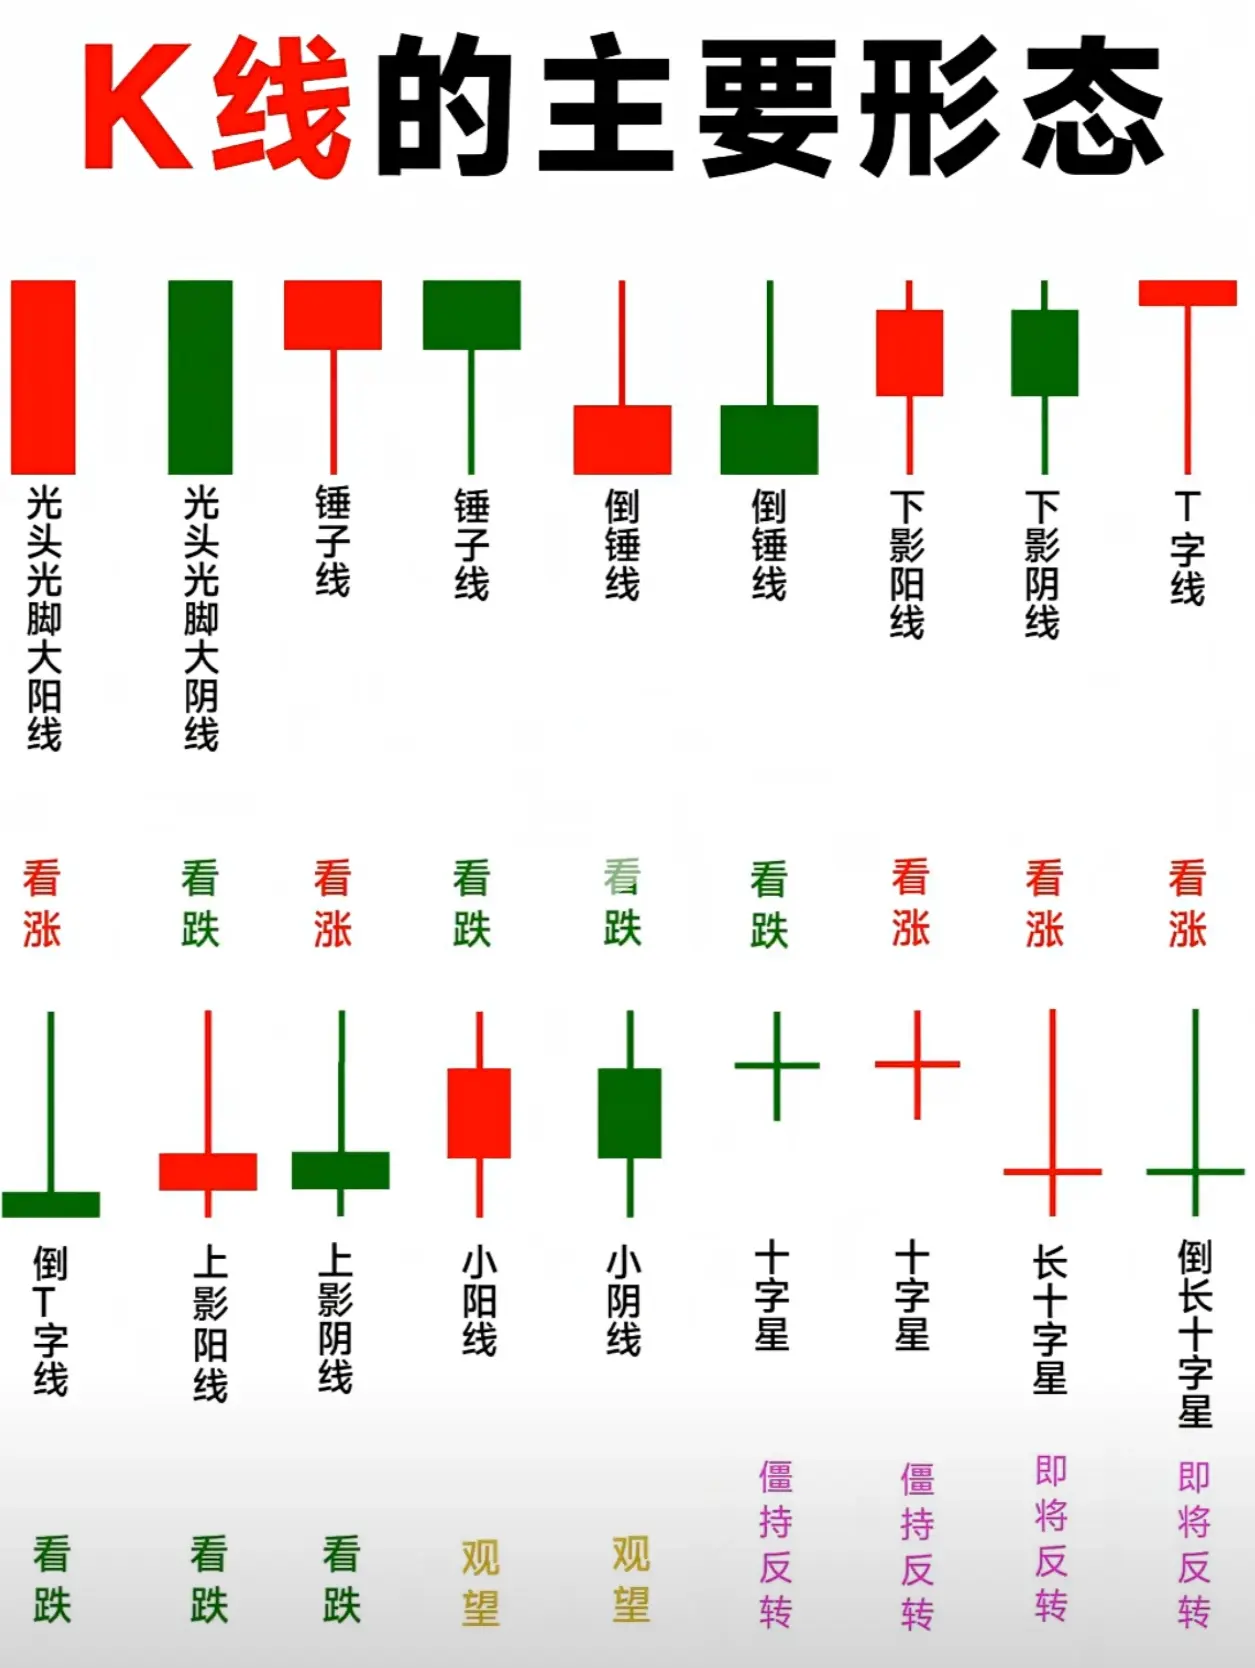
Bitcoin and Ethereum have been consolidating sideways for days, Bollinger Bands narrowing, trading volume continuously low. The bulls and bears are at a critical point, and a trend reversal is imminent! Focus precisely on the support below and resistance above, master two key candlestick patterns, and once the direction is clear, you can follow it accurately. Don’t be fooled by the main force’s manipulation to trap you at high and low points!
🔥BTC Precise Level: 88500 is the life and death lin
View OriginalAuthor: Trading Master
Bitcoin and Ethereum have been consolidating sideways for days, Bollinger Bands narrowing, trading volume continuously low. The bulls and bears are at a critical point, and a trend reversal is imminent! Focus precisely on the support below and resistance above, master two key candlestick patterns, and once the direction is clear, you can follow it accurately. Don’t be fooled by the main force’s manipulation to trap you at high and low points!
🔥BTC Precise Level: 88500 is the life and death lin
- Reward
- 2
- 2
- Repost
- Share
HeavenSlayerSupporter :
:
2026 Go Go Go 👊View More
BTC ETH Intraday Double V Reversal
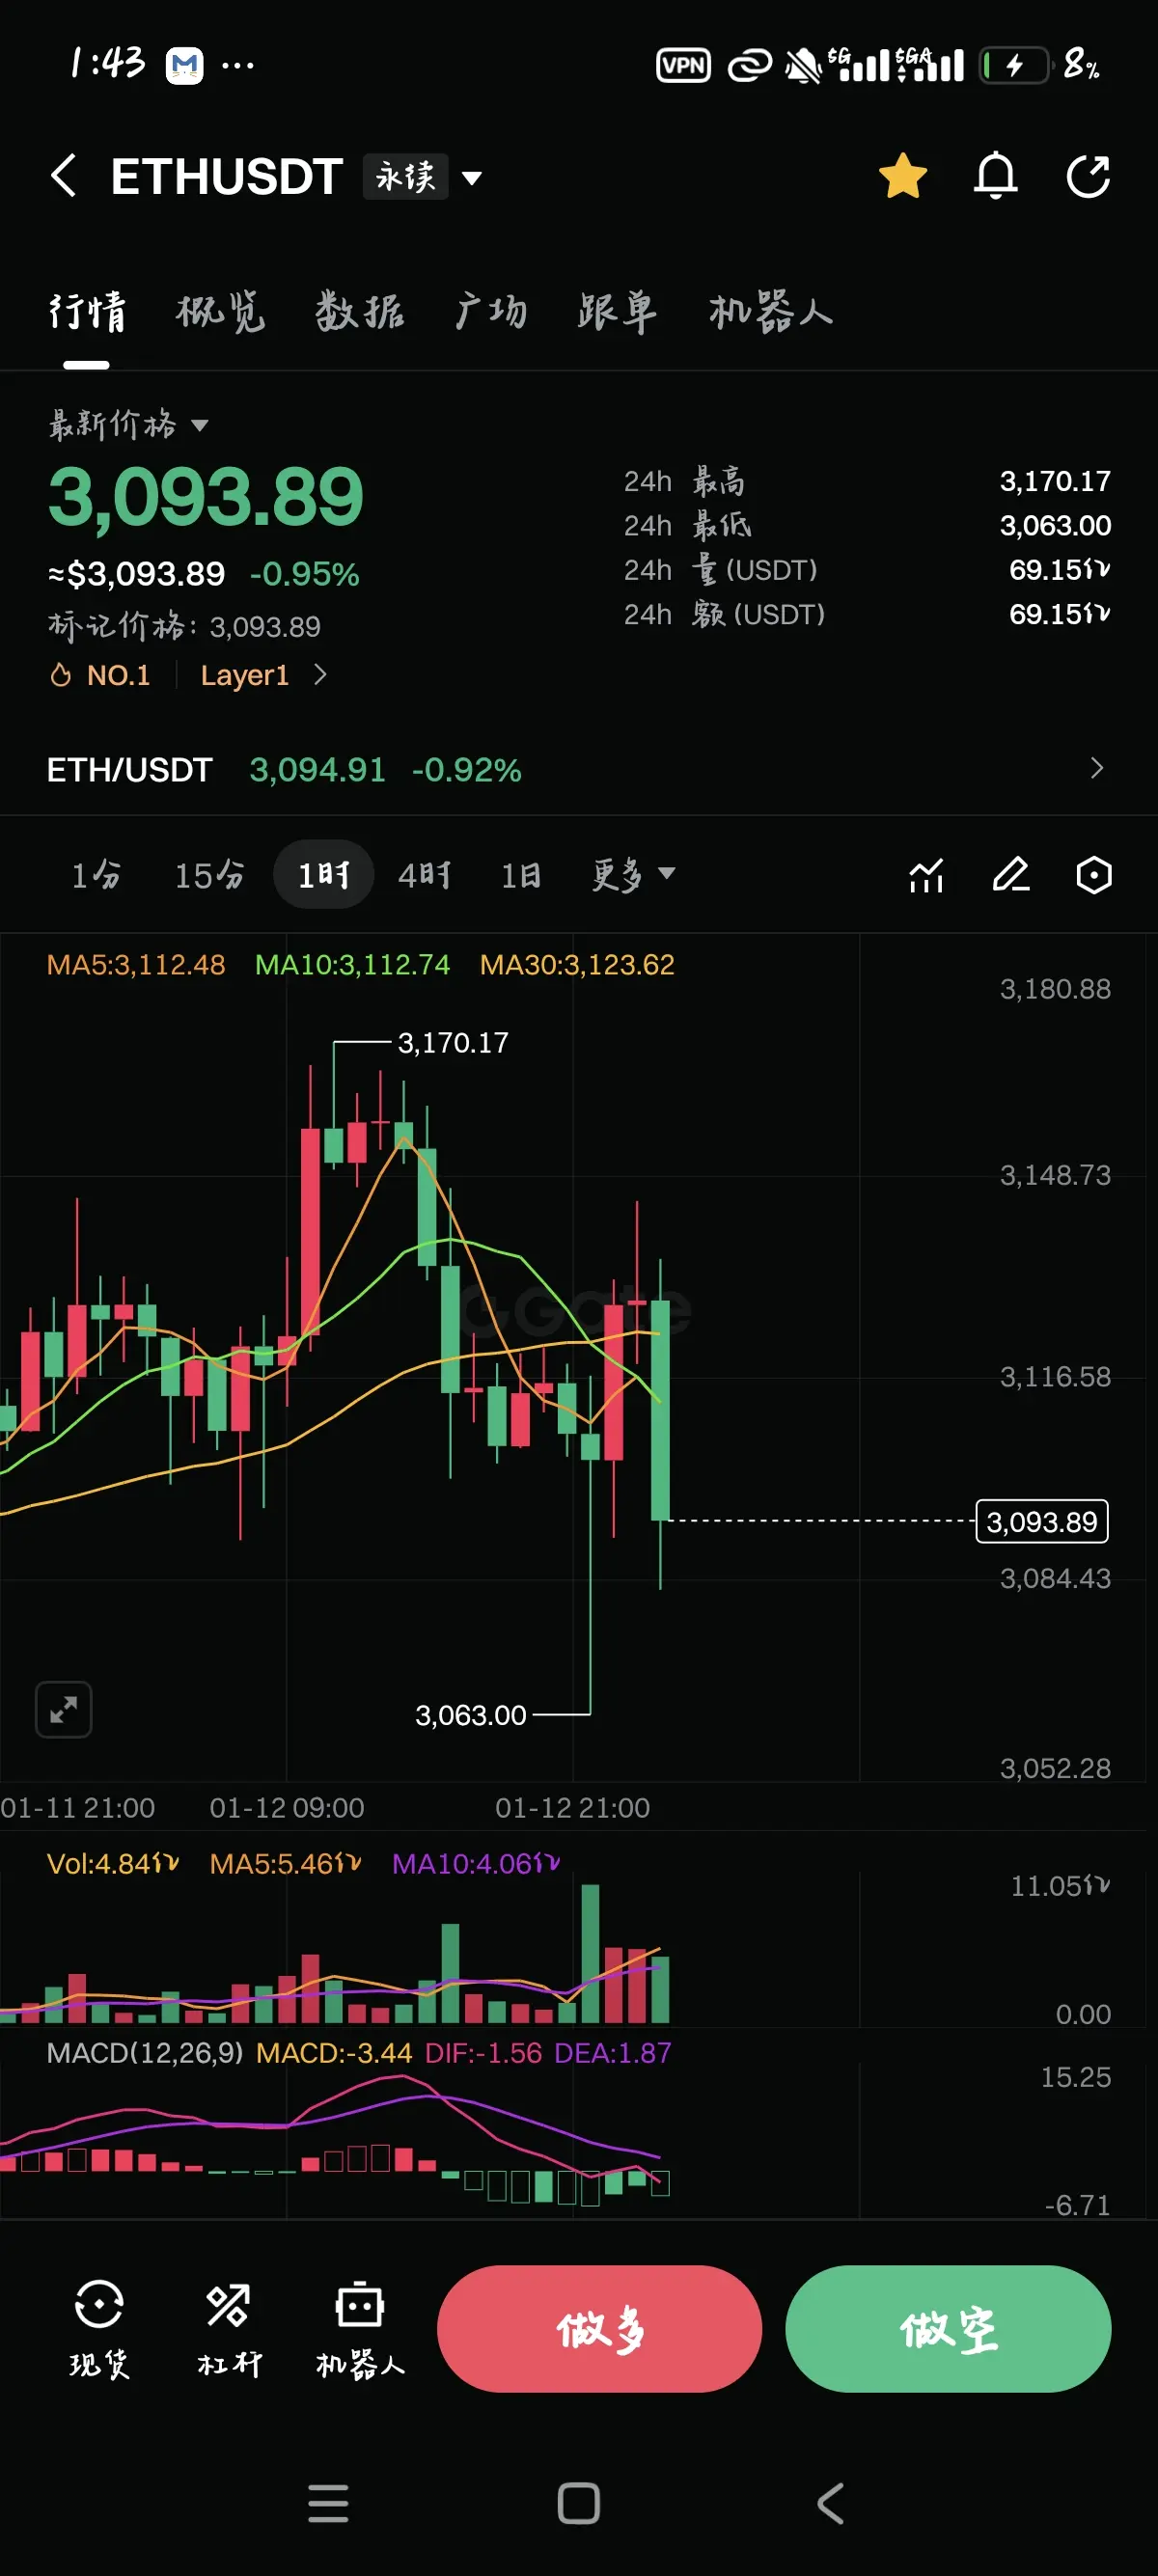
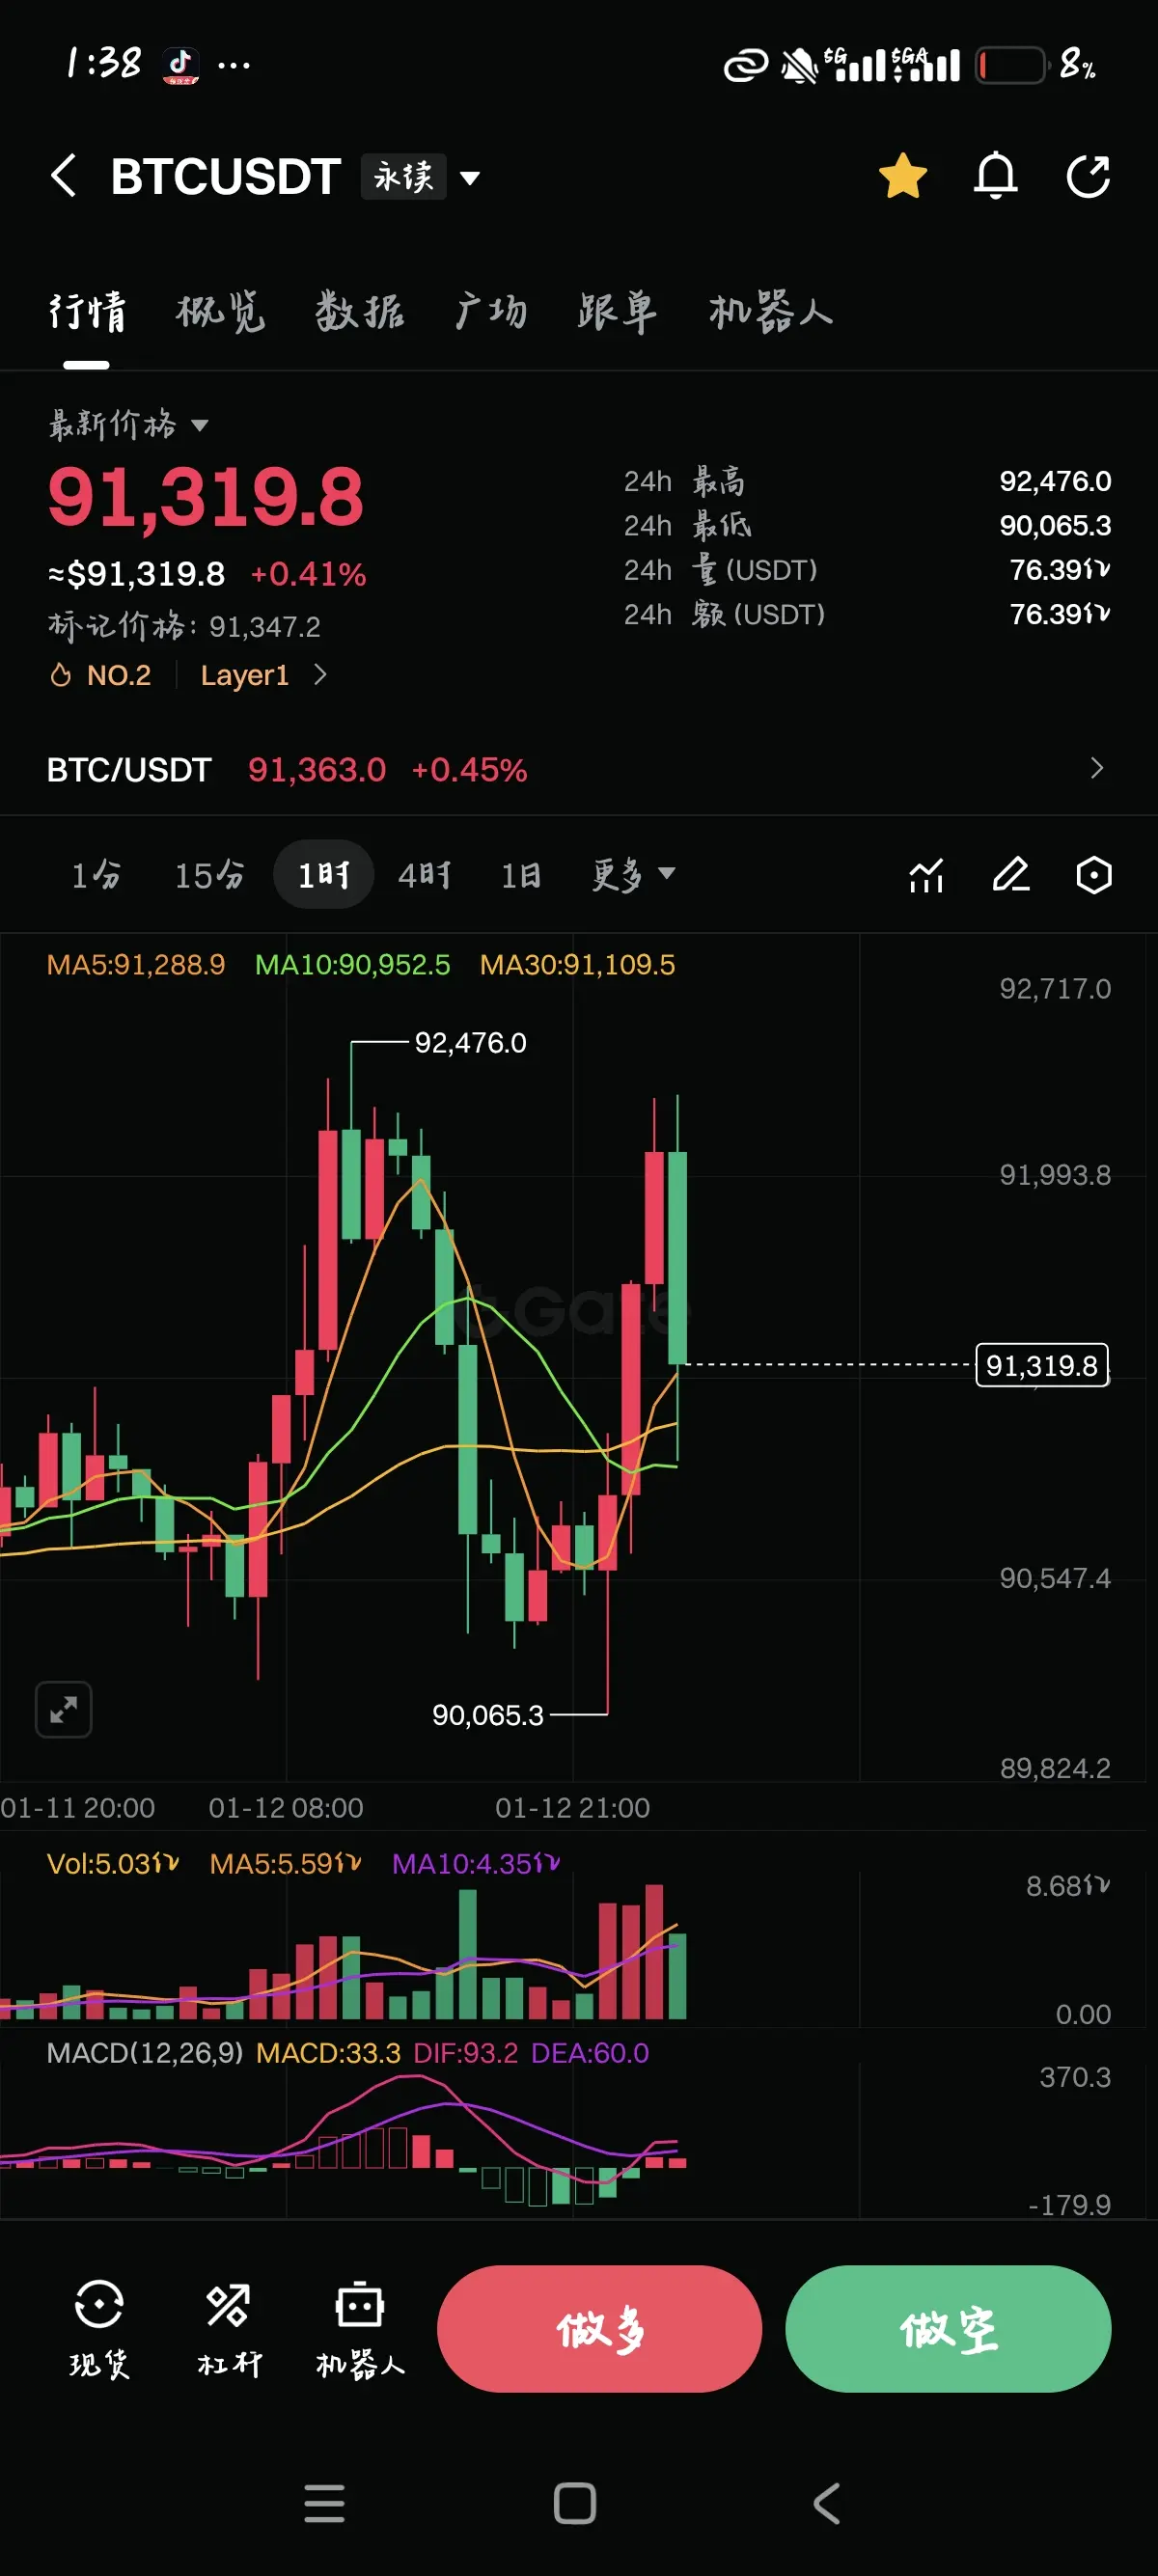
In the morning, BTC and ETH showed strong volume-driven upward movement, with BTC breaking through 92,500 and ETH surpassing 3,170. However, the momentum did not continue, and subsequently BTC retraced to the 90,000 level, while ETH fell back to the 3,090 mark.
Before the US stock market opened in the evening, ETH dipped sharply, and BTC and ETH rose again. However, after reaching resistance levels, they both declined again.
This reflects that the current market is mainly consolidating and clearing leverage through oscillations, still waiting for a clear dire
View OriginalIn the morning, BTC and ETH showed strong volume-driven upward movement, with BTC breaking through 92,500 and ETH surpassing 3,170. However, the momentum did not continue, and subsequently BTC retraced to the 90,000 level, while ETH fell back to the 3,090 mark.
Before the US stock market opened in the evening, ETH dipped sharply, and BTC and ETH rose again. However, after reaching resistance levels, they both declined again.
This reflects that the current market is mainly consolidating and clearing leverage through oscillations, still waiting for a clear dire
- Reward
- 1
- Comment
- Repost
- Share
ETH Weekend Market Brief: Bullish Rebound, Nearing the $3,200 Threshold?
Greetings to all comrades in the forum! Happy weekend! In this first weekend of the new year, Ethereum has shown remarkable resilience. After experiencing intense volatility in recent days, ETH is attempting to recover lost ground.
📊 Market Data Observation
• Current Price: Approximately $3,150 - $3,160.
• 24-Hour Change: About +1.5%, following Bitcoin (BTC) back up above $91,000.
• Bull-Bear Battle: Over $100 million in liquidations across the network in the past 24 hours, but ETH has successfully stabilized above the $
View OriginalGreetings to all comrades in the forum! Happy weekend! In this first weekend of the new year, Ethereum has shown remarkable resilience. After experiencing intense volatility in recent days, ETH is attempting to recover lost ground.
📊 Market Data Observation
• Current Price: Approximately $3,150 - $3,160.
• 24-Hour Change: About +1.5%, following Bitcoin (BTC) back up above $91,000.
• Bull-Bear Battle: Over $100 million in liquidations across the network in the past 24 hours, but ETH has successfully stabilized above the $
- Reward
- 1
- 1
- Repost
- Share
爆了再来 :
:
Just go for it💪12.28
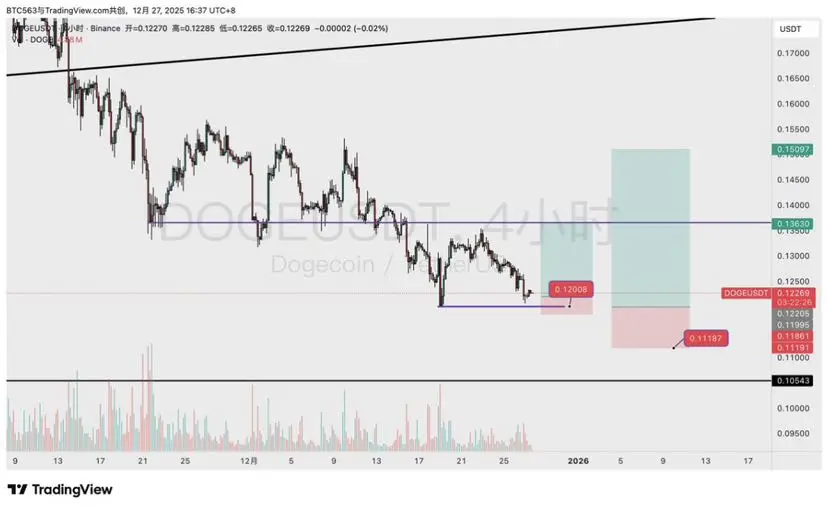
DOGE Short-term Trading Recommendation:
Entry range of 0.115-0.12 USDT, which is near the recent oscillation lower boundary, offering strong price attraction. Consider scaling into positions to average down the cost.
Strict risk control with a fixed 5% stop-loss, corresponding to a stop-loss price of approximately 0.109-0.114 USDT. If the price breaks through the stop-loss level, decisively exit to avoid additional losses from weakening market conditions.
Take-profit targets are set at 0.136 or when profits exceed 10%, which is approximately 0.1265-0.132$DOGE #行情分析
DOGE-3.99%
- Reward
- 1
- Comment
- Repost
- Share
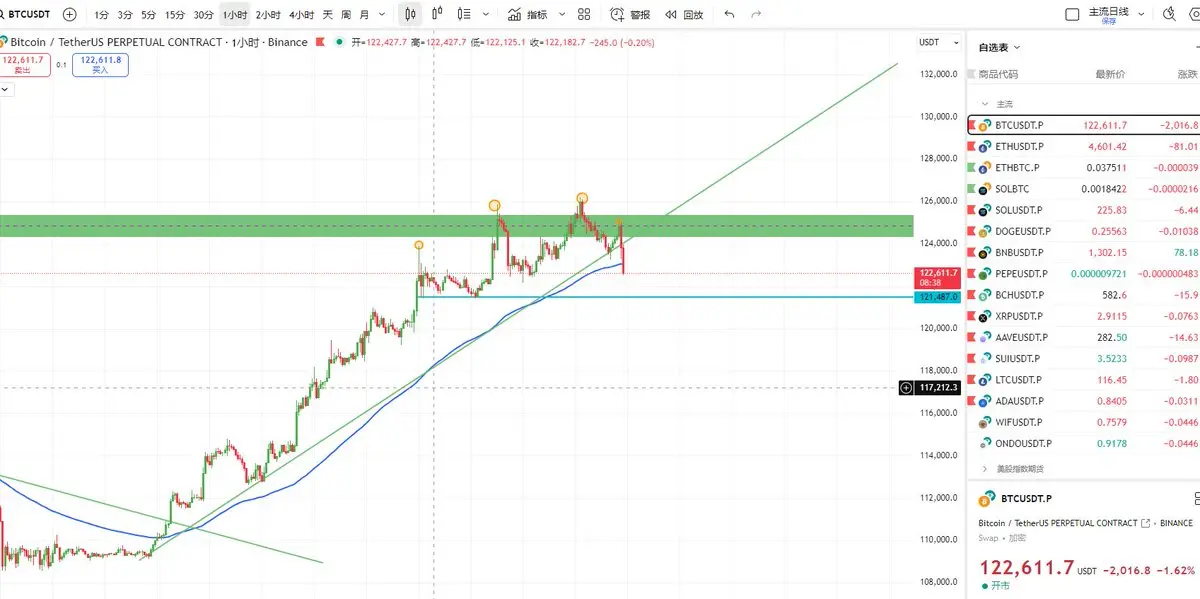
The short-term top Benny structure of BTC is evident, and the trend line has been broken ⚠️ A pullback may have already begun! BTC's recent surge has faced pressure again, forming a clear "three-top Benny structure."
The trend line has been broken, indicating that short-term momentum is starting to weaken.
The current position around 122,000 - 122,500 is a typical false breakout zone.
📊 My opinion:
Short-term bullish and bearish forces are switching.
The bullish rebound strength is decreasing, and the bears are starting to test.
The next focus should be on:
First support below: 121,200 –
BTC-4.07%
- Reward
- 3
- Comment
- Repost
- Share
🔮 10.7 Afternoon trading strategy share for ETH BTC
📉 Market Review
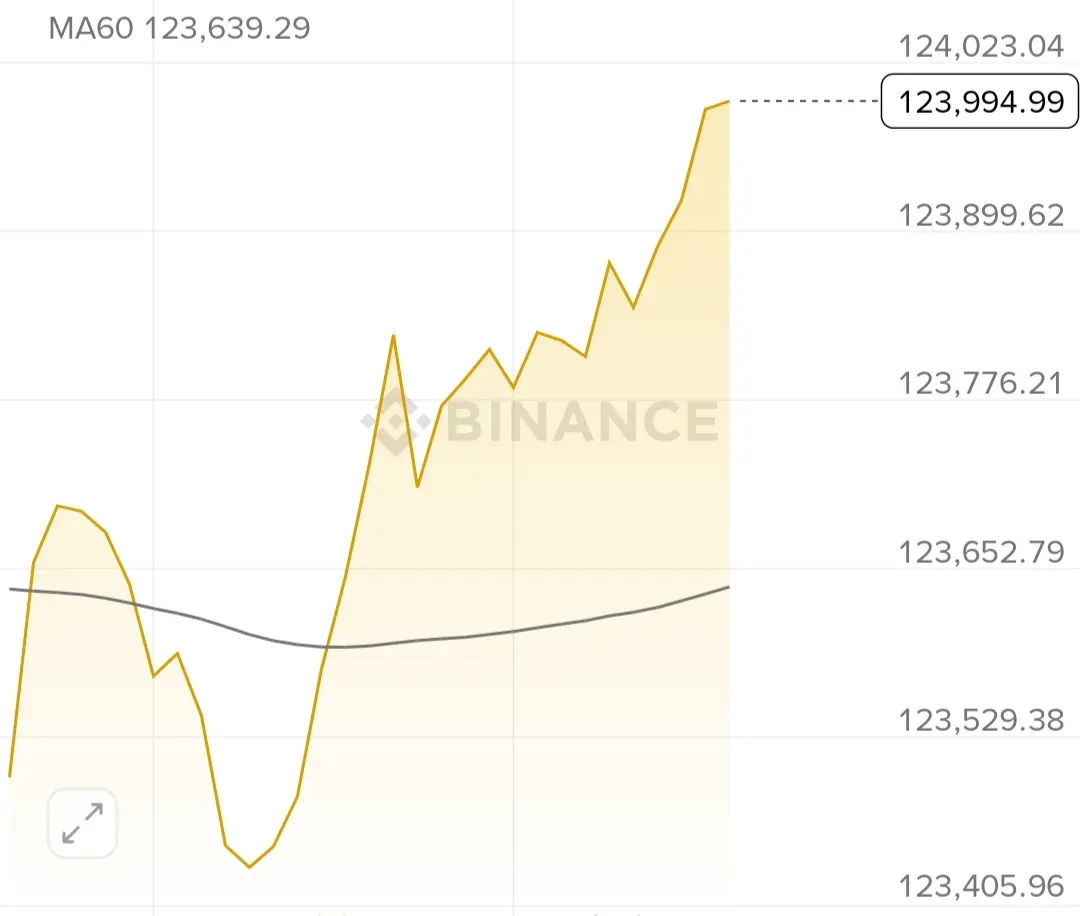
· BTC (BTC): From 126050, it has been oscillating downward, breaking below the 124000 level.
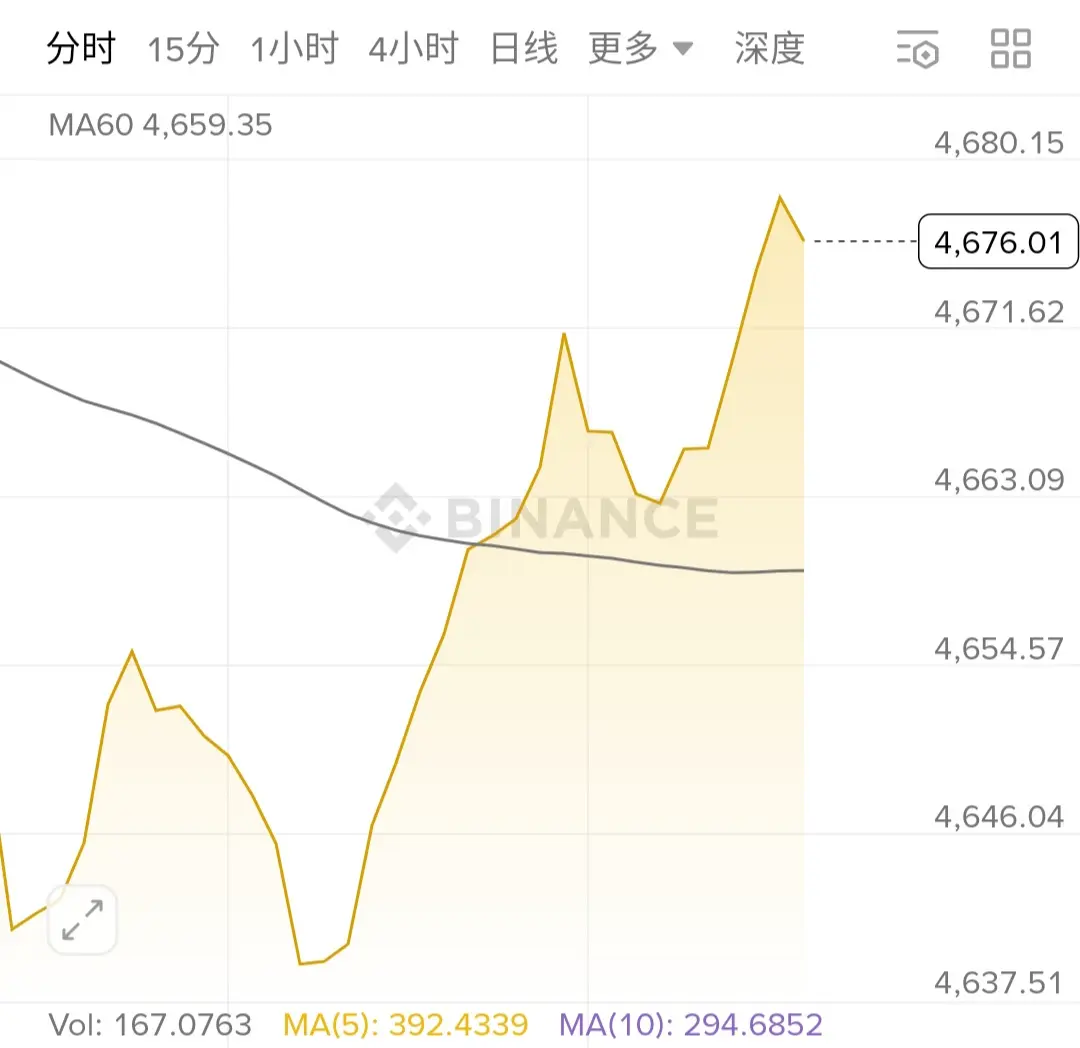
· ETH (ETH): The trend is relatively independent, rising from 4660 to 4726, and then pulling back.
👀 Market Insight
Currently, on the four-hour level, the overall trend of oscillating upward remains unchanged! The bulls are managing the rhythm very well, following a steady approach of "advance two, retreat one." Each pullback actually provides us with an opportunity to get on board.
💡 trading strategy (mainly low long)
· BTC
· En
View Original📉 Market Review
· BTC (BTC): From 126050, it has been oscillating downward, breaking below the 124000 level.
· ETH (ETH): The trend is relatively independent, rising from 4660 to 4726, and then pulling back.
👀 Market Insight
Currently, on the four-hour level, the overall trend of oscillating upward remains unchanged! The bulls are managing the rhythm very well, following a steady approach of "advance two, retreat one." Each pullback actually provides us with an opportunity to get on board.
💡 trading strategy (mainly low long)
· BTC
· En
- Reward
- 2
- 3
- Repost
- Share
IMAM_TRADER:
2025 GOGOGO 👊View More
9.28 BTC midday observation notes 📌
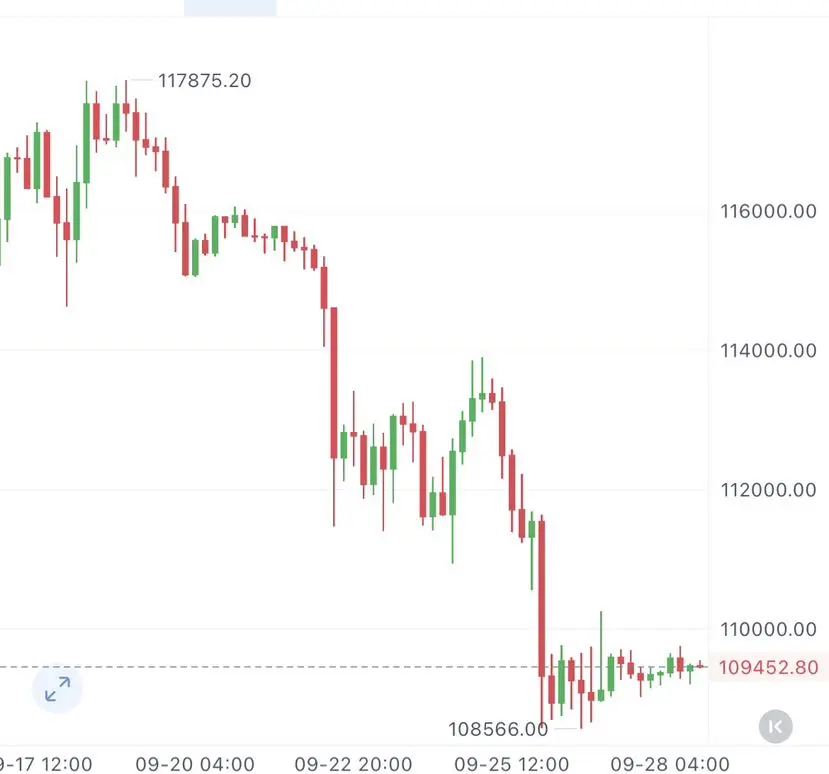
BTC has once again returned to the vicinity of 109.3k, and there has not yet been a true breakthrough. From an hourly perspective, after a rebound with three consecutive bullish candles, there have been two bearish candles retreating, and overall it is still fluctuating within the previous narrow range.
The current forces of bulls and bears are relatively balanced, and there are no obvious breakthrough signals in the short term.
If there is a rebound to the 109.5k-109.8k area during the day, you may consider paying attention to structural performance and ke
BTC-4.07%
- Reward
- like
- Comment
- Repost
- Share
10.9 Bitcoin & Ethereum Evening Market Analysis and Trading Strategies
Core Trend Analysis of BTC/USDT
· 4-hour level analysis: After the price hit the high of $124,000, the bullish momentum has significantly weakened, confirming the effective resistance of the upper Bollinger Band. The current K-line is showing a three consecutive bearish candlestick pattern retracing to the mid-band support, with weak short-term rebound momentum. The death cross formed at the high on the MACD indicator is still ongoing, and the green momentum bars continue to expand, reinforcing the bearish signal for the cu
View OriginalCore Trend Analysis of BTC/USDT
· 4-hour level analysis: After the price hit the high of $124,000, the bullish momentum has significantly weakened, confirming the effective resistance of the upper Bollinger Band. The current K-line is showing a three consecutive bearish candlestick pattern retracing to the mid-band support, with weak short-term rebound momentum. The death cross formed at the high on the MACD indicator is still ongoing, and the green momentum bars continue to expand, reinforcing the bearish signal for the cu
- Reward
- like
- 2
- Repost
- Share
LittleTao:
watching closely View More
Load More
Join 40M users in our growing community
⚡️ Join 40M users in the crypto craze discussion
💬 Engage with your favorite top creators
👍 See what interests you
Trending Topics
374.28K Popularity
2.07K Popularity
2.4K Popularity
1.18K Popularity
684 Popularity
959 Popularity
706 Popularity
1.46K Popularity
1.79K Popularity
23 Popularity
32.97K Popularity
67.38K Popularity
19.8K Popularity
25K Popularity
218.53K Popularity
News
View MoreSpot gold falls below $4450 per ounce, hitting a new low since January 8.
1 m
Leverage liquidations trigger a "deep squat" in metals, with the metal market awaiting a complete reshuffle of speculative positions
3 m
"Heavy long positions on precious metals" traders are once again building positions to buy the dip in gold, and related long orders were fully closed two days ago to take profits.
7 m
Trump's crypto company WLFI faces another storm: Warren calls for investigation into $500 million secret investment in the UAE
9 m
BTC Breaks Through 76,000 USDT
12 m
Pin