Trade
Basic
Futures
Futures
Hundreds of contracts settled in USDT or BTC
TradFi
Gold
Trade global traditional assets with USDT in one place
Options
Hot
Trade European-style vanilla options
Unified Account
Maximize your capital efficiency
Demo Trading
Futures Kickoff
Get prepared for your futures trading
Futures Events
Participate in events to win generous rewards
Demo Trading
Use virtual funds to experience risk-free trading
Earn
Launch
CandyDrop
Collect candies to earn airdrops
Launchpool
Quick staking, earn potential new tokens
HODLer Airdrop
Hold GT and get massive airdrops for free
Launchpad
Be early to the next big token project
Alpha Points
Trade on-chain assets and enjoy airdrop rewards!
Futures Points
Earn futures points and claim airdrop rewards
Investment
Simple Earn
Earn interests with idle tokens
Auto-Invest
Auto-invest on a regular basis
Dual Investment
Buy low and sell high to take profits from price fluctuations
Soft Staking
Earn rewards with flexible staking
Crypto Loan
0 Fees
Pledge one crypto to borrow another
Lending Center
One-stop lending hub
VIP Wealth Hub
Customized wealth management empowers your assets growth
Private Wealth Management
Customized asset management to grow your digital assets
Quant Fund
Top asset management team helps you profit without hassle
Staking
Stake cryptos to earn in PoS products
Smart Leverage
New
No forced liquidation before maturity, worry-free leveraged gains
GUSD Minting
Use USDT/USDC to mint GUSD for treasury-level yields
More
OctopusTreasureBrother
No content yet
OctopusTreasureBrother
On Saturday, it fluctuated back and forth within 2600. Brothers, don't trade on Saturday and Sunday. Rest well and don't be blinded by interest. Make sure to have your own trading system and plan, understand the essence of the market, organize your thoughts clearly before acting. Otherwise, you're just gambling😳
View Original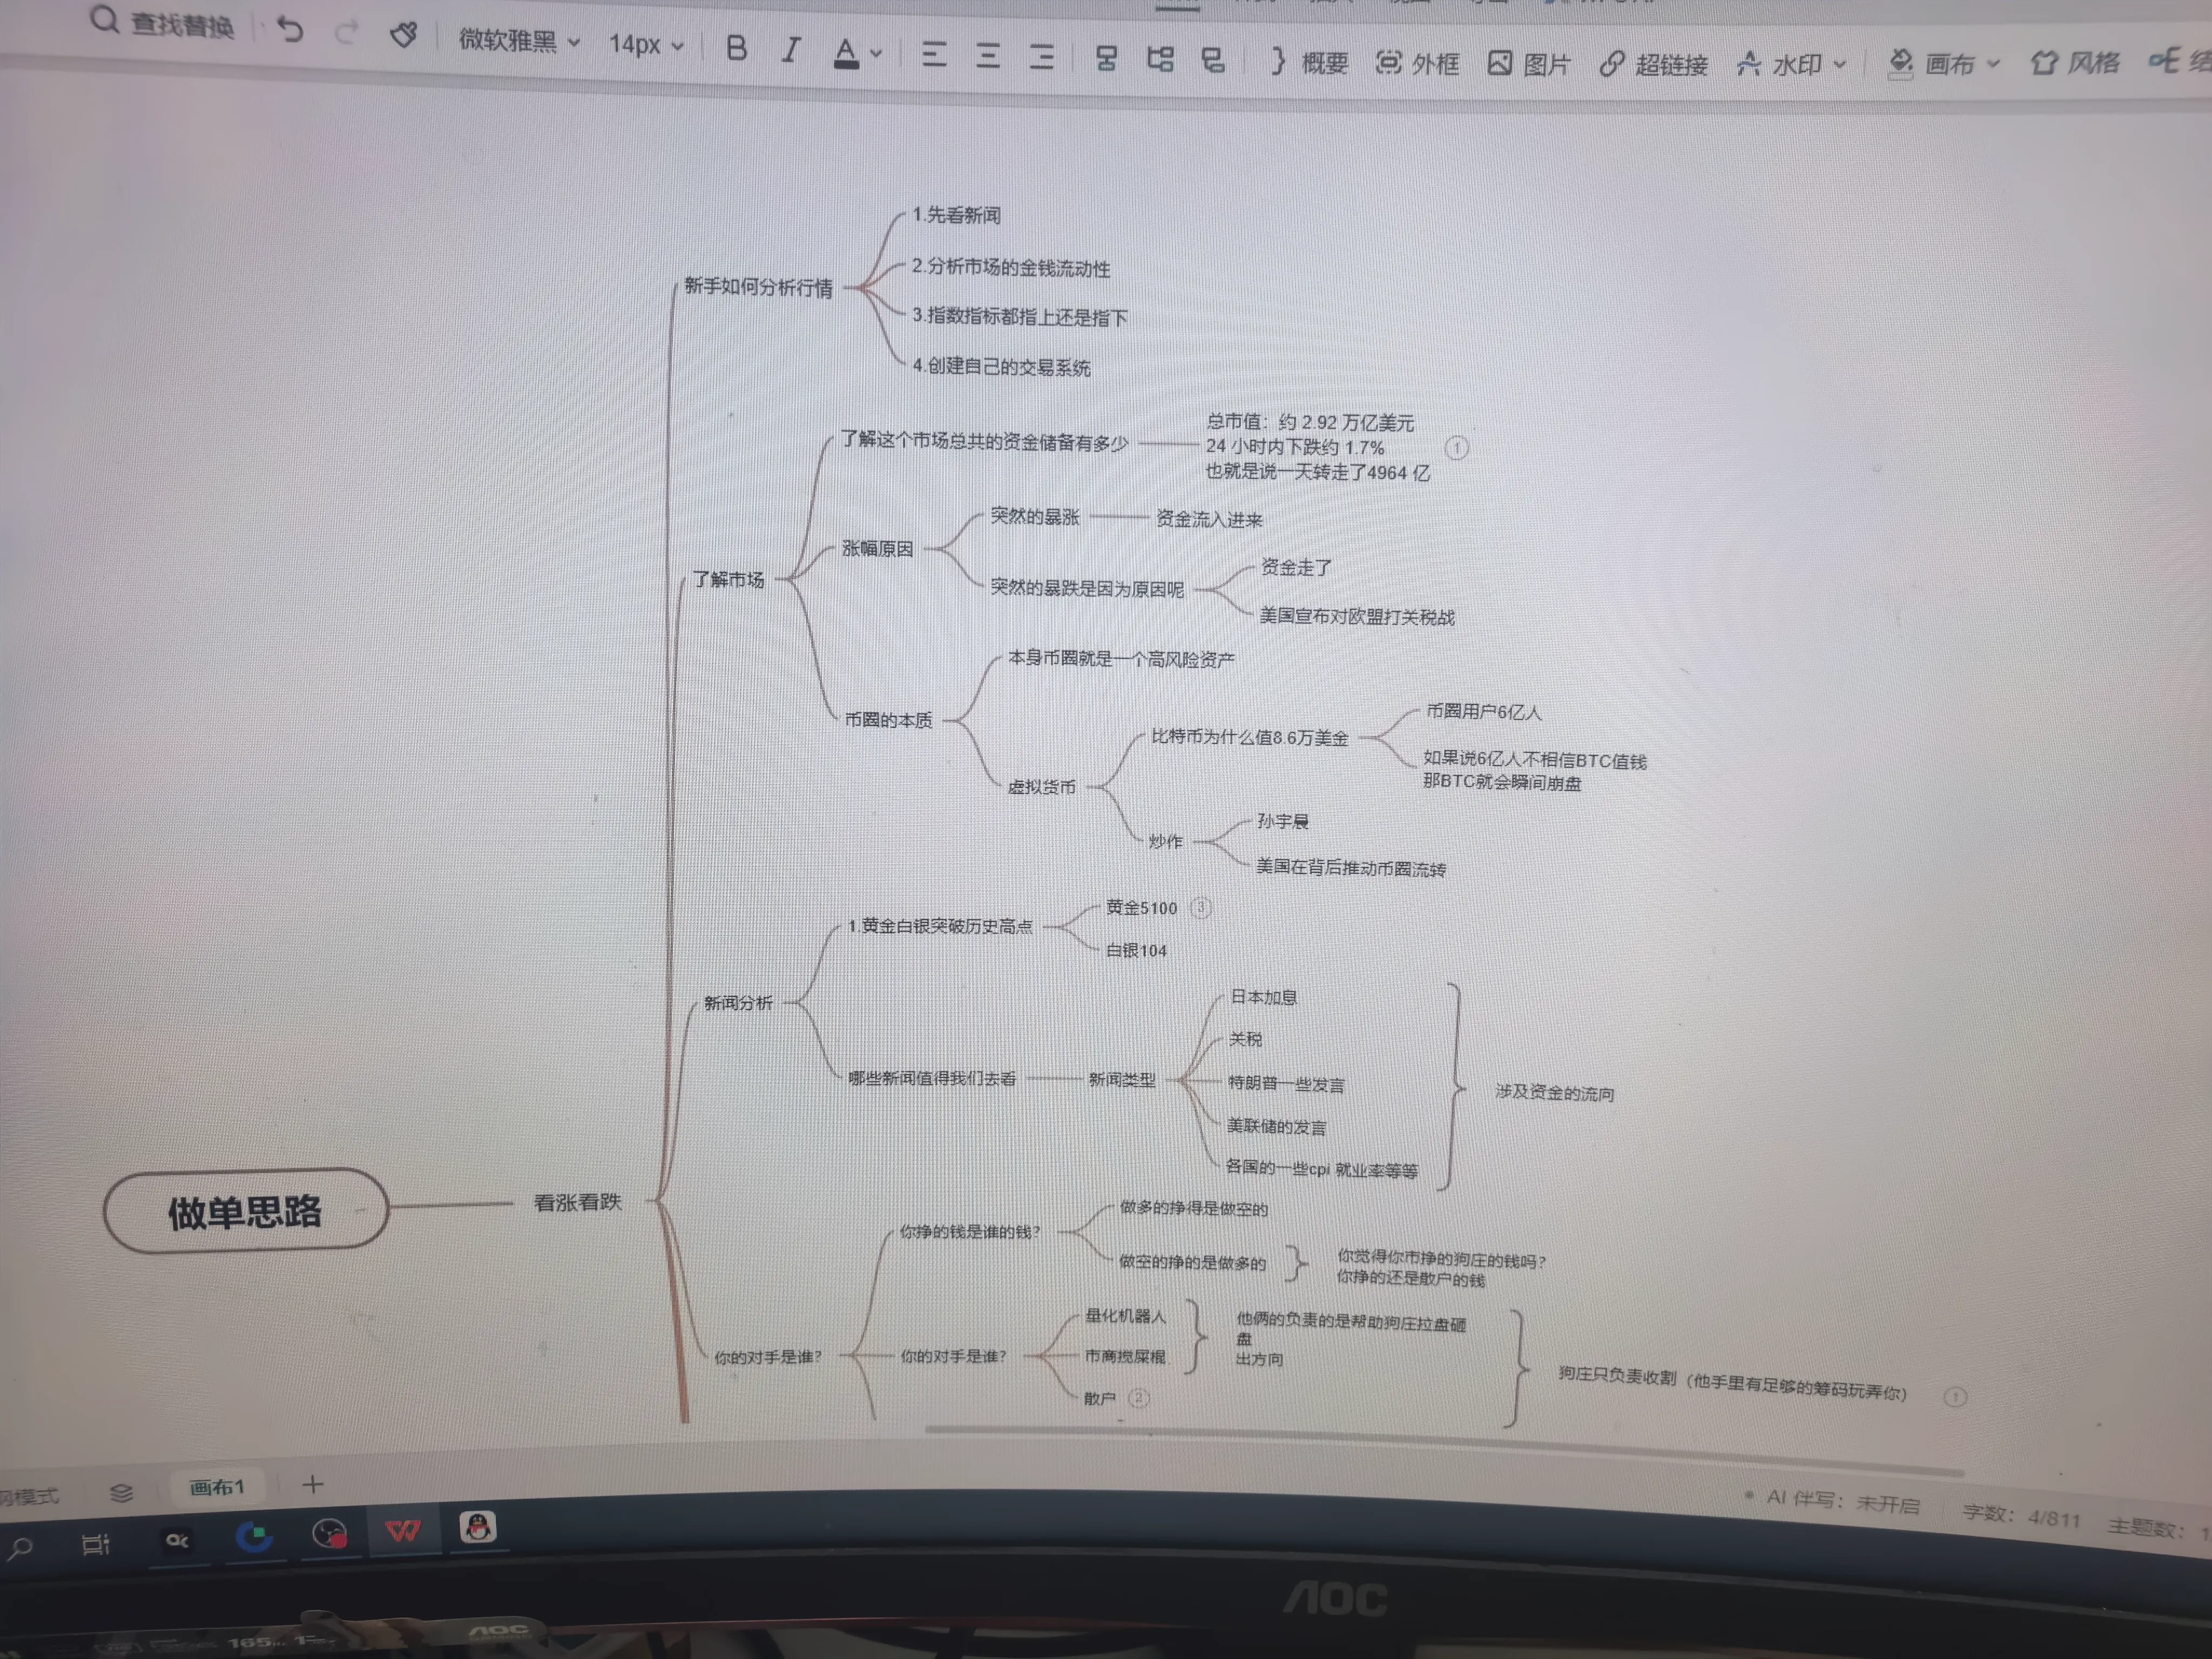
- Reward
- like
- Comment
- Repost
- Share
The device is having some issues, so the live broadcast will be delayed. Today is bearish; if it drops below 2750, see if it can break today's low. However, there will be a rebound around 2700. For Bitcoin, our lowest target is around 74,000 because the current mining cost is at 73,000.
BTC-2.13%
- Reward
- like
- Comment
- Repost
- Share
Red carpet scoop! Trump personally endorses the Federal Reserve Chair candidate, with a 96% probability pointing to him
The two final candidates selected by Trump this time are
* Kevin Wash: the only "familiar face" who has appeared on the candidate list across two terms
* Rick Reed: Chief Investment Officer of Global Fixed Income at BlackRock
* Kevin Wash: the only "familiar face" who has appeared on the candidate list across two terms
* Rick Reed: Chief Investment Officer of Global Fixed Income at BlackRock
- Reward
- like
- Comment
- Repost
- Share
Trading Currency: ETH
Operation Strategy: Short
Quantity: Based on your own position
Entry: 2758, small position with a 5-point fluctuation up and down
Take Profit Range: Self-defined take profit
Reasonable Hedging Range: No additional positions for now
Price Range: 2780-279
Position Management (based on funds): approaching a low-level sideways consolidation
#美联储利率维持不变 $ETH
ETH-7.22%
- Reward
- like
- 1
- Repost
- Share
OctopusTreasureBrother:
The point is 2780-2790
- Reward
- like
- Comment
- Repost
- Share
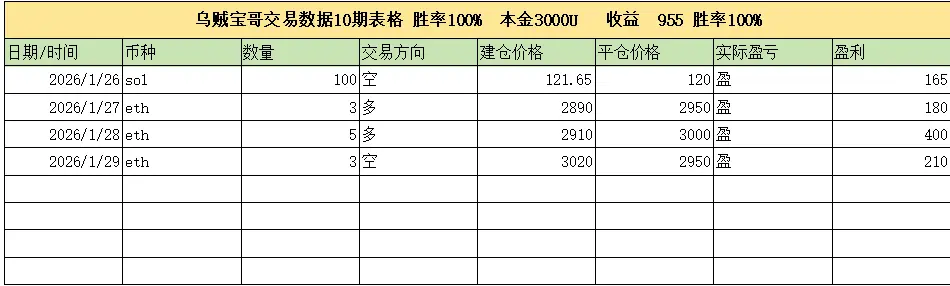
Cuttlefish Brother Strategy Issue 10, current win rate 100% profit
Time: 2026.1.19 Beijing Time 15:38
Trading currency: ETH
Operation strategy: Short
Entry point range: 3020
Take profit range: 2950
Reasonable hedging range: None at the moment
Position management (based on funds): 3000 USD
Stable profit, daily gains (Cuttlefish Brother Studio, only for stable profit)$ETH
ETH-7.22%
- Reward
- like
- Comment
- Repost
- Share
Can't take it anymore. There's no market movement at the open now. I bought at 2900, hoping to break through 2945. If it doesn't break, I'll take profit. If it breaks, aiming for 3000 to lock in 50-100 points profit is very good. Money in the pocket is real money. Also, the monthly chart is about to close with a bullish candle in the next couple of days, probably around 3150-3200. If I were me, I would place a short order at 3150 with a stop loss at 2820, and then go long again. 😊#美联储降息 $ETH $BTC $SOL
View Original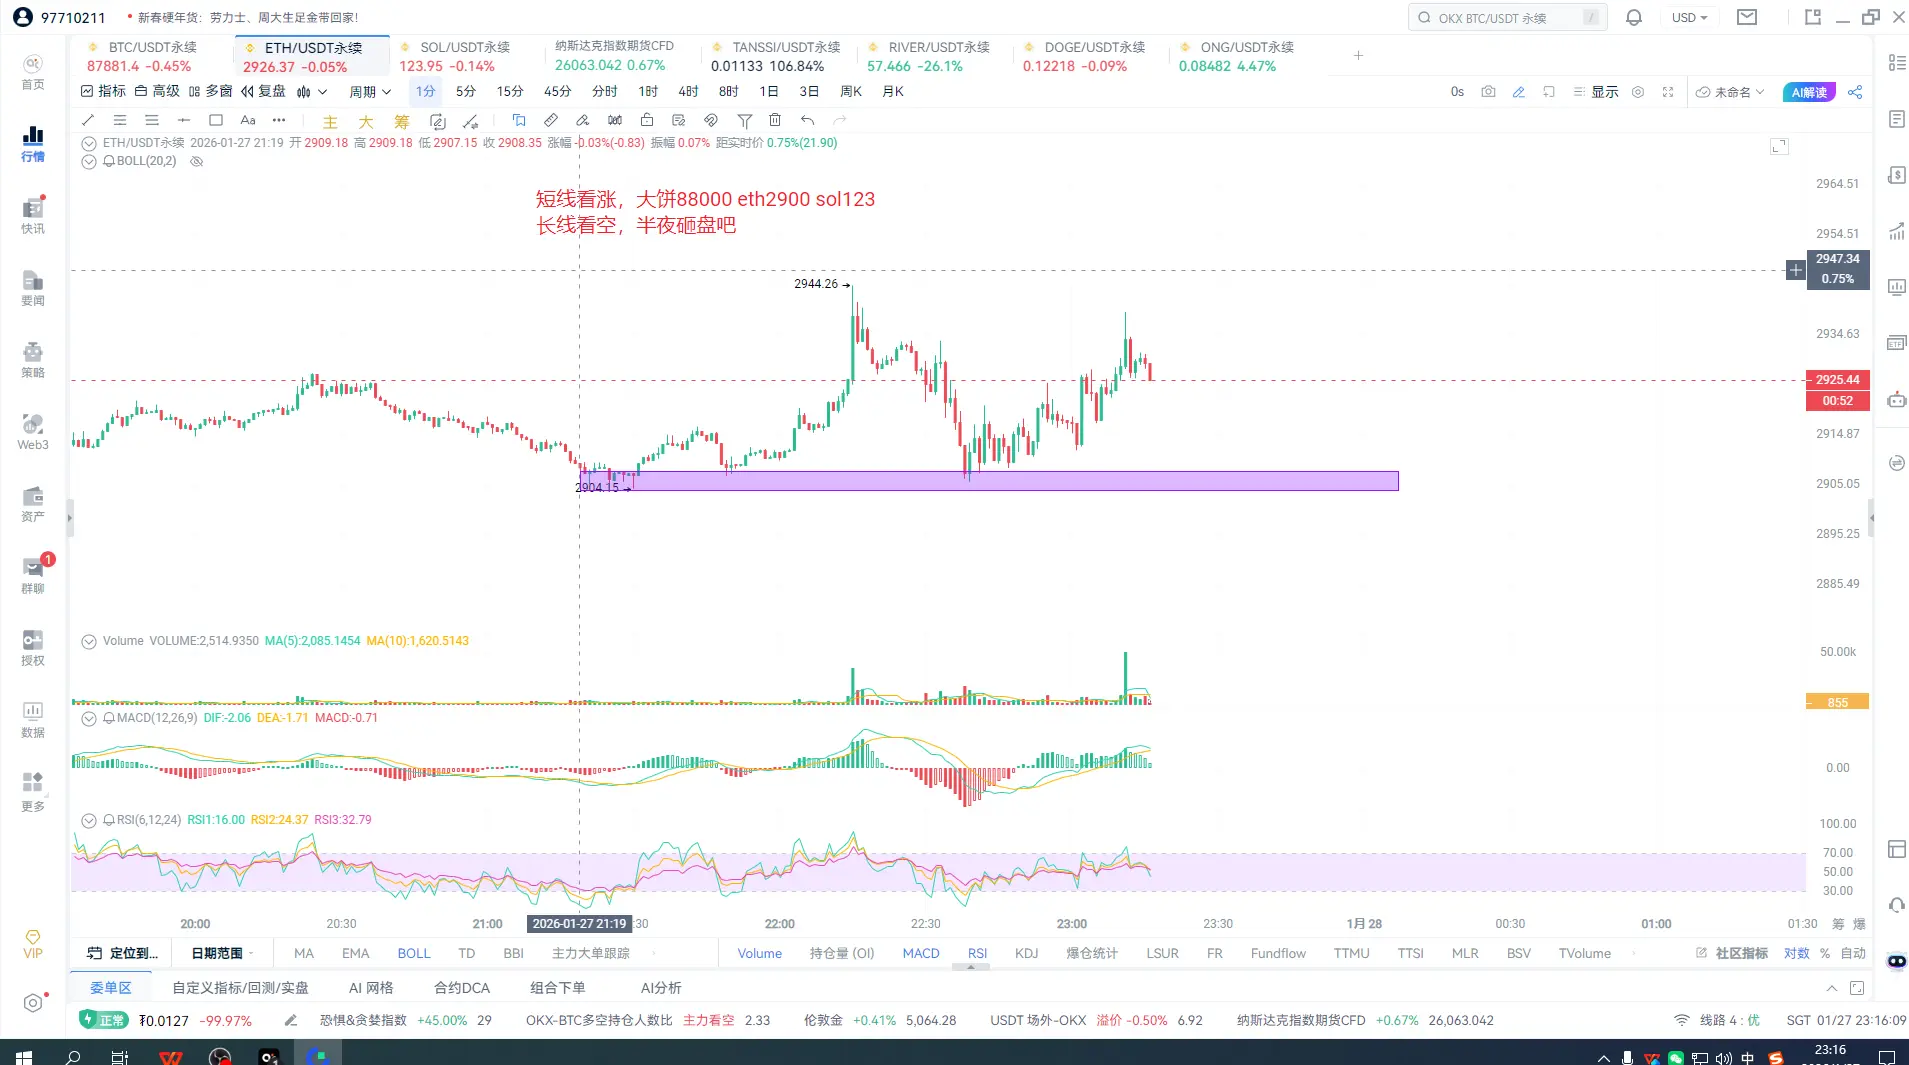
- Reward
- 1
- Comment
- Repost
- Share
- Reward
- like
- Comment
- Repost
- Share
ETH Market Analysis
January 27, 2025, 10:00 AM ETH Today Market Analysis
As of 10 PM, the candlestick chart shows a downward correction trend.
Price is trading around 2935, with the Bollinger Bands three lines parallel, near 2920, 3010, and 2830.
Short-term MA lines MA5 and MA10 are forming a golden cross and trending upward, with the gap widening.
MACD indicator: The MACD lines are below the zero line, forming a golden cross and trending upward, indicating bullish momentum is building.
RSI indicator: RSI14 is around 50, indicating a normal trading phase.
Resistance levels: 2965, 3025, 3080
Su
ETH-7.22%

- Reward
- 2
- Comment
- 1
- Share
BTC Market Analysis
I. Technical Analysis
1. Bollinger Bands (4-hour): The three lines are opening downward, with the current price rebounding after breaking below the lower band. Upper band: 90885, Middle band: 88964, Lower band: 87038. Overall maintaining a oscillating upward trend.
2. MA Moving Averages (4-hour): Short-term moving average is showing a death cross downward, with MA5 and MA10 at 87557 and 88304 respectively. The current price is above MA5.
3. MACD Indicator (4-hour): The two lines are below the zero axis with a death cross parallel trend, indicating weakening bearish momentum
BTC-2.13%
- Reward
- 2
- Comment
- 2
- Share
January 26, 2025 10:00 ETH Market Analysis Today
As of 10:00 PM, the candlestick chart shows a pin bar oscillation pattern with minimal fluctuations.
The price is trading around 2880, with the Bollinger Bands widening. The three lines are near 2930, 3020, and 2845.
In the short term, the MA5 and MA10 moving averages have a death cross and are trending downward, with the gap widening.
MACD indicator: The MACD lines are below the zero line, crossing and moving parallel downward, indicating increasing bearish momentum.
RSI indicator: RSI14 is around 37, approaching the oversold zone.
Resistance l
ETH-7.22%
- Reward
- 1
- Comment
- 1
- Share
BTC Market Analysis
1. Bollinger Bands (4 hours): The three lines are narrowing and leveling out, with the current price near the middle band. Upper band 90464, middle band 89534, lower band 88604. Overall, the market remains in a sideways consolidation pattern.
2. MA Moving Averages (4 hours): Short-term moving averages are crossing bullish, with MA5 and MA10 at 89576 and 89546 respectively. The current price is below the short-term moving averages.
3. MACD Indicator (4 hours): The dual lines are above the zero axis with a golden cross and an upward parallel trend, but bullish momentum is wea
BTC-2.13%
- Reward
- 1
- Comment
- Repost
- Share
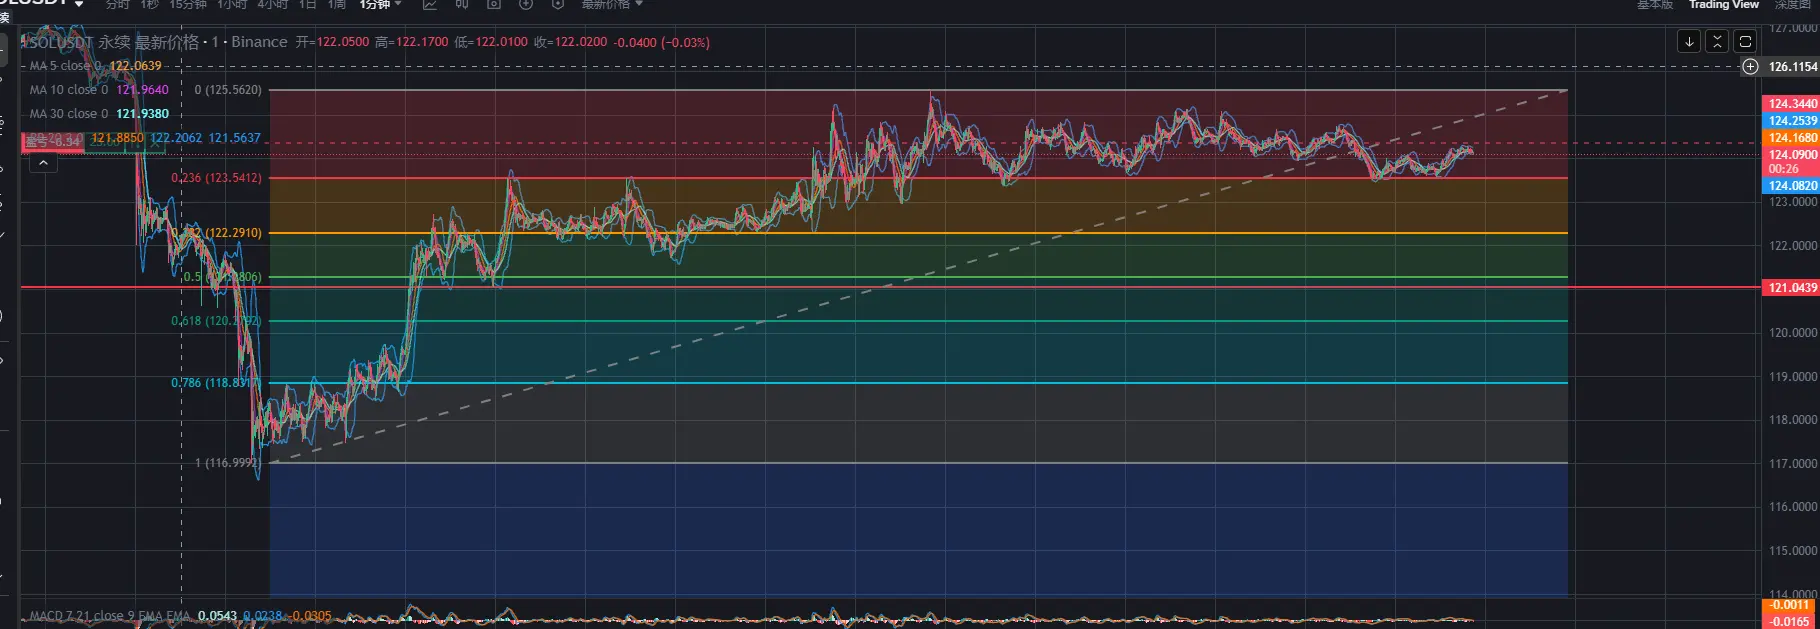
SOL Market Analysis
As of 10 PM, the candlestick chart shows a rebound after a sharp decline.
The price is trading around 127, with the Bollinger Bands widening, and the three lines near 128, 131, and 125.
Short-term MA: MA5 and MA10 are in a death cross downward.
MACD Indicator: The MACD lines are below the zero line, with a golden cross and parallel upward movement, indicating increasing bullish momentum.
RSI Indicator: RSI14 is around 39, approaching oversold territory.
Resistance levels: 130, 133
Support levels: 125, 123
Long-term buy strategy: The trigger signal suggests that the 125 supp
SOL-2.87%
- Reward
- 1
- Comment
- Repost
- Share
ETH Market Analysis January 24, 2025, 10:00
As of 10 PM, the candlestick chart shows a pin bar oscillation with little fluctuation.
The price is around 2950, with the Bollinger Bands narrowing, and the three lines near 2970, 3030, and 2900.
In the short term, the MA5 and MA10 moving averages have crossed, forming two silver ingot shapes, then moving parallel.
MACD indicator: The MACD double lines are below the zero line, crossing and moving upward after parallelism, indicating bullish momentum is building.
RSI indicator: RSI14 is around 37, approaching the oversold stage.
Resistance levels: 30
ETH-7.22%
- Reward
- 1
- Comment
- 1
- Share