Trade
Basic
Futures
Futures
Hundreds of contracts settled in USDT or BTC
TradFi
Gold
Trade global traditional assets with USDT in one place
Options
Hot
Trade European-style vanilla options
Unified Account
Maximize your capital efficiency
Demo Trading
Futures Kickoff
Get prepared for your futures trading
Futures Events
Participate in events to win generous rewards
Demo Trading
Use virtual funds to experience risk-free trading
Earn
Launch
CandyDrop
Collect candies to earn airdrops
Launchpool
Quick staking, earn potential new tokens
HODLer Airdrop
Hold GT and get massive airdrops for free
Launchpad
Be early to the next big token project
Alpha Points
Trade on-chain assets and enjoy airdrop rewards!
Futures Points
Earn futures points and claim airdrop rewards
Investment
Simple Earn
Earn interests with idle tokens
Auto-Invest
Auto-invest on a regular basis
Dual Investment
Buy low and sell high to take profits from price fluctuations
Soft Staking
Earn rewards with flexible staking
Crypto Loan
0 Fees
Pledge one crypto to borrow another
Lending Center
One-stop lending hub
VIP Wealth Hub
Customized wealth management empowers your assets growth
Private Wealth Management
Customized asset management to grow your digital assets
Quant Fund
Top asset management team helps you profit without hassle
Staking
Stake cryptos to earn in PoS products
Smart Leverage
New
No forced liquidation before maturity, worry-free leveraged gains
GUSD Minting
Use USDT/USDC to mint GUSD for treasury-level yields
More
Brother-in-law,BeHappy!
Live streaming during the day every day, with irregular sessions at night.

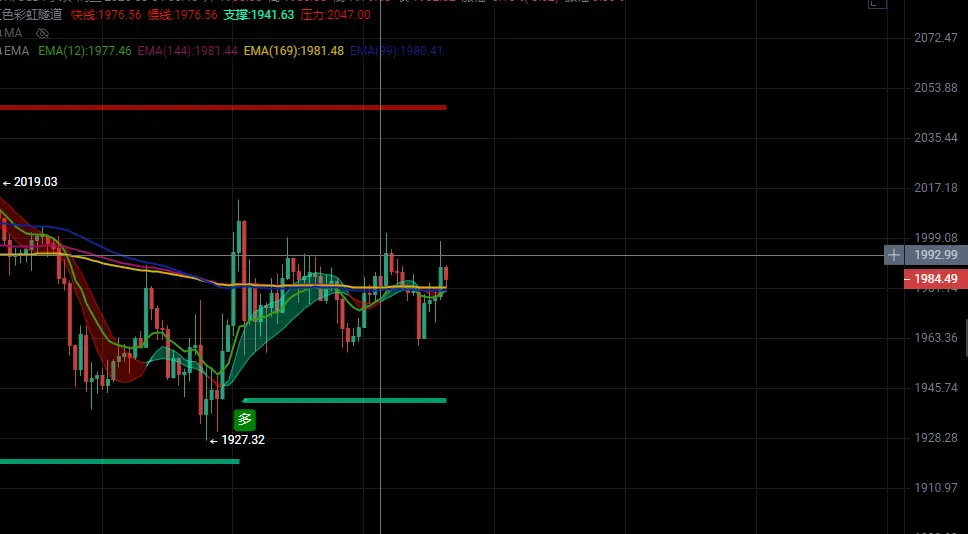
Buy Point 1: 1960 USDT (Integer support level + double bottom formed by the previous low at 1957.42)
Buy Point 2: 1945 USDT (EMA120 weekly support below 1973 by 1.5%, meeting the spacing requirement)
Long entry stop-loss: 1930 USDT (Trend reversal confirmed after breaking the February 26 swing low at 1926.32)
Sell Point 1: 2015 USDT (Integer resistance + previous high resistance at the March 4 high of 2019.26)
Sell Point 2: 2035 USDT (Daily EMA30 below 2106 by 3%, close to the February 25 rebound high of 2041)
Short entry stop-loss: 2050 USDT (Break above the 2035-2041 consolidation zone upp
View OriginalBuy Point 2: 1945 USDT (EMA120 weekly support below 1973 by 1.5%, meeting the spacing requirement)
Long entry stop-loss: 1930 USDT (Trend reversal confirmed after breaking the February 26 swing low at 1926.32)
Sell Point 1: 2015 USDT (Integer resistance + previous high resistance at the March 4 high of 2019.26)
Sell Point 2: 2035 USDT (Daily EMA30 below 2106 by 3%, close to the February 25 rebound high of 2041)
Short entry stop-loss: 2050 USDT (Break above the 2035-2041 consolidation zone upp
- Reward
- 3
- Comment
- Repost
- Share
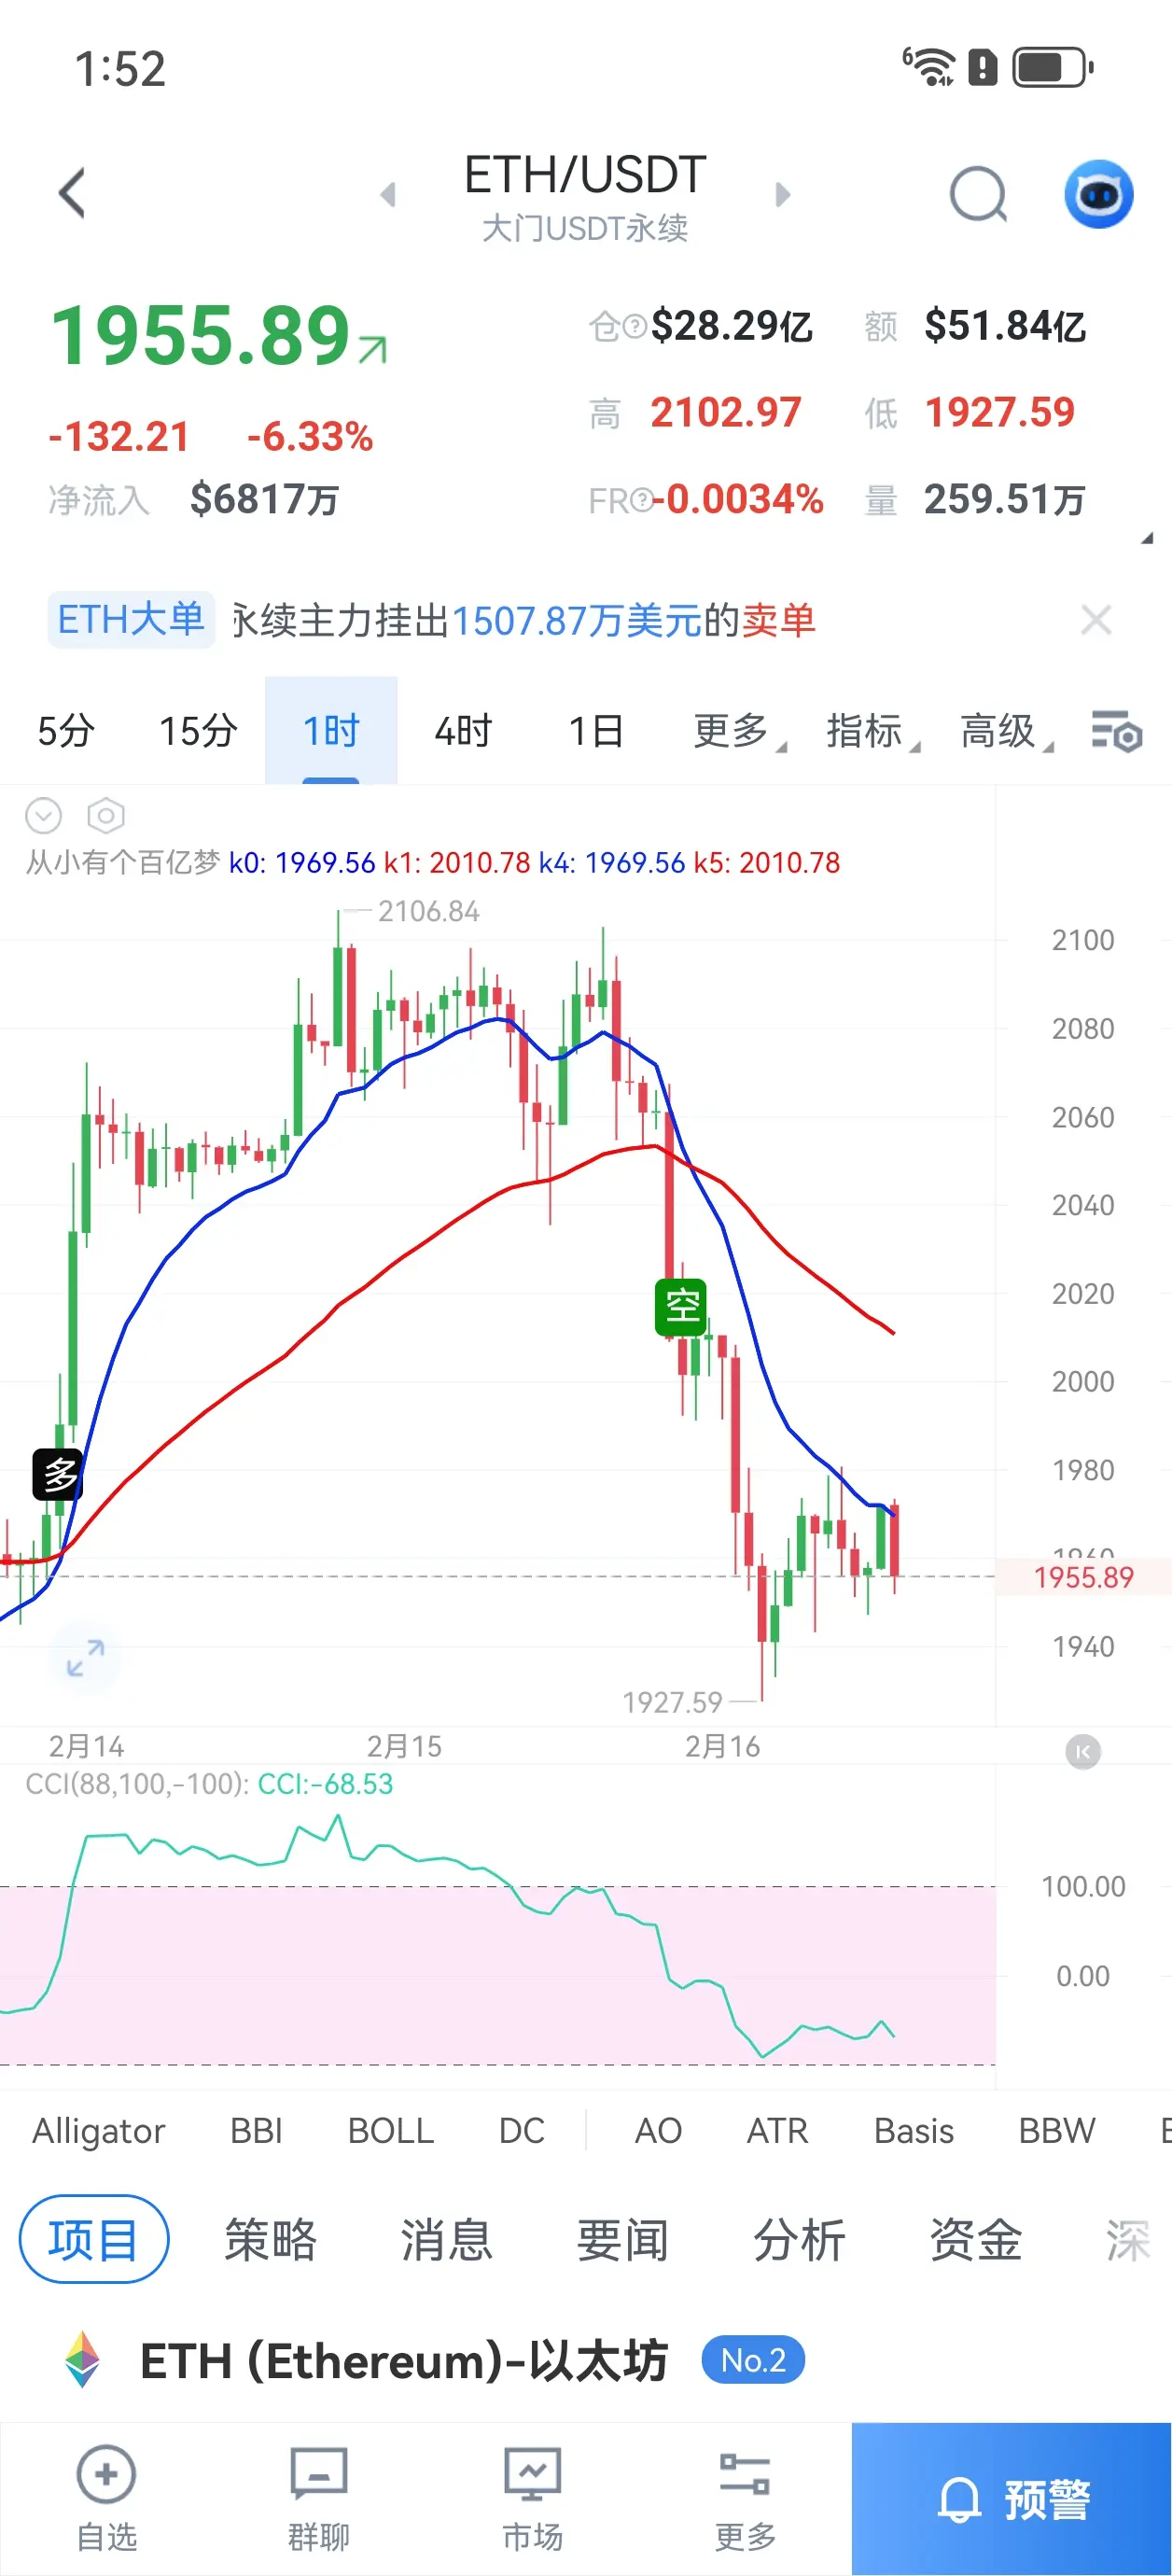
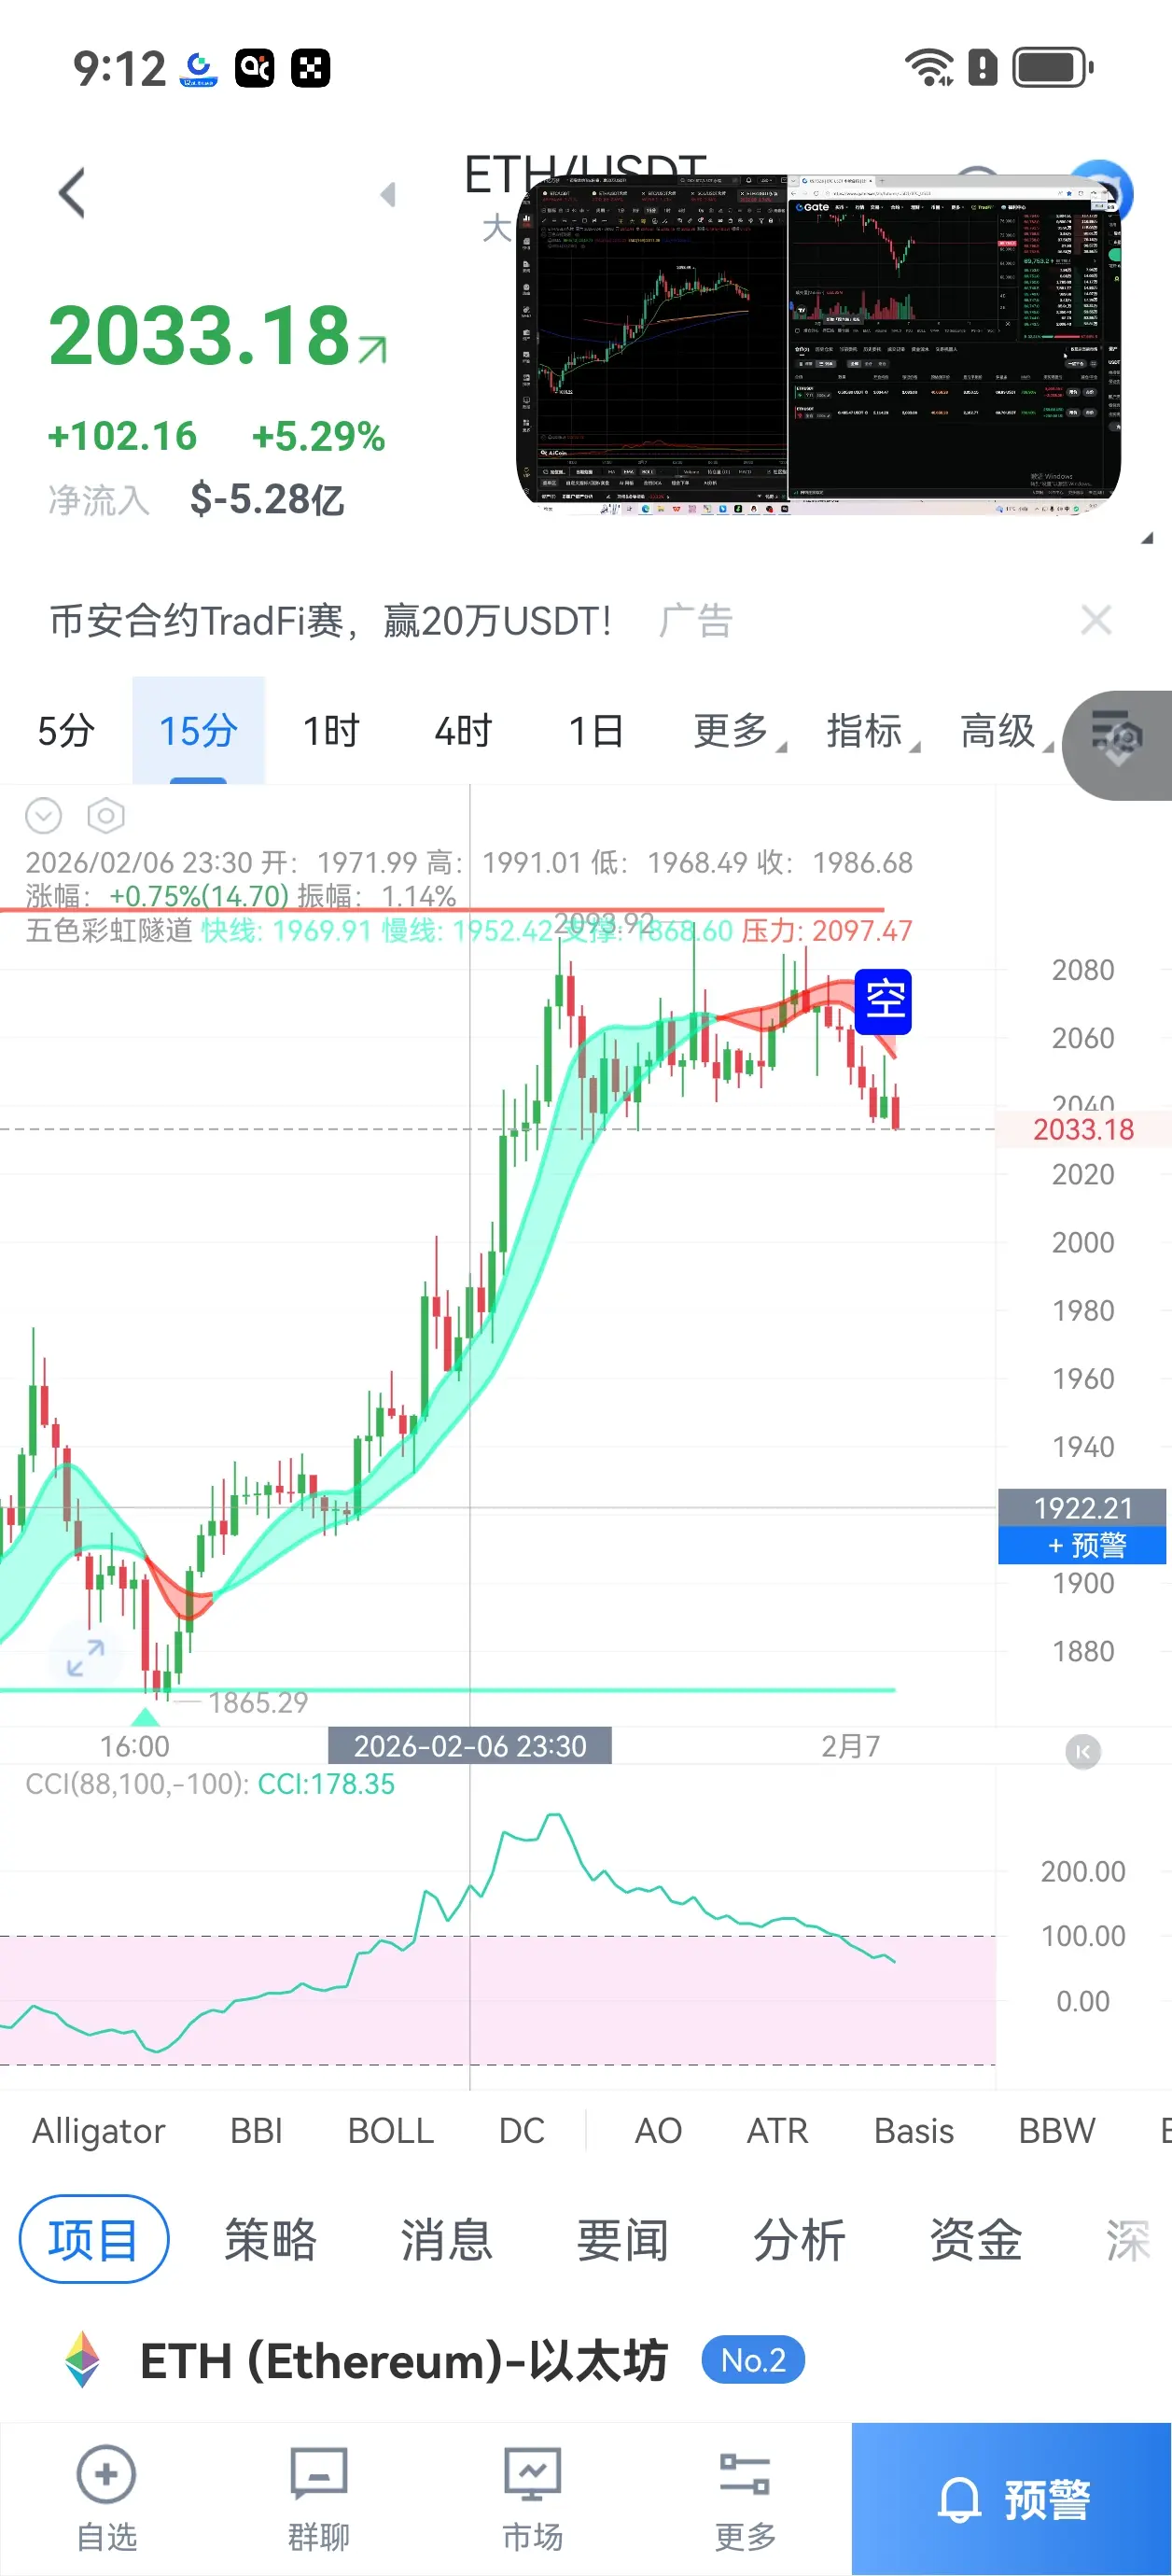
· Short Selling Strategy (Main Approach):
· Entry: If the price rebounds to the $2000-$2050 range and shows signs of stagnation (such as an upper shadow), consider a light short position.
· Stop Loss: Set above $2095; if the price breaks through this level effectively, exit the short position.
· Targets: Watch for $1980 → $1972 → $1950 sequentially.
· Long Position Strategy (Rebound Play):
· Entry: If the price stabilizes after a pullback to the $1960-$1972 range (such as closing with a lower shadow), try a short-term long.
· Stop Loss: Set below $1955; if broken, exit strictly.
·
View Original· Entry: If the price rebounds to the $2000-$2050 range and shows signs of stagnation (such as an upper shadow), consider a light short position.
· Stop Loss: Set above $2095; if the price breaks through this level effectively, exit the short position.
· Targets: Watch for $1980 → $1972 → $1950 sequentially.
· Long Position Strategy (Rebound Play):
· Entry: If the price stabilizes after a pullback to the $1960-$1972 range (such as closing with a lower shadow), try a short-term long.
· Stop Loss: Set below $1955; if broken, exit strictly.
·
- Reward
- 1
- 1
- Repost
- Share
Brother-In-Law,BeHappy! :
:
Wishing you great wealth in the Year of the Horse 🐴
Buy Point 1: 1950 USDT (Integer level, close to recent 4-hour and daily lows at 1948.76 and 1928.88, potentially forming short-term support)
- Buy Point 2: 1850 USDT (Important integer level, near previous wave lows at 1818.18 and 1747.8, possibly generating strong buying interest)
- Long Stop-Loss Point: 1800 USDT (Below the previous low of 1747.8, a break below this level may indicate deeper decline)
- Sell Point 1: 2000 USDT (Integer level, also close to 4-hour EMA7 and EMA30, as well as previous high at 2011.3, forming strong resistance)
- Sell Point 2: 2100 USDT (Important integer level,
View Original- Buy Point 2: 1850 USDT (Important integer level, near previous wave lows at 1818.18 and 1747.8, possibly generating strong buying interest)
- Long Stop-Loss Point: 1800 USDT (Below the previous low of 1747.8, a break below this level may indicate deeper decline)
- Sell Point 1: 2000 USDT (Integer level, also close to 4-hour EMA7 and EMA30, as well as previous high at 2011.3, forming strong resistance)
- Sell Point 2: 2100 USDT (Important integer level,
- Reward
- like
- Comment
- Repost
- Share
【Buy and Sell Entry Points】
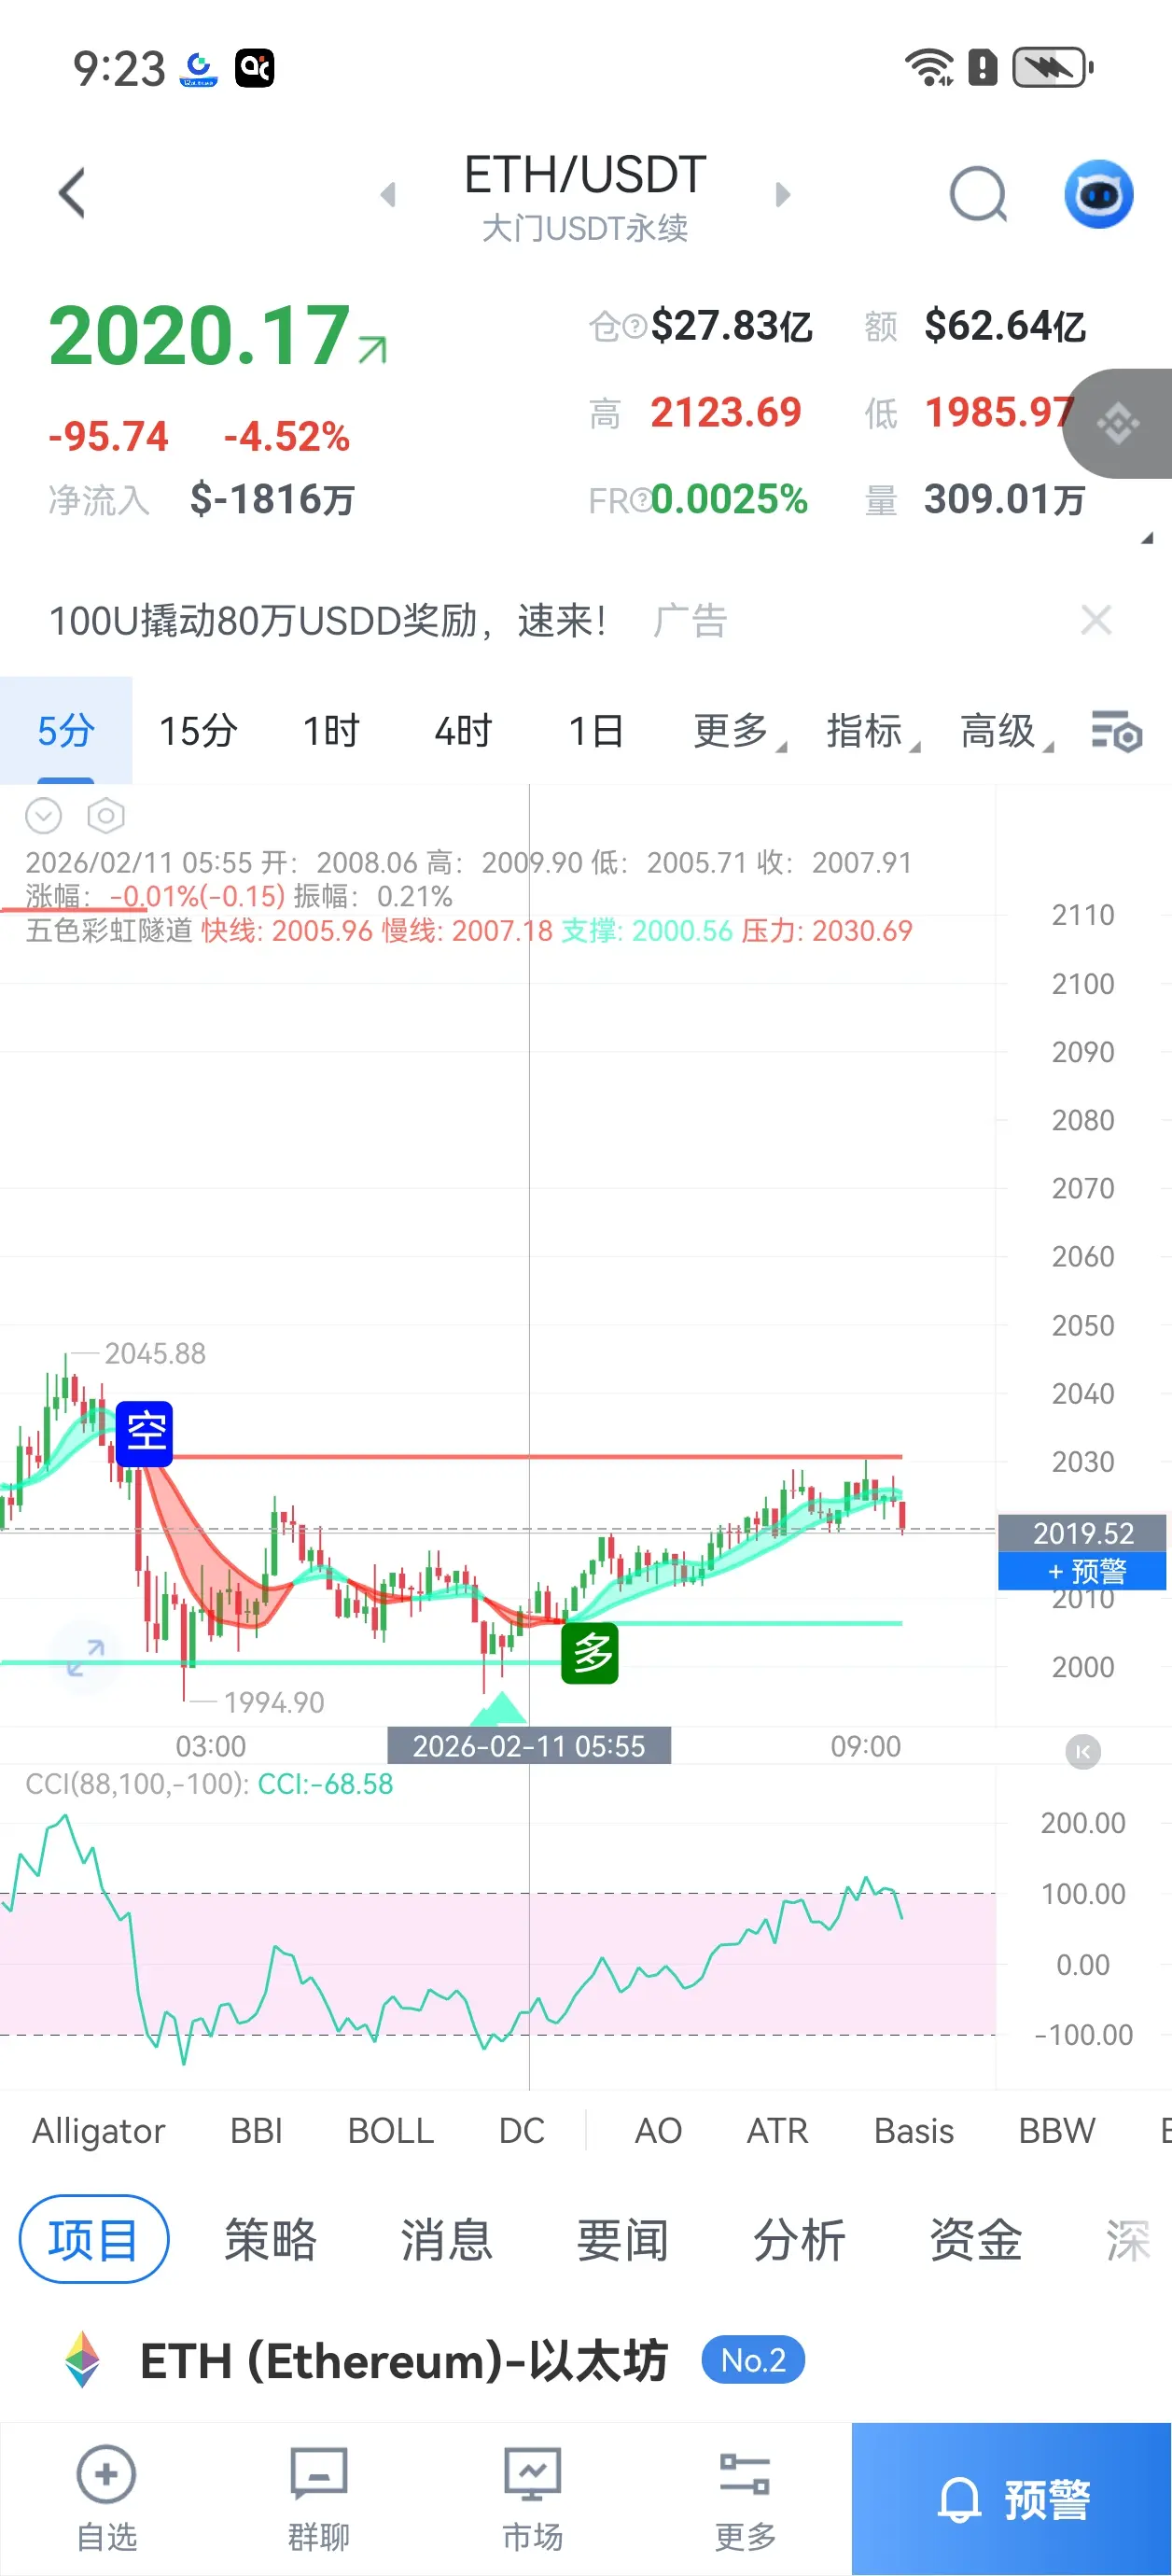
- Buy Entry Point 1: 2050 USDT (On the 4-hour chart, the current price has broken below EMA7, indicating a short-term correction. 2050 is an integer level and close to the recent 4-hour low of 2053.81, which may provide short-term support.)
- Buy Entry Point 2: 2000 USDT (On the 4-hour chart, EMA30 (2034.20) is an important support level. 2000 is a stronger integer level. If the price continues to retrace to this level, it may attract stronger buying support.)
- Long Position Stop Loss: 1975 USDT (Below Buy Entry Point 2 at 2000. If the price falls below 2000 and co
View Original- Buy Entry Point 1: 2050 USDT (On the 4-hour chart, the current price has broken below EMA7, indicating a short-term correction. 2050 is an integer level and close to the recent 4-hour low of 2053.81, which may provide short-term support.)
- Buy Entry Point 2: 2000 USDT (On the 4-hour chart, EMA30 (2034.20) is an important support level. 2000 is a stronger integer level. If the price continues to retrace to this level, it may attract stronger buying support.)
- Long Position Stop Loss: 1975 USDT (Below Buy Entry Point 2 at 2000. If the price falls below 2000 and co
- Reward
- 2
- 1
- Repost
- Share
PotatoTomatoSoup :
:
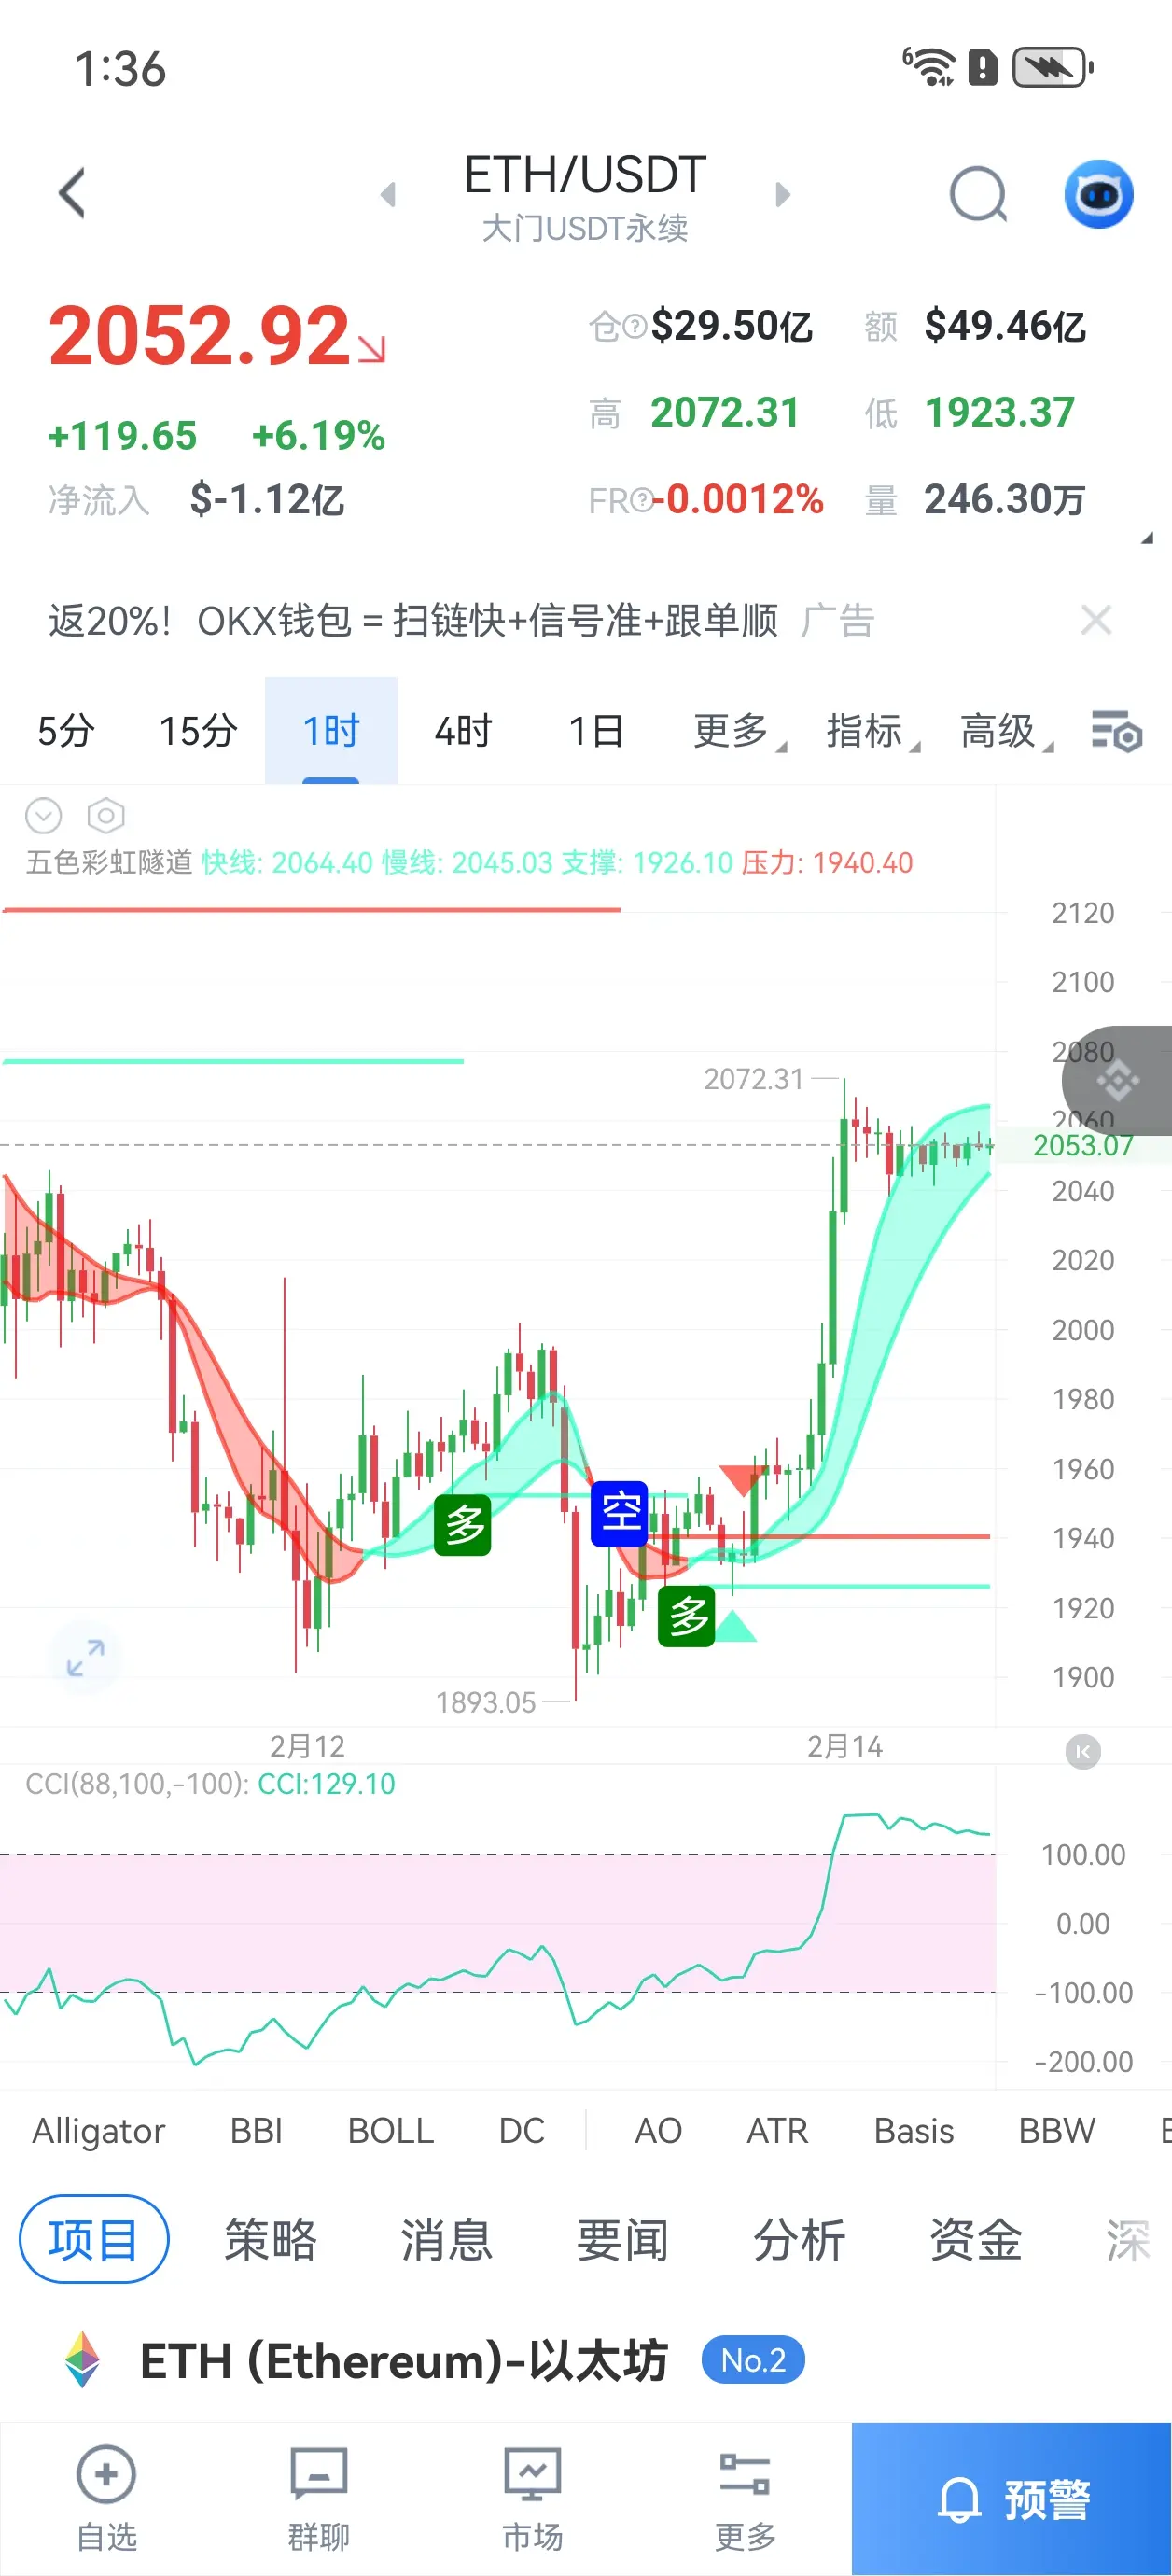
Happy New Year 🧨Buy Point 1: 2030 USDT (Price retraced to the recent 4-hour K-line low area and EMA7 (2028), which may provide support)
- Buy Point 2: 2000 USDT (Strong round number support, also close to 4-hour EMA30 (2014), and maintains a sufficient price gap from Buy Point 1, offering a deeper retracement buying opportunity)
- Long Stop-Loss Point: 1990 USDT (Set below Buy Point 2 and below the recent 4-hour K-line low; a break below this may indicate the end of the short-term uptrend)
- Sell Point 1: 2070 USDT (Near the previous wave high (February 13 daily high 2073.68, February 14 00:00 4-hour high 207
View Original- Buy Point 2: 2000 USDT (Strong round number support, also close to 4-hour EMA30 (2014), and maintains a sufficient price gap from Buy Point 1, offering a deeper retracement buying opportunity)
- Long Stop-Loss Point: 1990 USDT (Set below Buy Point 2 and below the recent 4-hour K-line low; a break below this may indicate the end of the short-term uptrend)
- Sell Point 1: 2070 USDT (Near the previous wave high (February 13 daily high 2073.68, February 14 00:00 4-hour high 207
- Reward
- 2
- 1
- Repost
- Share
BrotherRui :
:
How is this indicator configured?【Price Trend Analysis】
1. Candlestick Patterns:
* 4-Hour Chart:
* Recent candlesticks show the price fluctuating between 2000-2050, but the overall center of gravity is moving downward.
* On February 11th at 00:00, a bearish candle with a long upper shadow appeared, accompanied by high trading volume, indicating strong selling pressure above.
* On February 10th at 12:00, a large-volume bearish candle appeared, consistent with the "sharp decline with increased volume" pattern, suggesting a possible short-term pullback or consolidation.
* The current cand
View Original1. Candlestick Patterns:
* 4-Hour Chart:
* Recent candlesticks show the price fluctuating between 2000-2050, but the overall center of gravity is moving downward.
* On February 11th at 00:00, a bearish candle with a long upper shadow appeared, accompanied by high trading volume, indicating strong selling pressure above.
* On February 10th at 12:00, a large-volume bearish candle appeared, consistent with the "sharp decline with increased volume" pattern, suggesting a possible short-term pullback or consolidation.
* The current cand


- Reward
- like
- Comment
- Repost
- Share
【Buy and Sell Entry Points】
- Buy Point 1: 2000 USDT
* Analysis Reason: 2000 is an important psychological support level, coinciding with several recent lows on the 4-hour chart (such as 1996, 1995, 1987.71), indicating potential buying interest in this area.
- Buy Point 2: 1850 USDT
* Analysis Reason: 1850 is a deeper round support level, located above the February 5 daily low of 1815.16, representing a strong rebound zone that may occur if the price continues to decline in the current downtrend.
- Long Stop-Loss Point: 1800 USDT
* Analysis Reason: 1800 is a key round
View Original- Buy Point 1: 2000 USDT
* Analysis Reason: 2000 is an important psychological support level, coinciding with several recent lows on the 4-hour chart (such as 1996, 1995, 1987.71), indicating potential buying interest in this area.
- Buy Point 2: 1850 USDT
* Analysis Reason: 1850 is a deeper round support level, located above the February 5 daily low of 1815.16, representing a strong rebound zone that may occur if the price continues to decline in the current downtrend.
- Long Stop-Loss Point: 1800 USDT
* Analysis Reason: 1800 is a key round

- Reward
- like
- Comment
- Repost
- Share
【Buy and Sell Points】
- Buy Point 1: 2080 USDT (Reason: Near previous low, supports at the integer level, also close to EMA7 moving average, indicating strong buying potential)
- Buy Point 2: 2065 USDT (Reason: Closer to the previous swing low of 2008, with potential support)
- Long Position Stop Loss: 2055 USDT (Reason: If it falls below Buy Point 2, further decline may occur; set below the integer level to mitigate risk)
- Sell Point 1: 2125 USDT (Reason: Below the previous high of 2148, acts as a resistance zone, also the upper boundary of short-term oscillation)
- Sell Point 2: 2150 USDT (
View Original- Buy Point 1: 2080 USDT (Reason: Near previous low, supports at the integer level, also close to EMA7 moving average, indicating strong buying potential)
- Buy Point 2: 2065 USDT (Reason: Closer to the previous swing low of 2008, with potential support)
- Long Position Stop Loss: 2055 USDT (Reason: If it falls below Buy Point 2, further decline may occur; set below the integer level to mitigate risk)
- Sell Point 1: 2125 USDT (Reason: Below the previous high of 2148, acts as a resistance zone, also the upper boundary of short-term oscillation)
- Sell Point 2: 2150 USDT (
- Reward
- like
- Comment
- Repost
- Share


- Reward
- like
- Comment
- Repost
- Share
12:00 First Analysis: Yesterday, Bitcoin and ETH spot minute charts experienced abnormal fluctuations, possibly caused by a liquidation event of a market-making bot.
BlockBeats reports that on February 9, Wintermute founder Evgeny Gaevoy analyzed the abnormal volatility in Bitcoin and ETH spot 1-minute charts on the early morning of February 8. He stated that it was very likely due to a market-making bot experiencing a liquidation, with losses possibly reaching tens of millions of dollars. The abnormal fluctuations were caused by losses from the bot, not malicious actions by market makers, a
BlockBeats reports that on February 9, Wintermute founder Evgeny Gaevoy analyzed the abnormal volatility in Bitcoin and ETH spot 1-minute charts on the early morning of February 8. He stated that it was very likely due to a market-making bot experiencing a liquidation, with losses possibly reaching tens of millions of dollars. The abnormal fluctuations were caused by losses from the bot, not malicious actions by market makers, a
ETH-2.72%

- Reward
- like
- 1
- Repost
- Share
Brother-In-Law,BeHappy!:
New Year Wealth Explosion 🤑13:03 Tencent Finance: Yi Lihua appeared in Causeway Bay on the 6th with no unusual signs, while on the same day, a fund in Hong Kong entered the market to buy the dip
BlockBeats news, on February 9th, Tencent Finance's "Periscope" published an article titled "Cryptocurrency Major Collapse: Crypto Veteran Yi Lihua Loses $700 Million in a Week," Yi Lihua may have become the most well-known Chinese veteran in the crypto market targeted during this round of sharp decline, and he may have once considered continuing to gamble. In the first four days of February, he sold only about 190,000 ETH and t
View OriginalBlockBeats news, on February 9th, Tencent Finance's "Periscope" published an article titled "Cryptocurrency Major Collapse: Crypto Veteran Yi Lihua Loses $700 Million in a Week," Yi Lihua may have become the most well-known Chinese veteran in the crypto market targeted during this round of sharp decline, and he may have once considered continuing to gamble. In the first four days of February, he sold only about 190,000 ETH and t


- Reward
- 1
- 1
- Repost
- Share
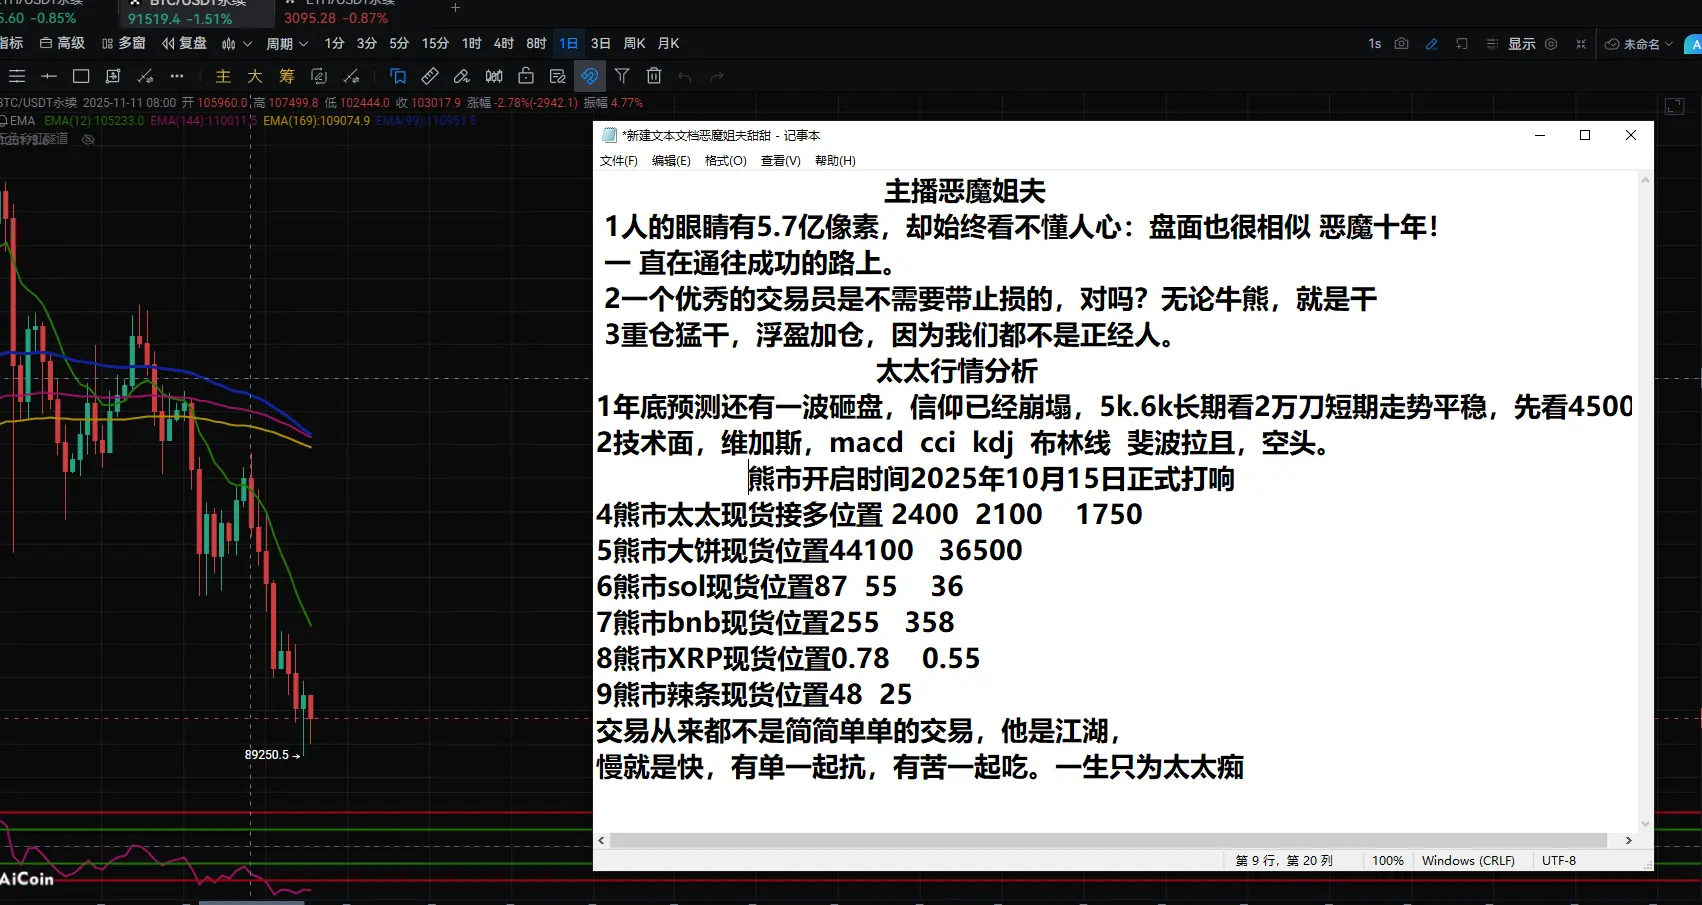
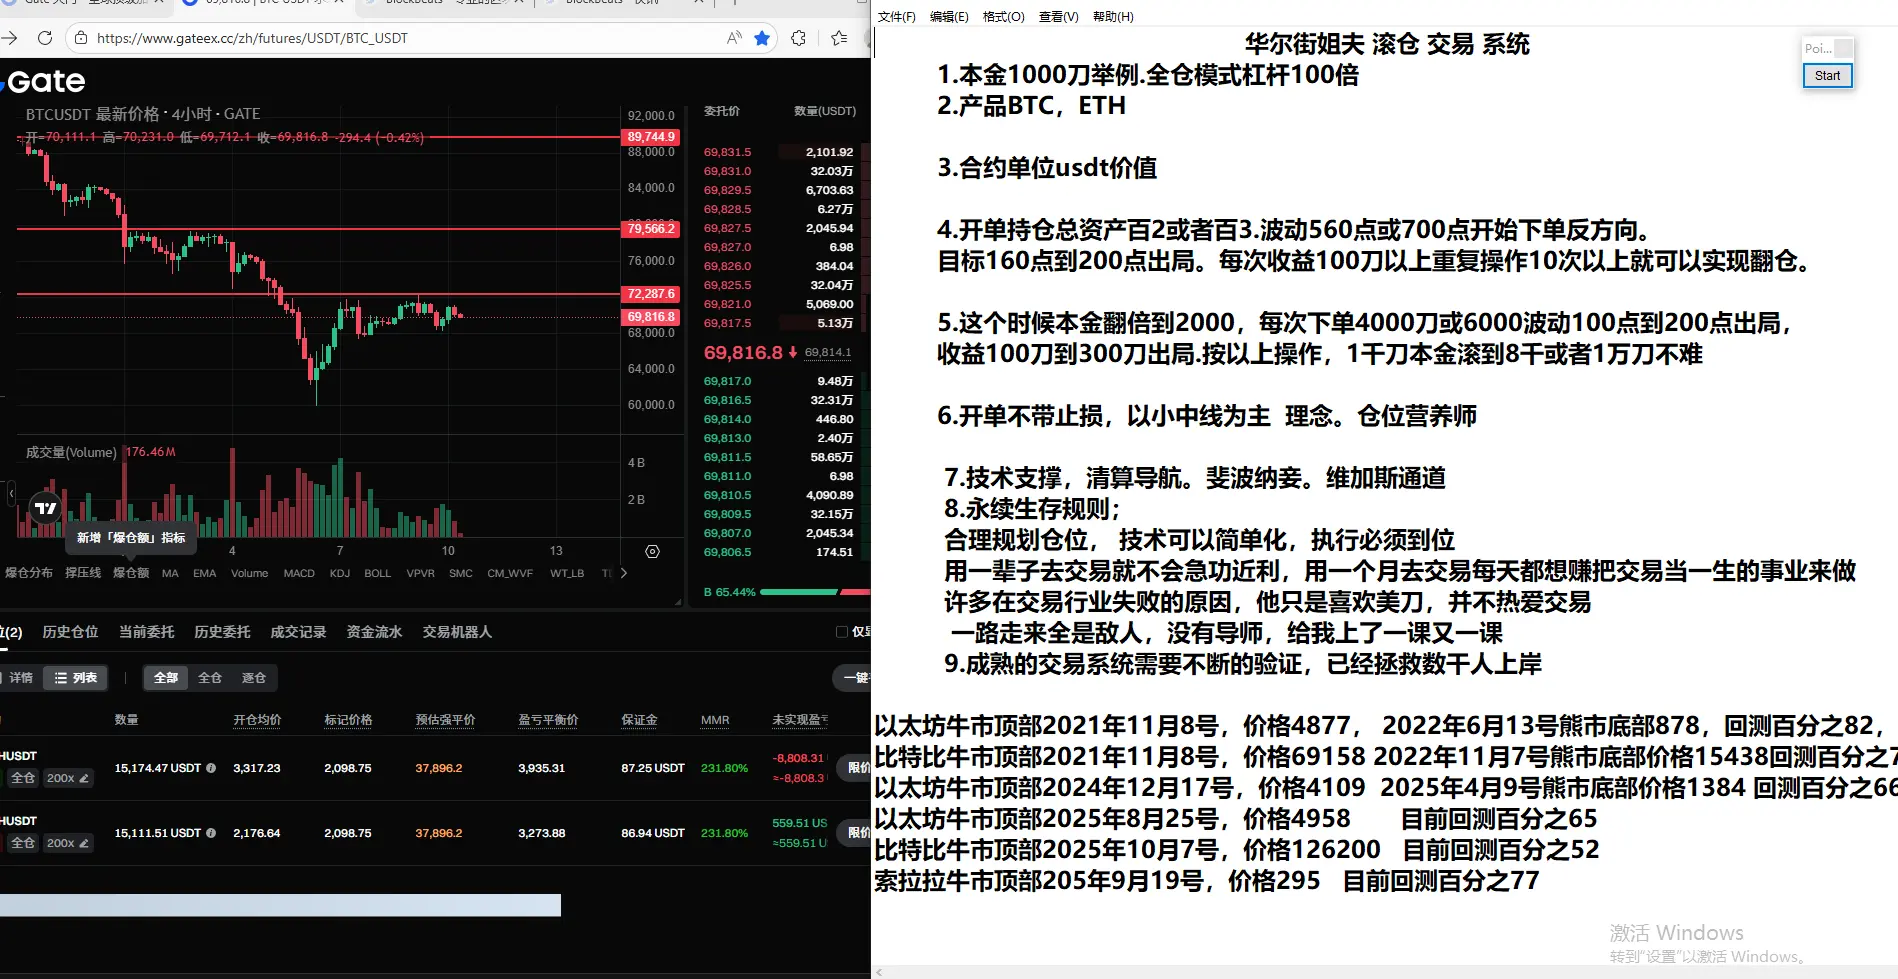
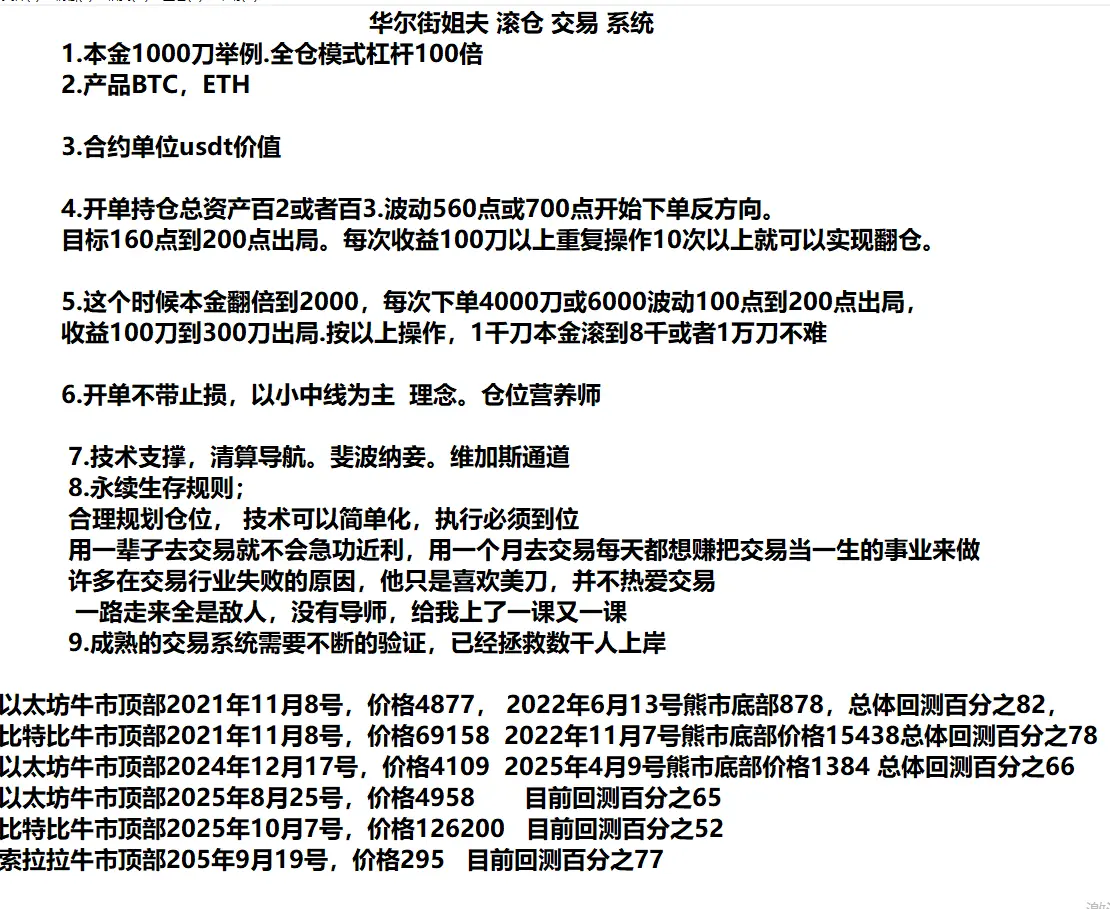
I don't know if I can withstand the rumors and gossip, but I want to stand firm. I predict the bottom has not yet arrived. Currently, it has only retraced 65%. Well, the big pancake has only retraced 52%. I don't know if you can understand. Solana has retraced 77%. A major bear market is coming, are you ready? Take a serious look. $BTC $ETH
View Original
- Reward
- 1
- Comment
- Repost
- Share
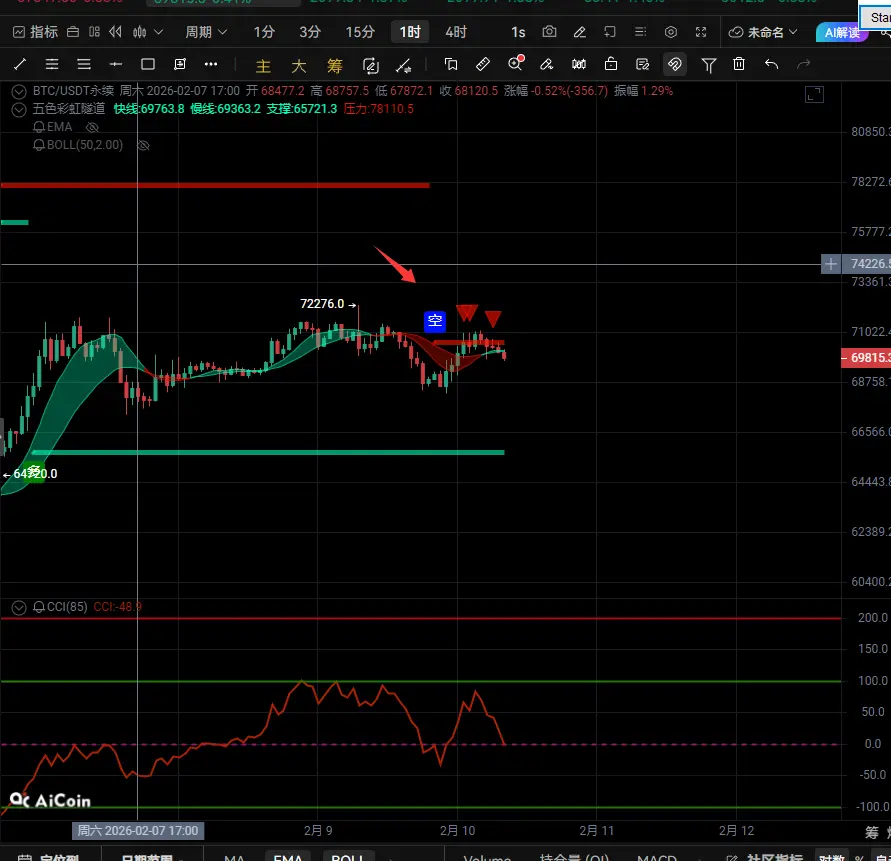
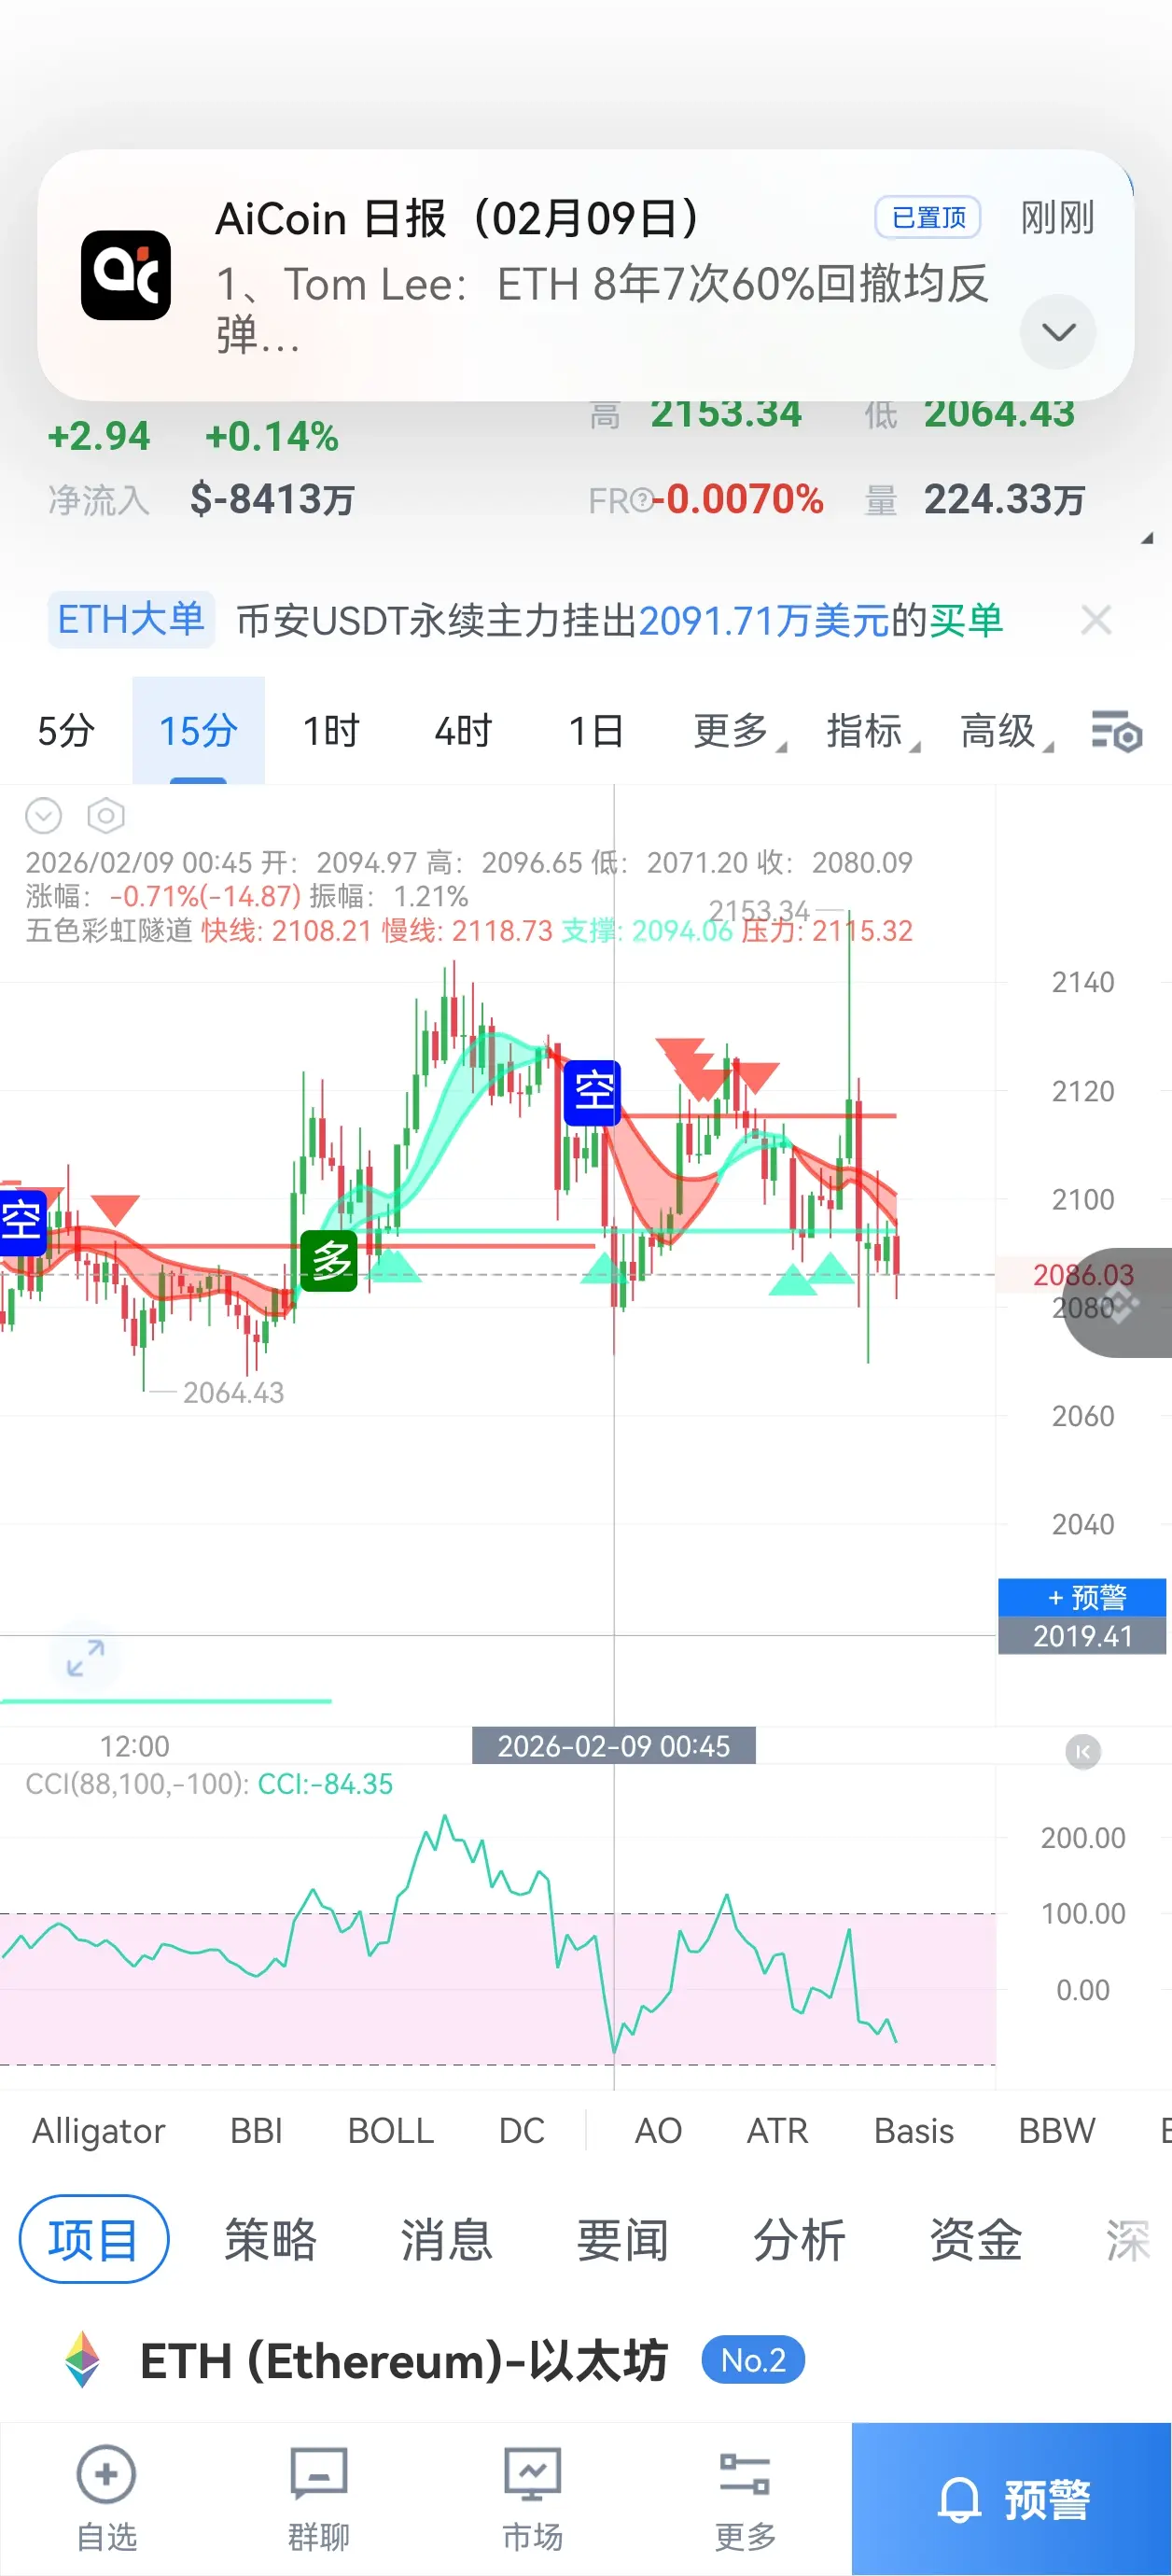
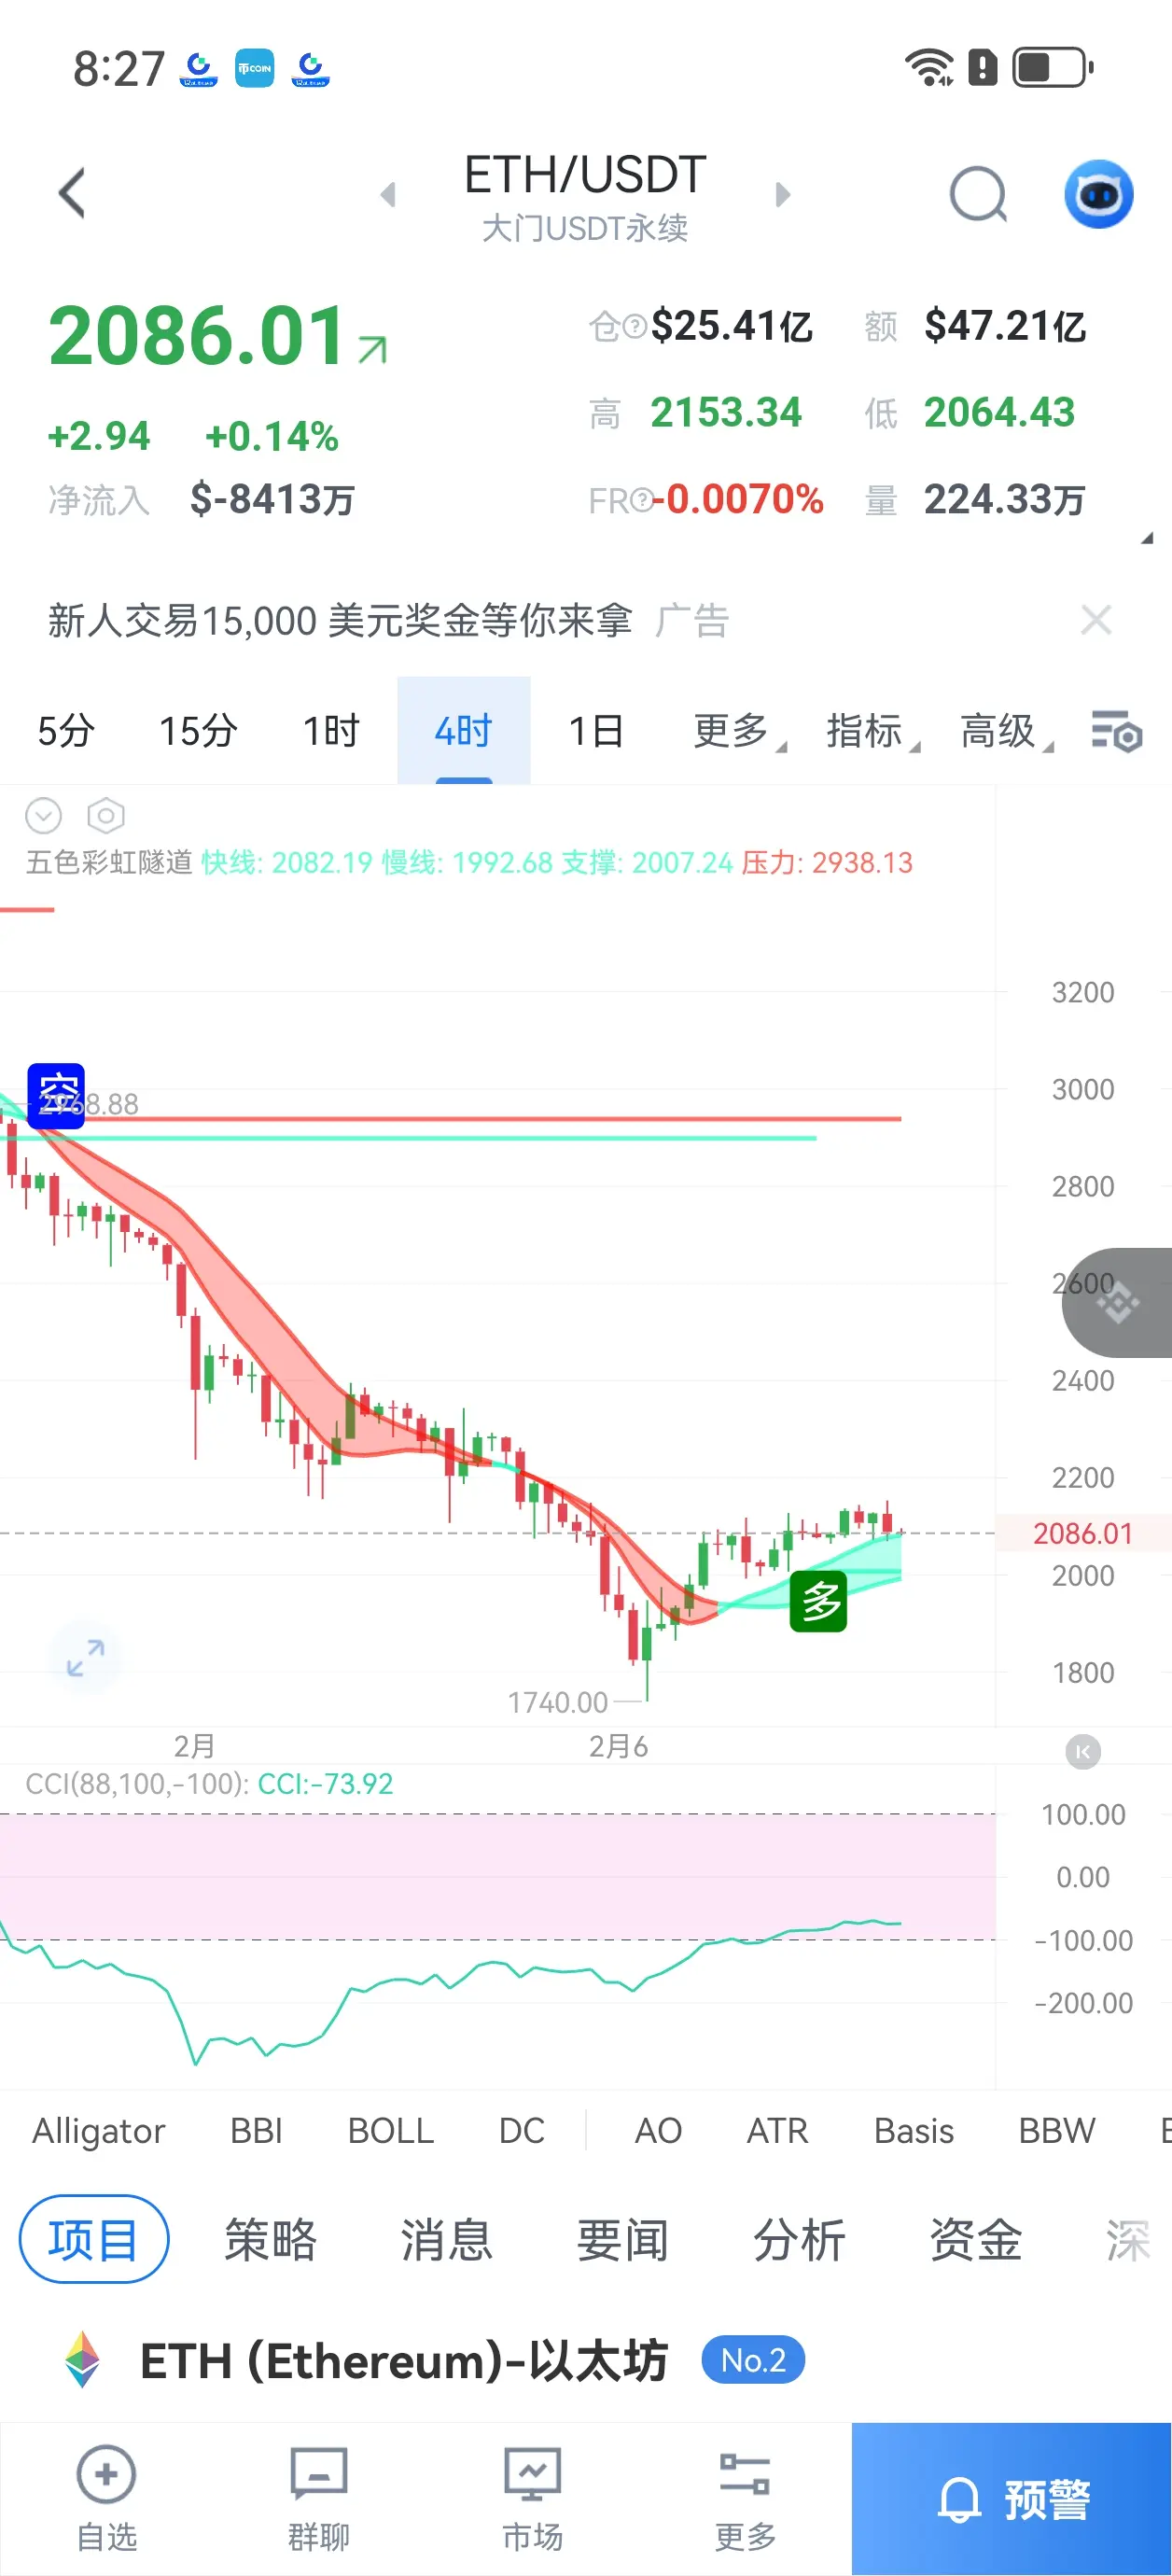
$ETH Price Trend Analysis
1. Candlestick Patterns:
- Recent prices have been fluctuating between 2080 and 2150, showing a consolidation at high levels.
- A rebound occurred after a sharp decline earlier, but the rebound strength has weakened, forming long upper shadows and small real bodies on the candlesticks.
2. Technical Indicators:
- MACD: In the 4-hour cycle, the MACD histogram has shifted from red to green, with DIF and DEA still in negative territory, indicating that the bearish momentum is dominant but showing signs of weakening.
- RSI: The RSI14 value is 47.84, not entering ove
View Original1. Candlestick Patterns:
- Recent prices have been fluctuating between 2080 and 2150, showing a consolidation at high levels.
- A rebound occurred after a sharp decline earlier, but the rebound strength has weakened, forming long upper shadows and small real bodies on the candlesticks.
2. Technical Indicators:
- MACD: In the 4-hour cycle, the MACD histogram has shifted from red to green, with DIF and DEA still in negative territory, indicating that the bearish momentum is dominant but showing signs of weakening.
- RSI: The RSI14 value is 47.84, not entering ove

- Reward
- 1
- Comment
- Repost
- Share
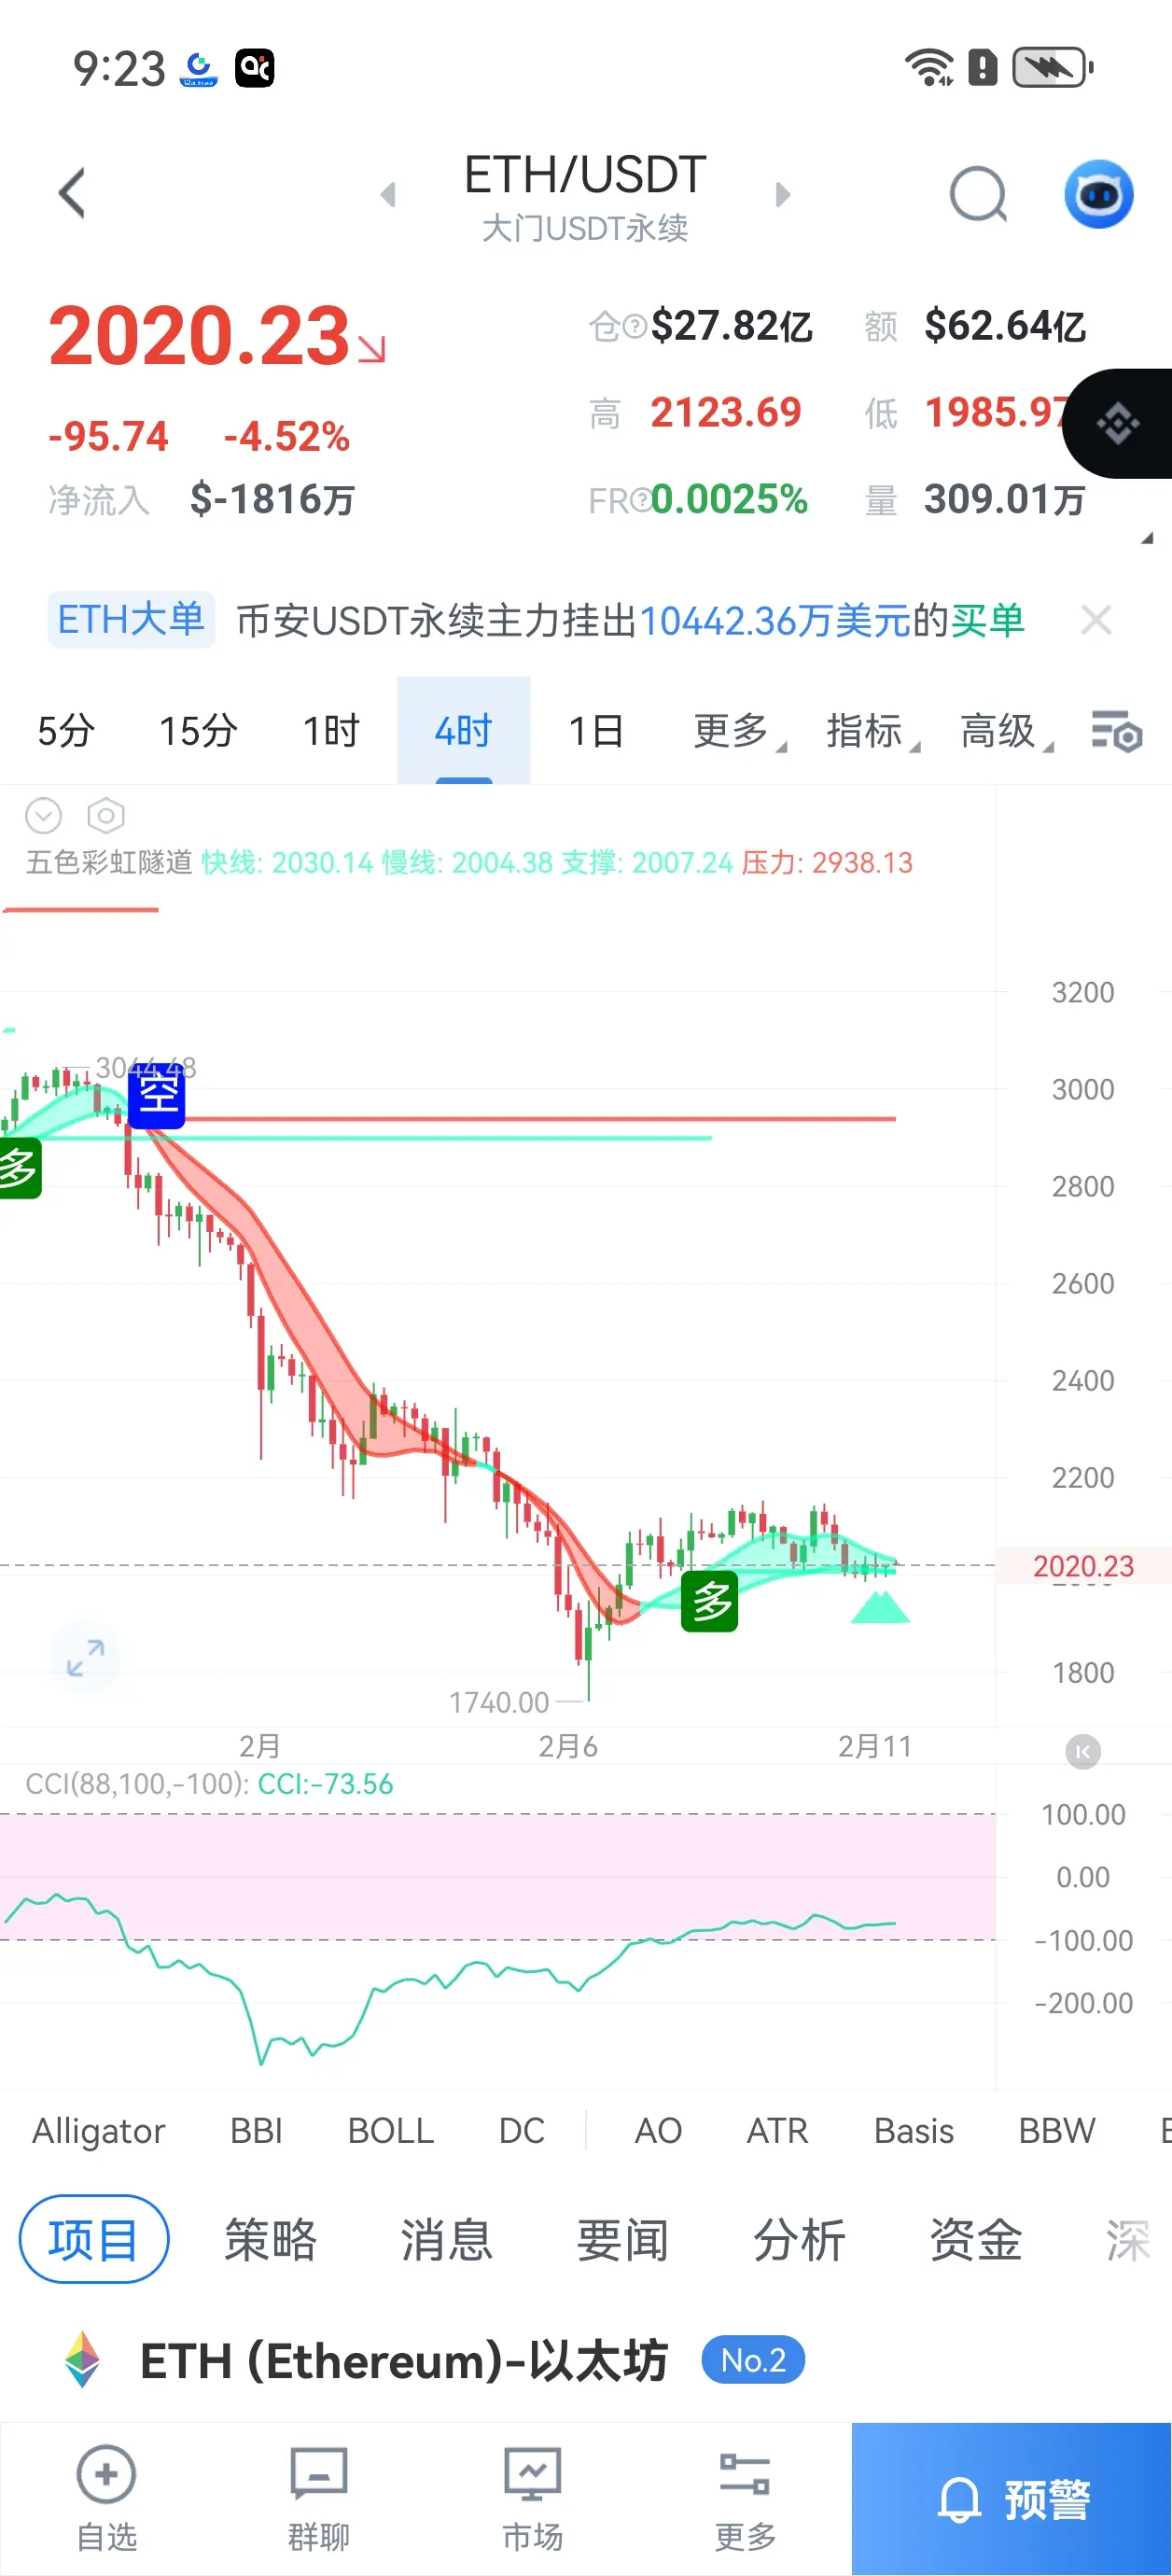
【Buy and Sell Entry Points】
- Buy Entry Point 1: 2050 USDT (Reason: Near previous low, strong support at integer levels, also close to the potential support zone of the EMA120 moving average)
- Buy Entry Point 2: 2025 USDT (Reason: Further decline to a stronger support level, near the February 6 low of 1826.83 and the recent oscillation zone bottom extension)
- Long Position Stop Loss: 2000 USDT (Reason: Psychological support at an integer level; a break below could trigger a larger downward move)
---
- Sell Entry Point 1: 2125 USDT (Reason: Previous high resistance level, close to the Februar
View Original- Buy Entry Point 1: 2050 USDT (Reason: Near previous low, strong support at integer levels, also close to the potential support zone of the EMA120 moving average)
- Buy Entry Point 2: 2025 USDT (Reason: Further decline to a stronger support level, near the February 6 low of 1826.83 and the recent oscillation zone bottom extension)
- Long Position Stop Loss: 2000 USDT (Reason: Psychological support at an integer level; a break below could trigger a larger downward move)
---
- Sell Entry Point 1: 2125 USDT (Reason: Previous high resistance level, close to the Februar
- Reward
- 3
- 2
- Repost
- Share
Brother-In-Law,BeHappy!:
New Year Wealth Explosion 🤑View More
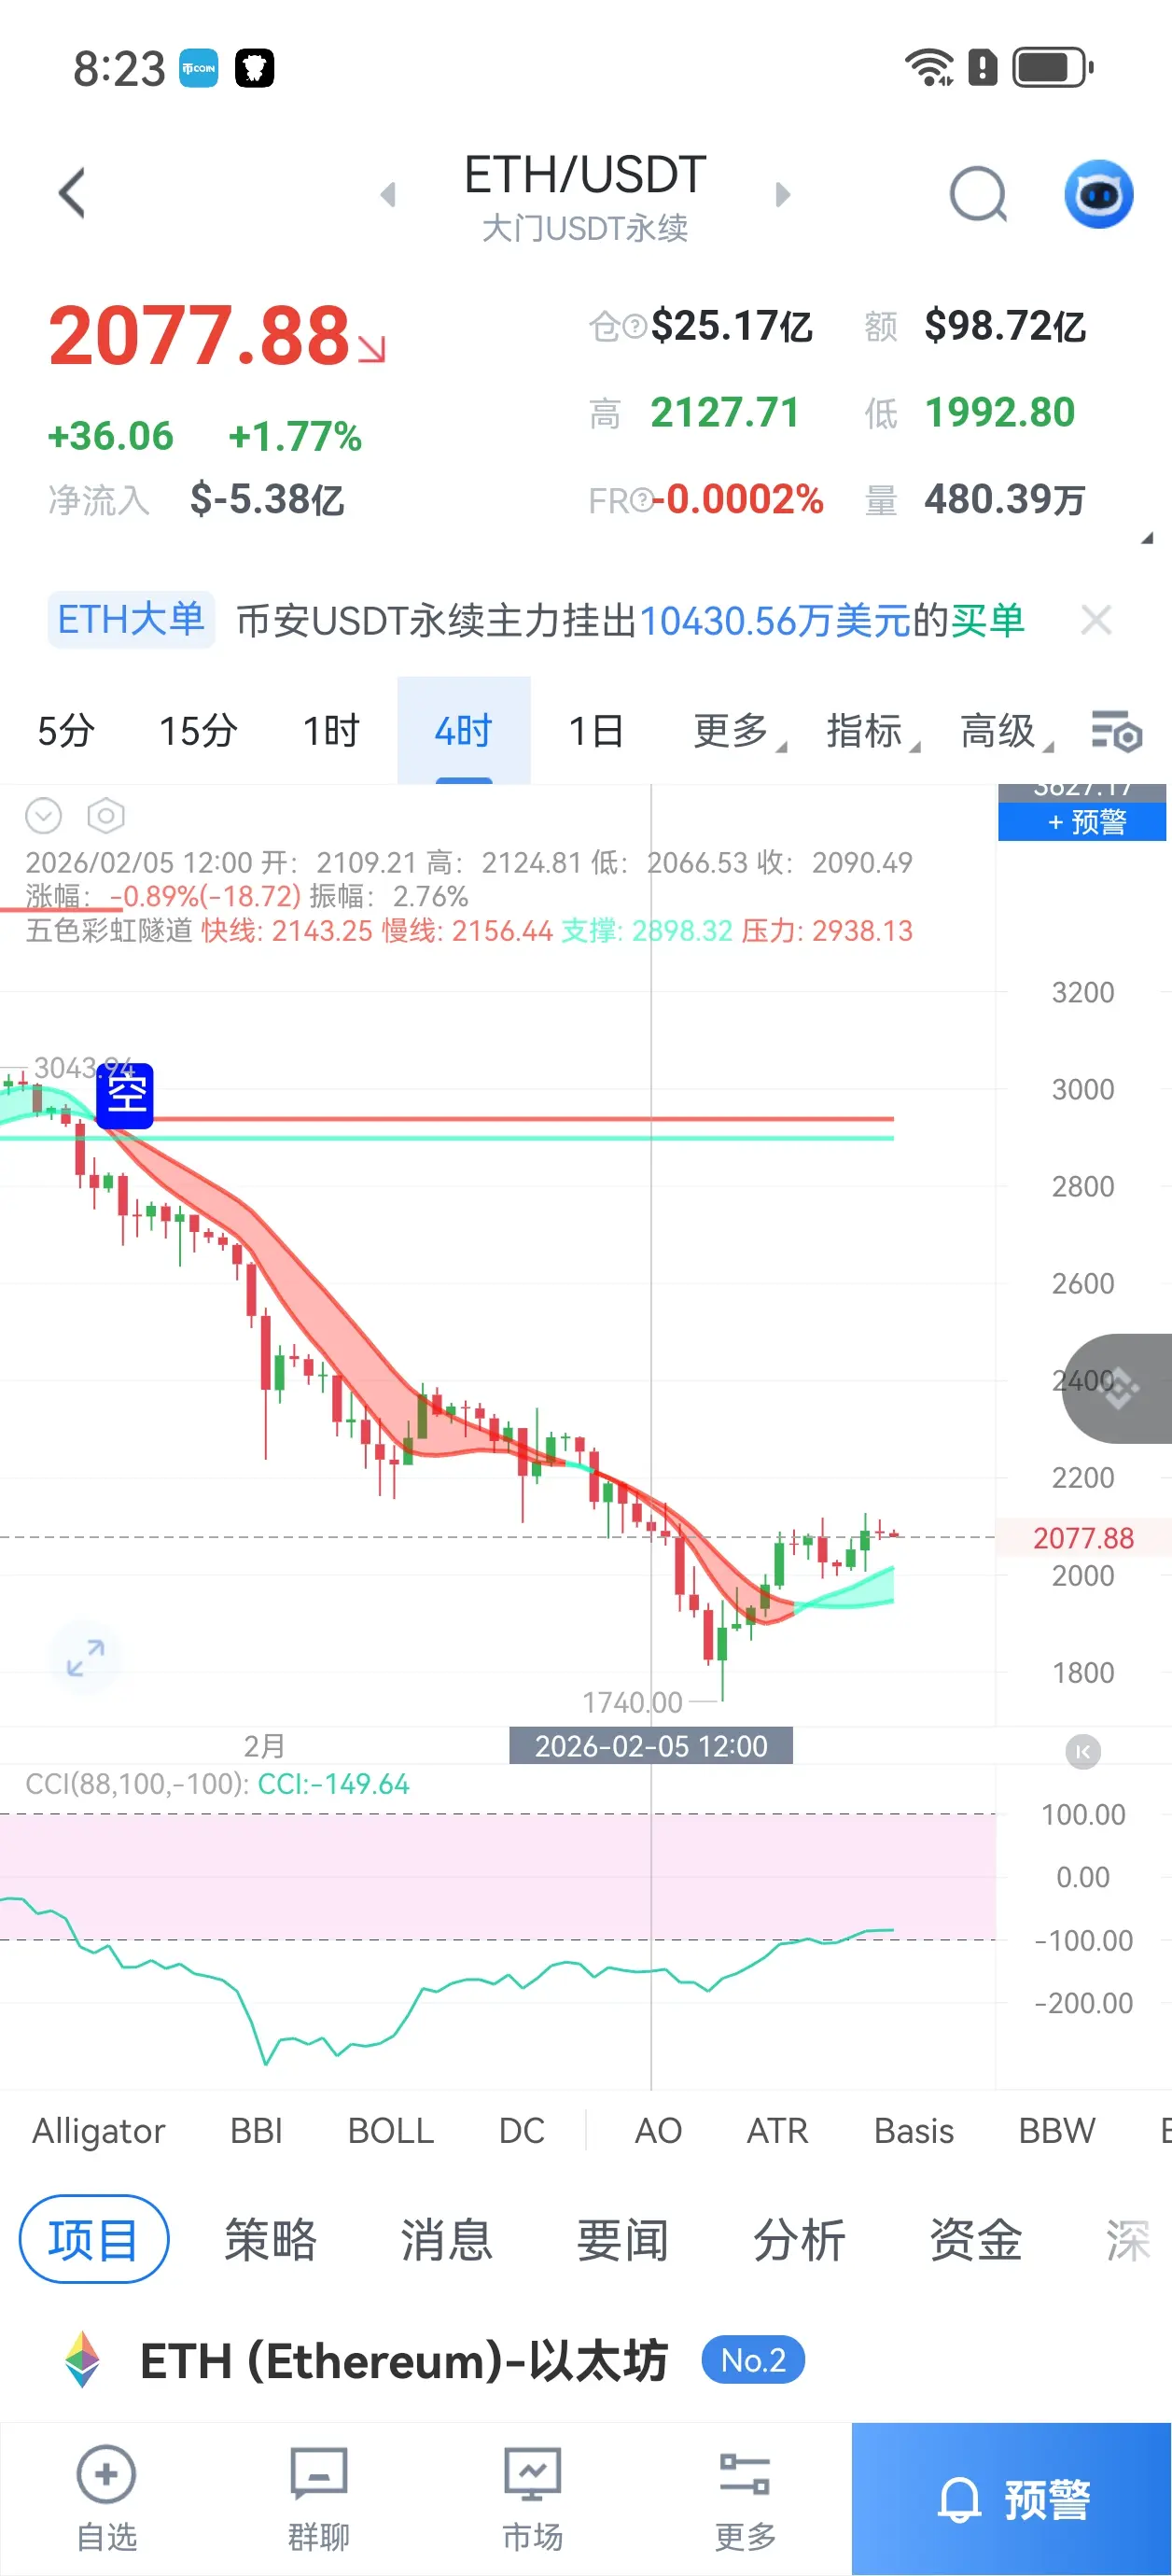
【Price Trend Analysis】
1. Candlestick Patterns:
- Recent candlesticks show that after the sharp decline on February 5th, prices have experienced a rapid rebound and are currently in a consolidation phase.
- On the daily chart, long lower shadows have formed, followed by two consecutive days of bullish closes, but within the 4-hour cycle, the highs are gradually decreasing, indicating short-term pullback pressure.
2. Technical Indicators:
- MACD: In the 4-hour cycle, both DIF and DEA are negative, and the MACD histogram shows decreasing bars, indicating weakening bearish momentum but n
View Original1. Candlestick Patterns:
- Recent candlesticks show that after the sharp decline on February 5th, prices have experienced a rapid rebound and are currently in a consolidation phase.
- On the daily chart, long lower shadows have formed, followed by two consecutive days of bullish closes, but within the 4-hour cycle, the highs are gradually decreasing, indicating short-term pullback pressure.
2. Technical Indicators:
- MACD: In the 4-hour cycle, both DIF and DEA are negative, and the MACD histogram shows decreasing bars, indicating weakening bearish momentum but n

- Reward
- 3
- 5
- Repost
- Share
GateUser-d10f5768 :
:
Hold on tight, we're about to take off 🛫View More
$ETH
- Buy Point 1: 2050 USDT (above the previous 4-hour low of 2009.54, with support at the round number, also near the EMA7 moving average)
- Buy Point 2: 2025 USDT (closer to the February 6 retracement low of 1999.57, with strong support at the round number overlapping with recent high-volume trading zones)
- Long position stop-loss: 2010 USDT (if it falls below the previous low of 2009.54, further decline becomes more likely; set the stop-loss below the key support level to manage risk)
---
- Sell Point 1: 2120 USDT (near the current EMA30 resistance at 2121.46, and close to the short-t
View Original- Buy Point 1: 2050 USDT (above the previous 4-hour low of 2009.54, with support at the round number, also near the EMA7 moving average)
- Buy Point 2: 2025 USDT (closer to the February 6 retracement low of 1999.57, with strong support at the round number overlapping with recent high-volume trading zones)
- Long position stop-loss: 2010 USDT (if it falls below the previous low of 2009.54, further decline becomes more likely; set the stop-loss below the key support level to manage risk)
---
- Sell Point 1: 2120 USDT (near the current EMA30 resistance at 2121.46, and close to the short-t
- Reward
- 1
- Comment
- Repost
- Share
- Buy Point 1: 2000 USDT (Integer support level, close to the previous low area, also near the EMA7 moving average, providing some support)
- Buy Point 2: 1950 USDT (Further decline to a stronger integer support level, also an important support zone within the recent fluctuation range)
- Long position stop-loss: 1925 USDT (If it falls below Buy Point 2, a new downtrend may form. Set a reasonable stop-loss here)
- Sell Point 1: 2100 USDT (Integer resistance level, also close to the EMA30 moving average, with significant selling pressure)
- Sell Point 2: 2150 USDT (Breakthrough of 2100 USDT, the
View Original- Buy Point 2: 1950 USDT (Further decline to a stronger integer support level, also an important support zone within the recent fluctuation range)
- Long position stop-loss: 1925 USDT (If it falls below Buy Point 2, a new downtrend may form. Set a reasonable stop-loss here)
- Sell Point 1: 2100 USDT (Integer resistance level, also close to the EMA30 moving average, with significant selling pressure)
- Sell Point 2: 2150 USDT (Breakthrough of 2100 USDT, the

- Reward
- 2
- 3
- Repost
- Share
Brother-In-Law,BeHappy!:
New Year Wealth Explosion 🤑View More
【Buy and Sell Entry Points】
- Buy Entry Point 1: 1850 USDT (Reason: Previous 4-hour low area, strong support, and close to the psychological level of 1850)
- Buy Entry Point 2: 1800 USDT (Reason: Important support level on the daily chart, also a round number, likely to attract buying interest)
- Long Position Stop Loss: 1785 USDT (Reason: If it breaks below 1800 and continues downward, the trend may weaken further, losing the short-term rebound expectation)
- Sell Entry Point 1: 2000 USDT (Reason: Psychological resistance level, near the upper boundary of recent consolidation zone, potential
View Original- Buy Entry Point 1: 1850 USDT (Reason: Previous 4-hour low area, strong support, and close to the psychological level of 1850)
- Buy Entry Point 2: 1800 USDT (Reason: Important support level on the daily chart, also a round number, likely to attract buying interest)
- Long Position Stop Loss: 1785 USDT (Reason: If it breaks below 1800 and continues downward, the trend may weaken further, losing the short-term rebound expectation)
- Sell Entry Point 1: 2000 USDT (Reason: Psychological resistance level, near the upper boundary of recent consolidation zone, potential
- Reward
- 2
- 5
- Repost
- Share
Brother-In-Law,BeHappy!:
New Year Wealth Explosion 🤑View More
$BTC $ETH Price Trend Analysis
1. Candlestick Patterns:
- In the last 4-hour period, the price has been continuously falling from a high level, forming consecutive bearish candles, indicating a short-term weak downward trend.
- On the daily chart, after a recent sharp decline, there has been slight consolidation, and the current candlestick is a small bearish candle.
2. Technical Indicators:
- MACD: In the 4-hour cycle, both DIF and DEA are below the zero line, and the MACD histogram's negative value is expanding, indicating strong bearish momentum.
- RSI: The 4-hour RSI is around 23
View Original1. Candlestick Patterns:
- In the last 4-hour period, the price has been continuously falling from a high level, forming consecutive bearish candles, indicating a short-term weak downward trend.
- On the daily chart, after a recent sharp decline, there has been slight consolidation, and the current candlestick is a small bearish candle.
2. Technical Indicators:
- MACD: In the 4-hour cycle, both DIF and DEA are below the zero line, and the MACD histogram's negative value is expanding, indicating strong bearish momentum.
- RSI: The 4-hour RSI is around 23
- Reward
- like
- 2
- Repost
- Share
UnrealizedLoss :
:
Brother-in-law, where have you gone? Why are you not here? I was looking for you everywhere, but I couldn't find you. Did something happen? Please let me know if you are okay.View More