Trade
Basic
Futures
Futures
Hundreds of contracts settled in USDT or BTC
TradFi
Gold
Trade global traditional assets with USDT in one place
Options
Hot
Trade European-style vanilla options
Unified Account
Maximize your capital efficiency
Demo Trading
Futures Kickoff
Get prepared for your futures trading
Futures Events
Participate in events to win generous rewards
Demo Trading
Use virtual funds to experience risk-free trading
Earn
Launch
CandyDrop
Collect candies to earn airdrops
Launchpool
Quick staking, earn potential new tokens
HODLer Airdrop
Hold GT and get massive airdrops for free
Launchpad
Be early to the next big token project
Alpha Points
Trade on-chain assets and enjoy airdrop rewards!
Futures Points
Earn futures points and claim airdrop rewards
Investment
Simple Earn
Earn interests with idle tokens
Auto-Invest
Auto-invest on a regular basis
Dual Investment
Buy low and sell high to take profits from price fluctuations
Soft Staking
Earn rewards with flexible staking
Crypto Loan
0 Fees
Pledge one crypto to borrow another
Lending Center
One-stop lending hub
VIP Wealth Hub
Customized wealth management empowers your assets growth
Private Wealth Management
Customized asset management to grow your digital assets
Quant Fund
Top asset management team helps you profit without hassle
Staking
Stake cryptos to earn in PoS products
Smart Leverage
New
No forced liquidation before maturity, worry-free leveraged gains
GUSD Minting
Use USDT/USDC to mint GUSD for treasury-level yields
More
FateDiary
No content yet
FateDiary
10.31 BTC Short-term Market Analysis | Seeking Opportunities Amidst Volatility
In the afternoon, the hourly chart of the pancake showed two consecutive bearish candles. After touching the upper Bollinger Band, it quickly retraced and is currently oscillating around the middle band position of 119500. The Bollinger Bands are in a contracted state, entering a range-bound oscillation pattern in the short term.
[Technical Signal]
🔸The trading volume continues to shrink, and the market sentiment is cautious.
🔸The MACD forms a death cross above the zero line, indicating a weakening of short-term u
BTC1.66%
- Reward
- like
- Comment
- Repost
- Share
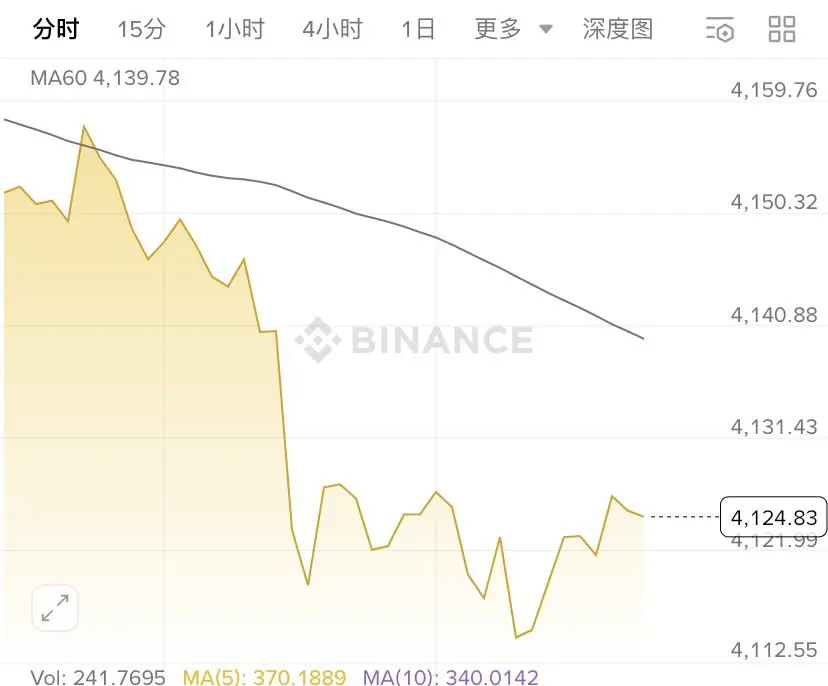
ETH today's trading strategy:
1. Breakthrough strategy: A volume breakout at 4122 allows for right-side long positions, with stop-loss recovery.
2. Breakout strategy: A volume breakout below 4093 can be used to short on the right side, with strict stop-loss.
3. Pullback to go long: If it retraces to 4050 and confirms support, you can try a small long position; stop loss if it breaks below 4010.
Key Position Analysis:
- After stabilizing at 4135 on the hourly level, look up to the 4180-4218 range.
- A stagnation near 4142 can be tested for short positions, with a stop loss at 4180.
- Trader
ETH0.91%
- Reward
- like
- Comment
- Repost
- Share
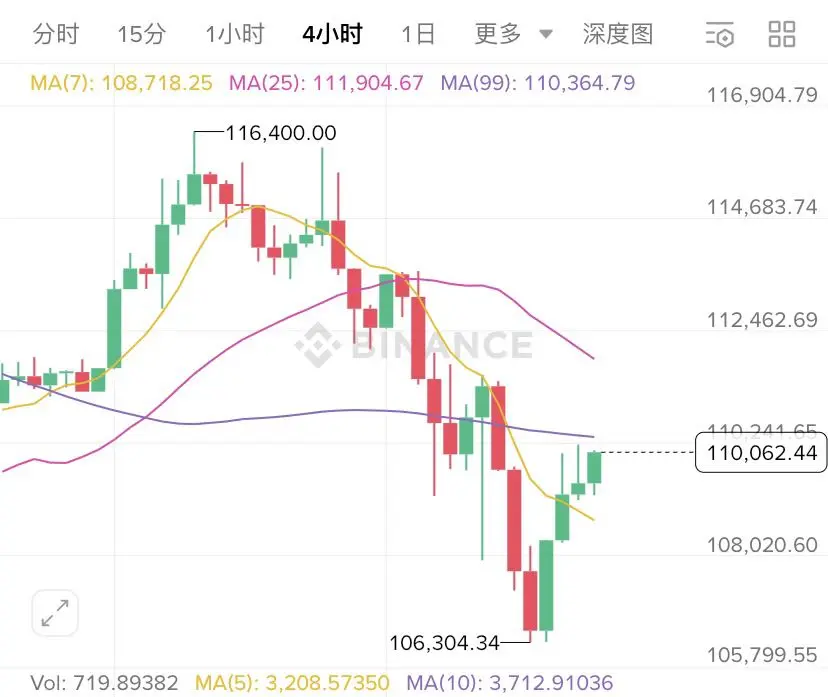
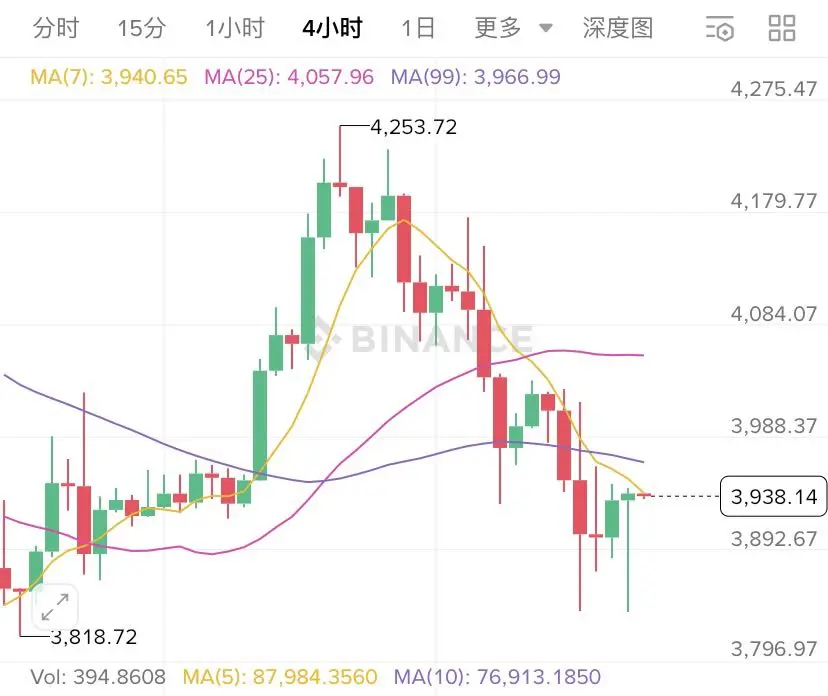
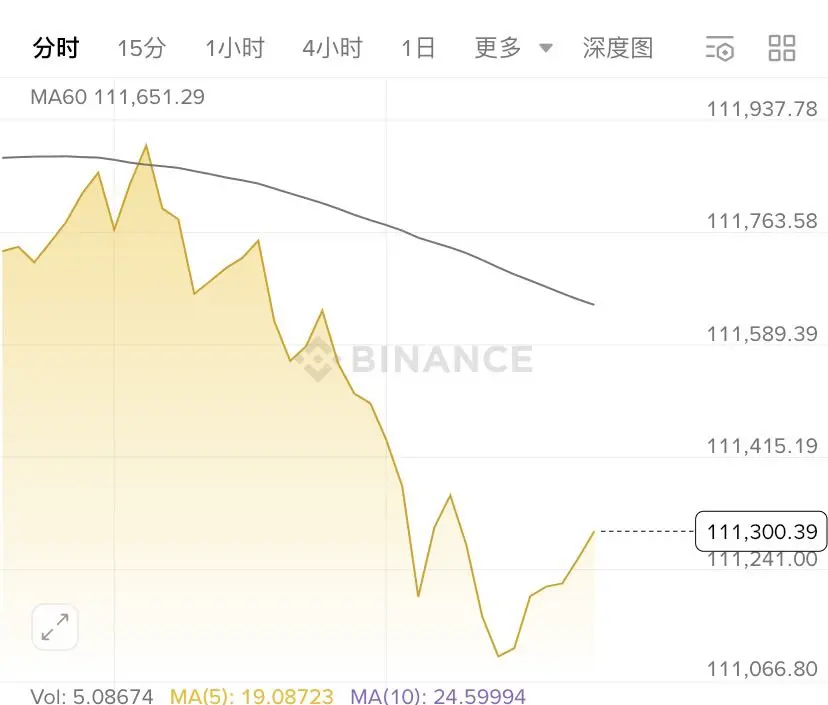
[BTC/ETH short order strategy update]
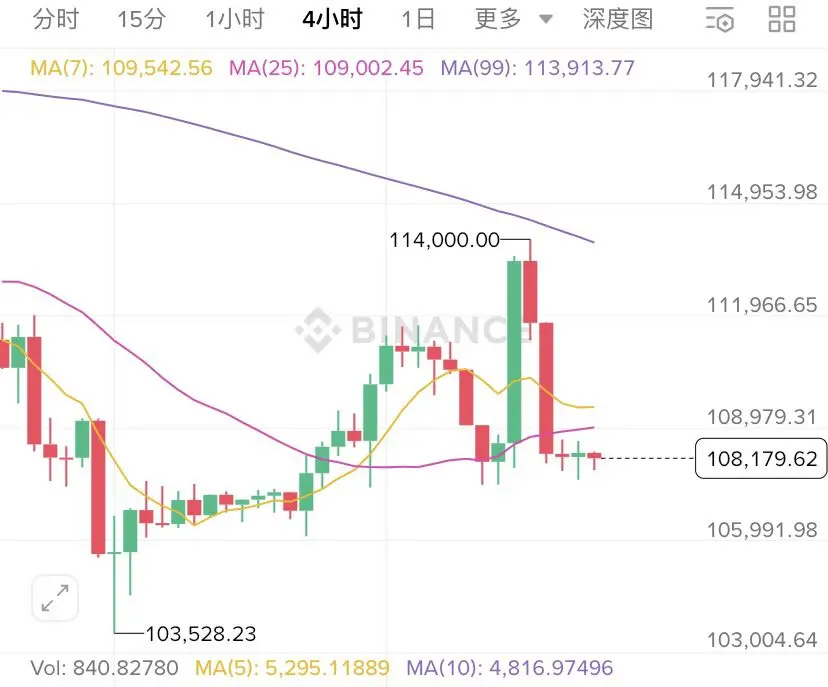
✅ Strategy effective: The short orders near 116,000 (BTC) and 4,250 (ETH) in the afternoon have made a profit, with the ETH short order yielding nearly 100 points.
Current judgment: In a wide oscillation, the downtrend has not ended and there is still room.
Main basis:
Hourly chart: Consecutive bearish candles, bears are dominant.
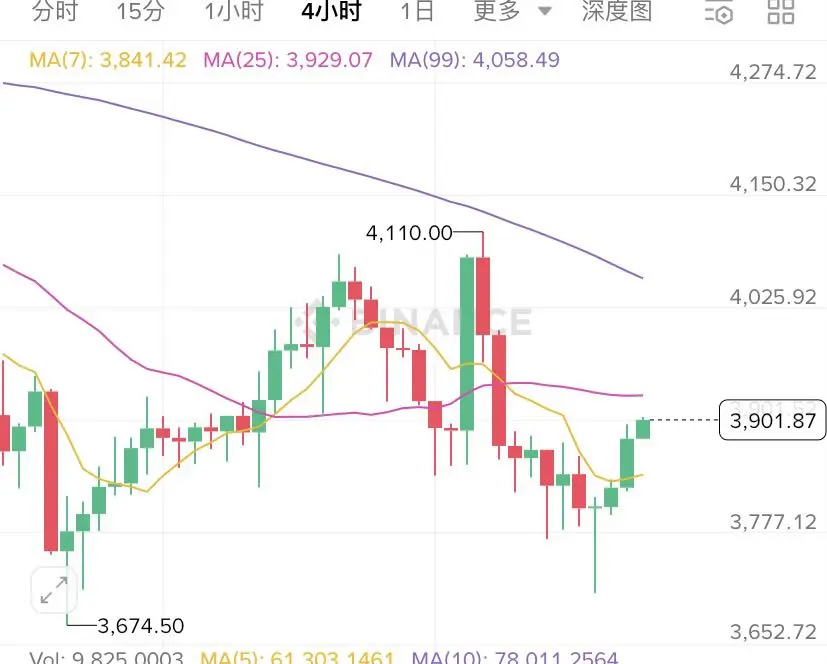
Four-hour chart: ETH surged and then fell back, forming a long upper shadow bearish candlestick, indicating a clear signal of trend weakening.
🎯 Operational suggestion: short order continues to be held, target looks towards th
View Original✅ Strategy effective: The short orders near 116,000 (BTC) and 4,250 (ETH) in the afternoon have made a profit, with the ETH short order yielding nearly 100 points.
Current judgment: In a wide oscillation, the downtrend has not ended and there is still room.
Main basis:
Hourly chart: Consecutive bearish candles, bears are dominant.
Four-hour chart: ETH surged and then fell back, forming a long upper shadow bearish candlestick, indicating a clear signal of trend weakening.
🎯 Operational suggestion: short order continues to be held, target looks towards th
- Reward
- like
- Comment
- Repost
- Share
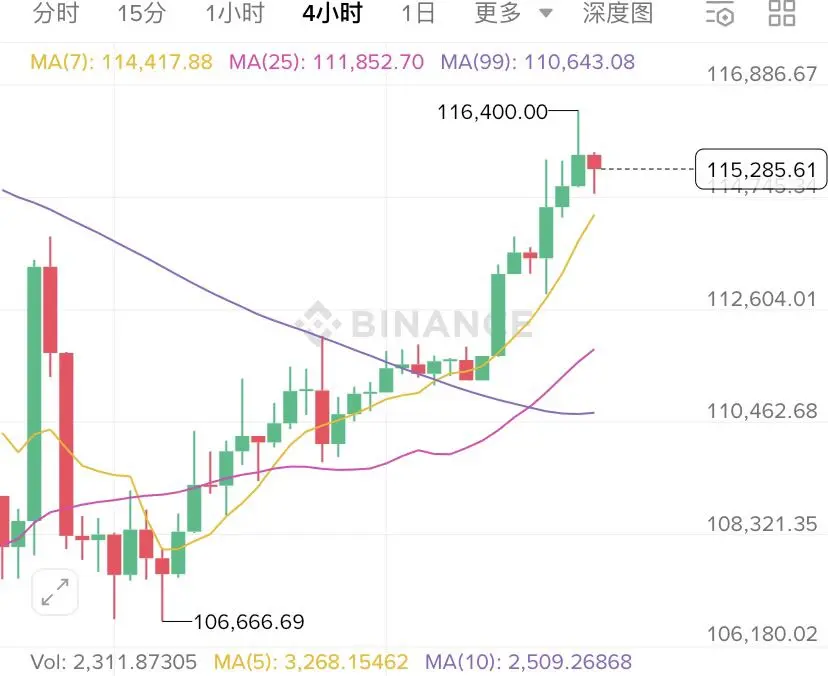
BTC 110,000 key point fierce battle! Bull vs Bear Battle is astonishing, should we charge now?
Family! Today's Bitcoin market is really exciting, fluctuating around the 110,000 mark, those holding positions are probably sweating in their palms 🤯
Core data first (as of 18:38):
• Real-time price: $110959.15, up 0.43% from yesterday.
• 24H Amplitude: $109700.01 - $112104.98, fluctuation over $2000
• Market Sentiment: Fear and Greed Index at 70, still hovering in the "Greed" range
This wave of high-level fluctuations hides a lot of signals. On-chain data shows that whales are quietly offloadi
BTC1.66%
- Reward
- like
- Comment
- Repost
- Share
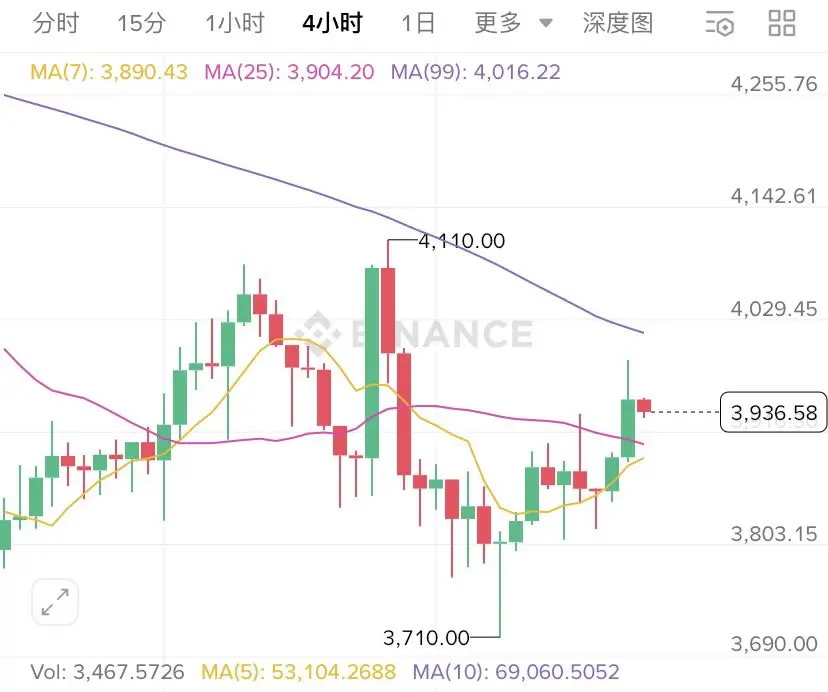
ETH analysis is here! 📉
Operational strategy for short position layout in segments
Entry range: around 3960-3985
Target Price Level:
The first target is aimed at around 3800, and the second target is aimed at around 3770.
After reaching the target area, decide whether to continue holding or adjust the strategy based on the market situation.
Reminder:
- If the rebound is strong, it may test higher positions, but the overall idea is to focus on short positions.
- After reaching the target position, pay attention to the support situation and make flexible decisions. #eth #以太坊
ETH0.91%
- Reward
- like
- Comment
- Repost
- Share
10.23 ETH market analysis and trading strategy
This afternoon, ETH is in a clear bullish rebound cycle. Previously, the price dipped to the key position of the lower Bollinger Band and quickly triggered a strong rebound. The validity of support in that area has been confirmed, becoming the core support for the current market rebound, and the signal for a proactive counterattack by bulls is very clear.
From a technical indicator perspective, short-term momentum is performing well: the KDJ indicator has successfully formed a golden cross pattern, further reinforcing the trend characteristics dom
ETH0.91%
- Reward
- like
- Comment
- Repost
- Share
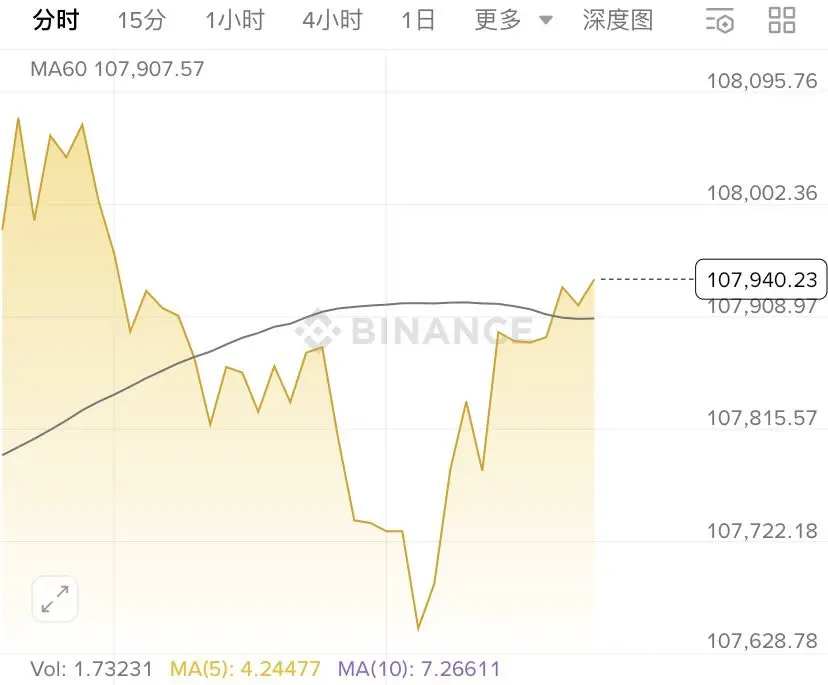
The market today shows significant low volatility characteristics, with prices oscillating in a narrow range, and both bulls and bears have not shown a clear direction. Trading activity and opportunities have decreased simultaneously, resulting in a relatively bland trading experience. Bitcoin maintained an overall narrow consolidation pattern during the period, with the early session price reaching the key point of 108,632 before facing resistance and pressure, subsequently entering a slight retracement channel. Until the afternoon, the price touched the support level of 107,621, then halted
BTC1.66%
- Reward
- like
- Comment
- Repost
- Share
10.21 midday market view | Bitcoin key level analysis
*BTC operation strategy:
✅ Long signal:
- If the volume breaks through 110020 and the hourly close is stable, you can chase long on the right side (stop loss if it breaks down)
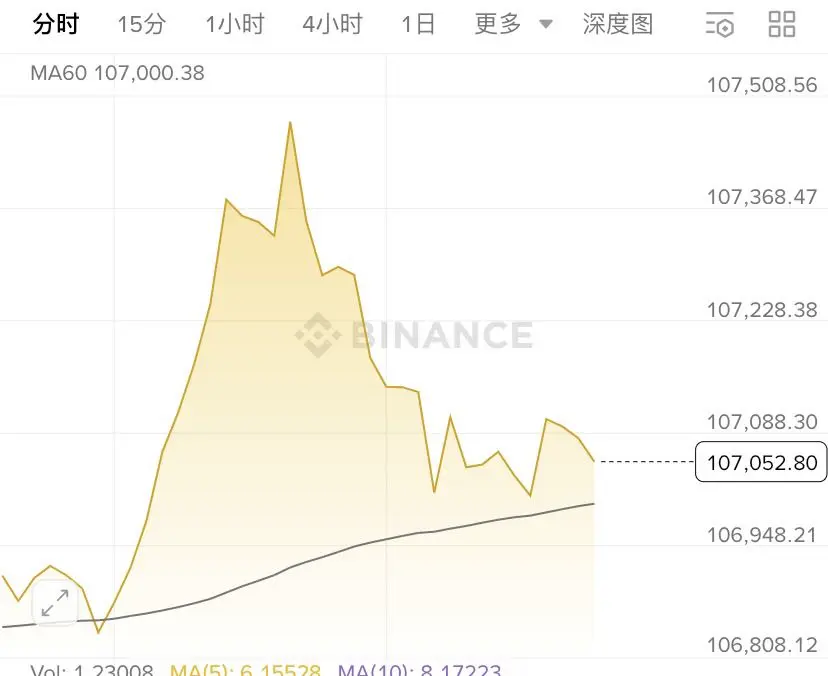
- A false breakdown occurred when it pulled back to 107375 and quickly recovered, allowing for a light long position (stop loss reference at 106368).
⚠️ Short signal:
- Break below 109433 and the rebound cannot be recovered, you can short on the right side (recover stop loss)
- A 2B false breakout pattern appears at 111309, you can short with a small position (set a
*BTC operation strategy:
✅ Long signal:
- If the volume breaks through 110020 and the hourly close is stable, you can chase long on the right side (stop loss if it breaks down)
- A false breakdown occurred when it pulled back to 107375 and quickly recovered, allowing for a light long position (stop loss reference at 106368).
⚠️ Short signal:
- Break below 109433 and the rebound cannot be recovered, you can short on the right side (recover stop loss)
- A 2B false breakout pattern appears at 111309, you can short with a small position (set a
BTC1.66%
- Reward
- like
- Comment
- 1
- Share
BTC Market Analysis: The 108,000 level is key for reversal, while the 103,400 bottom is in doubt.
The BTC market has not yet seen a clear reversal signal, with the key premise being the failure to stabilize above the critical price level of 108000. Looking back at yesterday's performance, BTC dipped to a low of 103400, showing a significant decline for the day; however, the market then began to rebound, and as of now, it has risen to around 107500, achieving a rebound of 4000 points, which is commendable in the short term. But this does not mean that 103400 is the final bottom of this adju
The BTC market has not yet seen a clear reversal signal, with the key premise being the failure to stabilize above the critical price level of 108000. Looking back at yesterday's performance, BTC dipped to a low of 103400, showing a significant decline for the day; however, the market then began to rebound, and as of now, it has risen to around 107500, achieving a rebound of 4000 points, which is commendable in the short term. But this does not mean that 103400 is the final bottom of this adju
BTC1.66%
- Reward
- like
- Comment
- Repost
- Share
short-term trading strategy for BTC
Technical Analysis: 106500 is a key support level; holding steady could form a bottom. 109000-110000 is a strong resistance zone. The 4-hour chart shows a MACD golden cross and an RSI rebound, indicating short-term support for a bounce.
Operation: Buy in batches at 106300-106800, stop loss at 105800; take profit first target at 108500 (reduce position), then look at 109500-110000. If it falls below 105800, need to stop loss and exit. #BTC #web3 #比特币
BTC1.66%
- Reward
- like
- Comment
- Repost
- Share
10.16 BTC/ETH Market Research Report|Key Levels Set the Direction, Trading Strategy Remains Unchanged
The Bitcoin price of 11.35 and the Ethereum price of 4200 that was mentioned yesterday for the pullback order can now secure some profits 📉 The core structure and trading strategy remain unchanged, just keep an eye on the key levels.
$BTC: 10.95 is a short-term trading strategy watershed.
The daily chart is still in a bearish oscillation pattern, but 10.95 is a clear support turning point, and chasing the short position at the support level is not advisable. The daily chart has formed upper a
View OriginalThe Bitcoin price of 11.35 and the Ethereum price of 4200 that was mentioned yesterday for the pullback order can now secure some profits 📉 The core structure and trading strategy remain unchanged, just keep an eye on the key levels.
$BTC: 10.95 is a short-term trading strategy watershed.
The daily chart is still in a bearish oscillation pattern, but 10.95 is a clear support turning point, and chasing the short position at the support level is not advisable. The daily chart has formed upper a
- Reward
- 1
- Comment
- Repost
- Share
October 15 | The market is gradually warming up, and a rebound may be on the way.
🚩Today's Market Dynamics:
🔶 BTC: The big pie has tested the bottom twice, and the current price has not fallen below the previous low, gaining support at the 110,000 level. The next resistance level is 115,800. After such a drastic deleveraging process, such opportunities are rare, and the main force is likely to use this to push up.
🔶 ETH: After briefly dropping below the lower boundary of the 4800-4000 fluctuation range, it quickly rebounded, with 4000 still being a key defensive level for bulls. We co
View Original🚩Today's Market Dynamics:
🔶 BTC: The big pie has tested the bottom twice, and the current price has not fallen below the previous low, gaining support at the 110,000 level. The next resistance level is 115,800. After such a drastic deleveraging process, such opportunities are rare, and the main force is likely to use this to push up.
🔶 ETH: After briefly dropping below the lower boundary of the 4800-4000 fluctuation range, it quickly rebounded, with 4000 still being a key defensive level for bulls. We co
- Reward
- like
- Comment
- Repost
- Share
10.14 Crypto Assets Market Analysis
From the four-hour timeframe observation, the Bitcoin has rebounded to the middle track of the Bollinger Bands with a small consecutive positive candle pattern, entering a phase of alternating small downs and ups in a sideways trend. The process of market consolidation and correction is still ongoing. In the short term, attention should be paid to the support strength in the four-hour middle track area. Currently, the Bollinger Bands channel continues to narrow, indicating that the consolidation and correction period of the market is nearing its end. Subsequ
View OriginalFrom the four-hour timeframe observation, the Bitcoin has rebounded to the middle track of the Bollinger Bands with a small consecutive positive candle pattern, entering a phase of alternating small downs and ups in a sideways trend. The process of market consolidation and correction is still ongoing. In the short term, attention should be paid to the support strength in the four-hour middle track area. Currently, the Bollinger Bands channel continues to narrow, indicating that the consolidation and correction period of the market is nearing its end. Subsequ
- Reward
- like
- Comment
- Repost
- Share
10.13 Afternoon Analysis | Key Levels Analysis of Mainstream Tokens
On a macro level, the latest meeting minutes indicate a softening of the Federal Reserve's stance, and market expectations for interest rate cuts have further strengthened, presenting a positive macro environment.
In terms of technical trends, the daily MACD indicator shows that bearish forces are gradually weakening, and bullish forces are beginning to take the initiative, with the overall trend leaning towards bullish. However, it is important to closely monitor key support areas and be wary of potential false breakout s
View OriginalOn a macro level, the latest meeting minutes indicate a softening of the Federal Reserve's stance, and market expectations for interest rate cuts have further strengthened, presenting a positive macro environment.
In terms of technical trends, the daily MACD indicator shows that bearish forces are gradually weakening, and bullish forces are beginning to take the initiative, with the overall trend leaning towards bullish. However, it is important to closely monitor key support areas and be wary of potential false breakout s
- Reward
- like
- Comment
- Repost
- Share