Summary
-
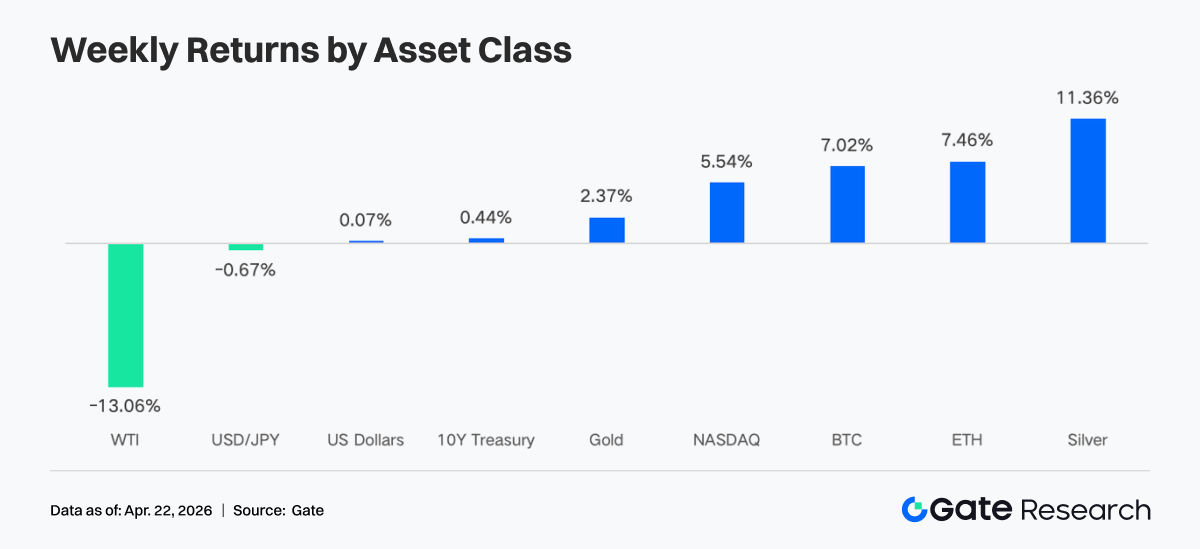
Over the past week, the market moved in a choppy upward trend amid easing geopolitical tensions and stable liquidity expectations. A sharp drop in oil prices, declining VIX, and a weaker USD jointly supported a recovery in risk appetite, driving crypto assets back into an upward range.
-
Liquidity conditions improved significantly, with both BTC and ETH ETFs recording strong net inflows. Institutional capital re-concentrated into leading products, favoring low-fee and high-liquidity instruments.
-
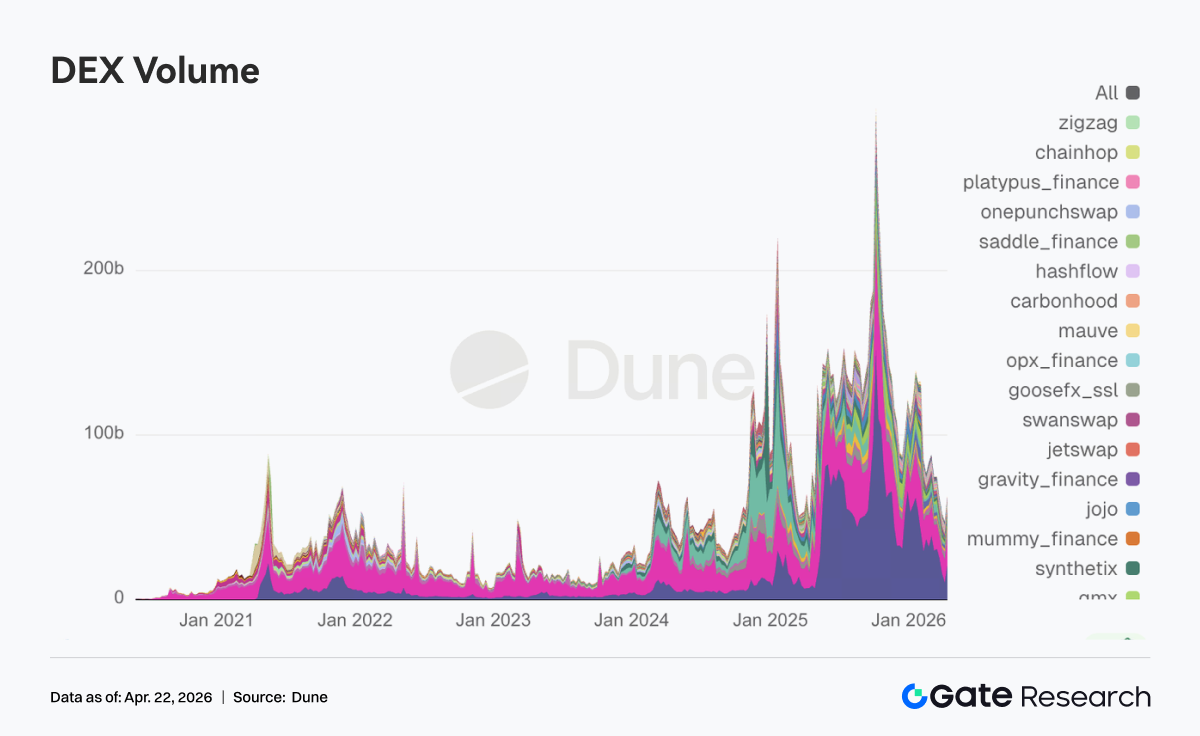
Trading structure showed an “energy-led, on-chain divergence” pattern. In TradFi, commodities like crude oil remained dominant, while on-chain activity rebounded with strong DEX volume growth.
-
Stablecoins and DeFi underwent internal rebalancing. Yield-bearing and protocol-based stablecoins saw outflows, while LST protocols attracted capital inflows.
-
Security incidents triggered chain reactions, leading to deleveraging and rising borrowing rates in lending protocols such as Aave.
-
Derivatives markets continued to exhibit a “crowded shorts but rising prices” pattern. Deeply negative funding rates diverged from price increases, indicating accumulating short squeeze potential.
1. Market Focus Analysis
The global crypto market showed volatility amid complex macroeconomic signals. On Friday, trade tensions eased, but attempts were made to reverse the situation on Saturday. Iran’s Foreign Minister Araghchi announced that the Strait of Hormuz was “fully open” to all commercial vessels during the ceasefire between Israel and Lebanon. Donald Trump quickly confirmed that the strait was “completely open and freely navigable.”
Optimism around a Middle East peace agreement led to a 10% plunge in oil prices. The crypto market rebounded, and ETFs continued to record net inflows. U.S. equities rallied from their lows and hit new all-time highs. The S&P 500 rose 11% in 11 trading days from its March 30 low, reaching a record 7,162 on Friday.
The VIX dropped sharply to 17.48, its lowest level since late February, indicating a meaningful repricing of war risk. The 10-year U.S. Treasury yield fell to around 4.28%, below April’s peak of 4.44%, while the U.S. Dollar Index fell below 98 for the first time since January.
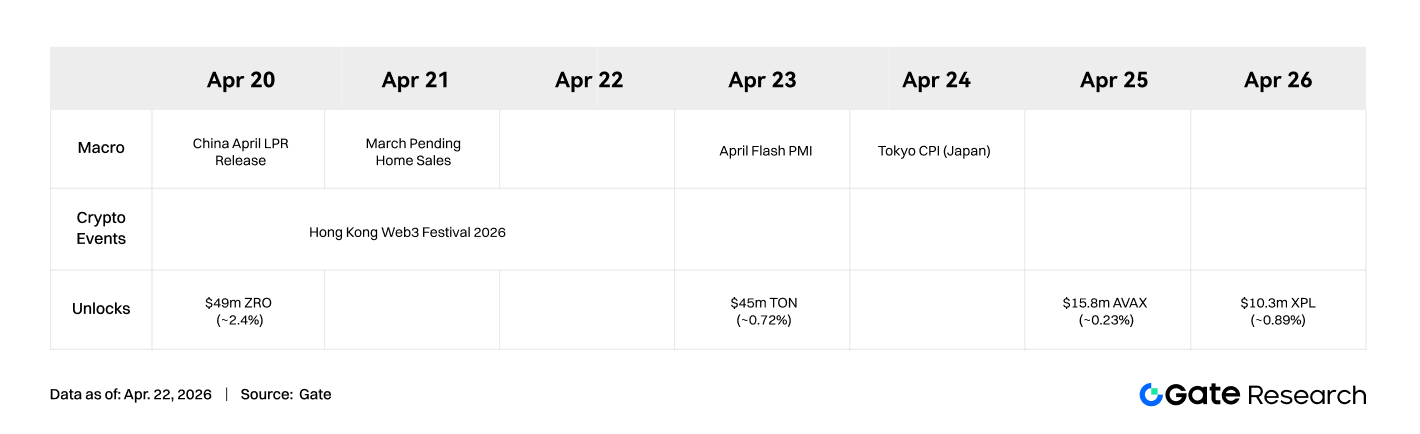
According to the IMF’s April 16, 2026 World Economic Outlook, global growth was revised down to 3.1% due to ongoing Middle East conflict and geopolitical spillovers, weakening liquidity expectations for risk assets. The Federal Reserve remains the key market driver. Markets are pricing a 98% probability that rates will remain unchanged at the April 29 FOMC meeting. Meanwhile, the April 21 confirmation hearing for Fed Chair nominee Warsh will influence near-term liquidity expectations.
2. Liquidity Analysis
1. BTC ETF Records Strongest Weekly Inflows in Months
Last week, BTC ETF flows showed sharp intraday volatility. Strong inflows were recorded on April 14 and 15, reaching $411.4M and $186.1M respectively. On April 17, amid a mix of risk-off and dip-buying sentiment, a remarkable single-day inflow of $663.9M was recorded.
Weekly net inflows:
From a comparative perspective, last week’s BTC ETF flows improved significantly compared to the previous week, marking the largest positive week since mid-January. Overall sentiment shifted rapidly between risk aversion and dip-buying, with bulls ultimately dominating.
Top BTC ETF inflows:
Top ETH ETF inflows:
-
FETH (Fidelity): $126.0M
-
ETHA (BlackRock): $99.2M
Institutional capital showed a clear concentration trend last week. BlackRock’s IBIT remained the primary inflow driver, attracting $906.0M in a single week, with cumulative net inflows approaching $64.63B. In contrast, Fidelity’s FBTC saw net outflows of $104.0M, indicating capital competition among institutional products. In Ethereum ETFs, Fidelity’s FETH led with $126.0M inflows, while Grayscale’s ETHE continued to face $16.67M in outflows. This divergence shows that institutional investors increasingly prioritize fee structures and liquidity depth.
Currently:
2. TradFi Liquidity
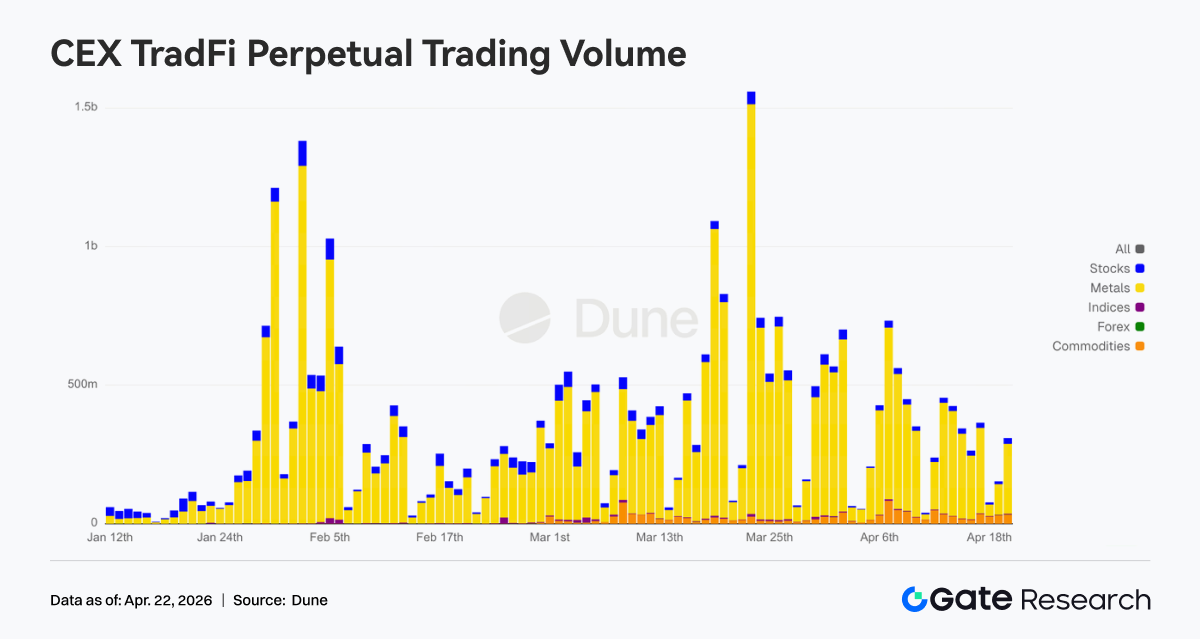
Over the past week, the trading structure of TradFi Perp DEXs has clearly tilted toward crude oil products. CL and Brent maintained high shares, although slightly lower than in the previous period, and still remained the dominant forces. Meanwhile, WTI saw a modest rebound, keeping the overall energy sector strong. In precious metals, the shares of gold and silver recovered somewhat but remained below their recent highs, indicating a marginal weakening in safe-haven demand. Equity indices and FX maintained relatively stable shares, with the market overall exhibiting a structure of “energy dominance with balanced supplementation from other assets.”
Over the past week, daily trading volume of CEX TradFi perpetuals mostly ranged between $250M and $450M, representing a clear decline from the early April peak of around $750M, and reflecting a contraction phase following high-level volatility. Structurally, metals remained the absolute dominant category, equities were the second-largest contributor, and the share of commodities has gradually increased since late March, while equity indices and FX remained relatively small in scale. Toward the end of the period, single-day volume rebounded to around $450M, indicating that after volatility convergence, capital remained concentrated in sectors such as metals, rotating within them. TradFi activity has gradually returned from extreme expansion to a more normalized trading rhythm.
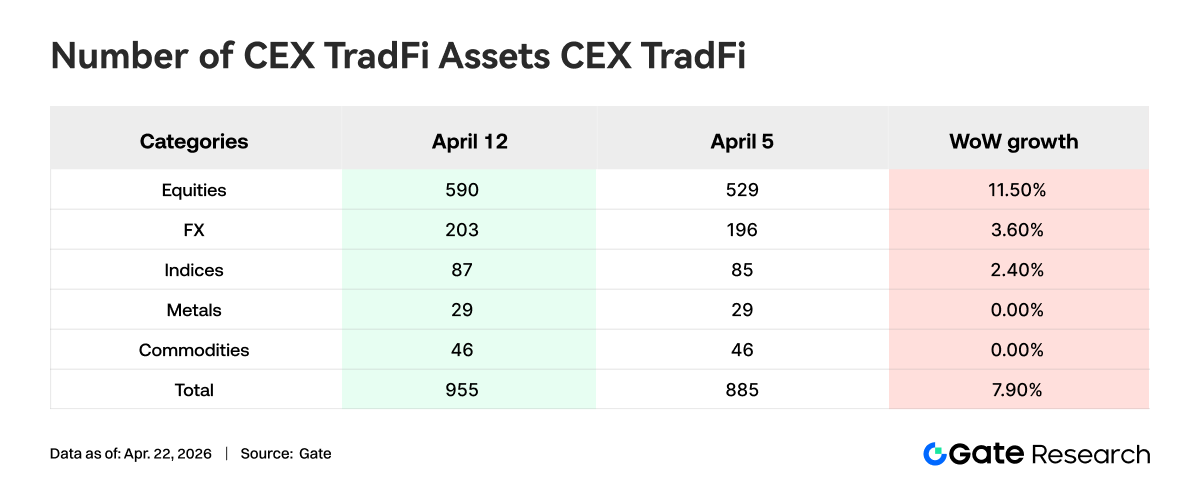
Over the past week, the number of TradFi asset categories on CEXs further expanded. Across three major CEXs, the total number of TradFi asset categories (counting only TradFi and CFD segments, excluding perpetual contracts) increased from 885 to 955, a week-over-week rise of 7.9%. Among them, equities saw the most significant growth, increasing from 529 to 590 (+11.5% WoW); Gate alone added 16 equity TradFi assets, a 6.5% increase.
We selected XAUT, the TradFi asset with the highest trading volume, to analyze its order book depth (Delta). Over the past week, within a ±1% price range, XAUT’s order book shifted from sell-side dominance to increasing buy-side depth. During the early-to-mid period, when prices declined and consolidated, liquidity delta was frequently significantly negative, with sell orders more concentrated near the current price. As the price rebounded from around $4,640 and consolidated at a higher range of $4,780–$4,820, delta turned predominantly positive. Notably, toward the end of the period, a positive spike of nearly $900K appeared, indicating a relative strengthening in near-term bid-side depth.
3. On-Chain Data Insights
1. BNB Chain Meme activity surged, PancakeSwap trading volume doubled
Represented by “Binance Life,” the trading heat and market capitalization of BNB Chain memes rose significantly. PancakeSwap’s single-week trading volume climbed to $21 billion, nearly doubling from the previous week, and returned to the number one position in DEX trading volume. At the same time, trading in major DEX pools such as Uniswap, Aerodrome, Curve, and Fluid also increased to varying degrees. There is still trading demand within Solana, and short-term speculation has not exited; it is just that active meme capital now prefers the BNB Chain network, which has a deeper degree of connection with exchanges.
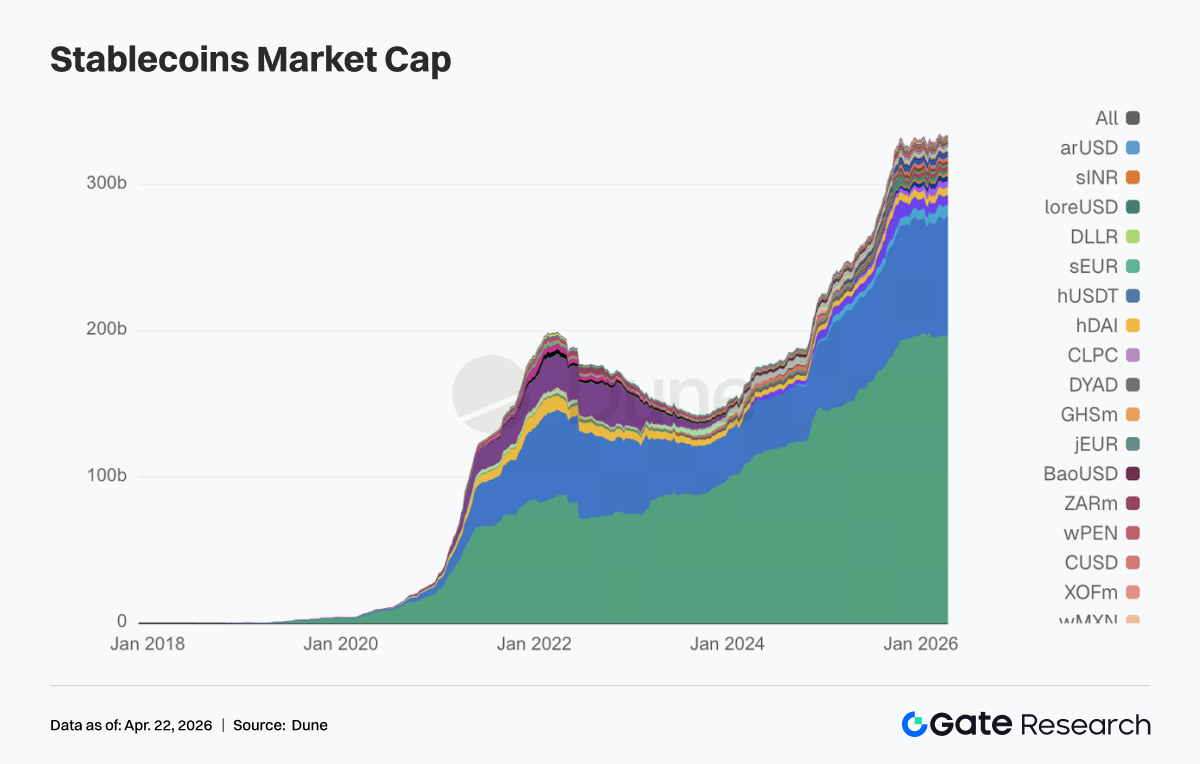
2. The stablecoin sector fluctuated at high levels, with some capital withdrawing from yield-bearing and protocol-based stablecoins
The total stablecoin supply did not undergo any sharp contraction, but internal rotation was very obvious. In other words, stablecoins that had attracted capital in the previous phase through yields were generally reduced this week. USDT increased by about $1.02 billion from the previous week; USDC, on the other hand, edged down slightly and did not expand alongside USDT. Possibly affected by the recent frequent security incidents, the pullback on the DeFi-native side was obvious. USDS fell from $8.56 billion to $7.80 billion, USDe pulled back from $6.70 billion to $6.41 billion, and DAI also declined slightly. However, payment-oriented and institutional-grade stablecoins were not affected, with both PYUSD and USDG posting slight growth.
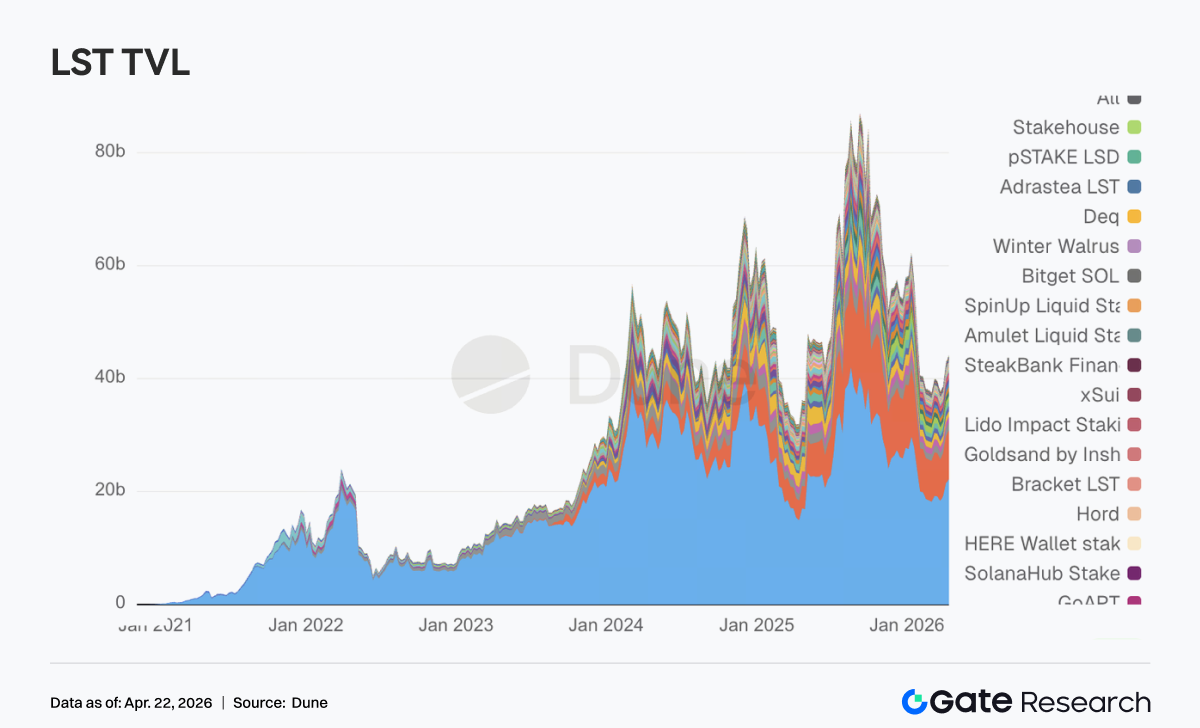
3. LSTs were not dragged down by the rsETH incident; capital instead moved toward leading protocols
Although the LRT protocol KelpDAO’s rsETH suffered a security incident involving nearly $300 million over the weekend, the LST sector was more resilient than expected, and most leading protocols moved up another step. On the ETH side, leading LSTs such as Lido and Rocket Pool each saw inflows in the hundreds of millions or tens of millions of dollars. On the SOL side, both Sanctum Validator LSTs and Jupiter Staked SOL grew, with only Jito seeing a slight pullback. This shows that DeFi market participants have become more mature and did not panic excessively; instead, they priced standardized staked assets separately from assets carrying cross-chain, cross-chain wrapping, and restaking leverage. What went wrong at KelpDAO was the risk chain combining LRTs such as rsETH with cross-chain bridges. Traditional ETH LSTs and mainstream SOL LSTs were not collectively treated as high-risk assets; on the contrary, they benefited from returning capital.
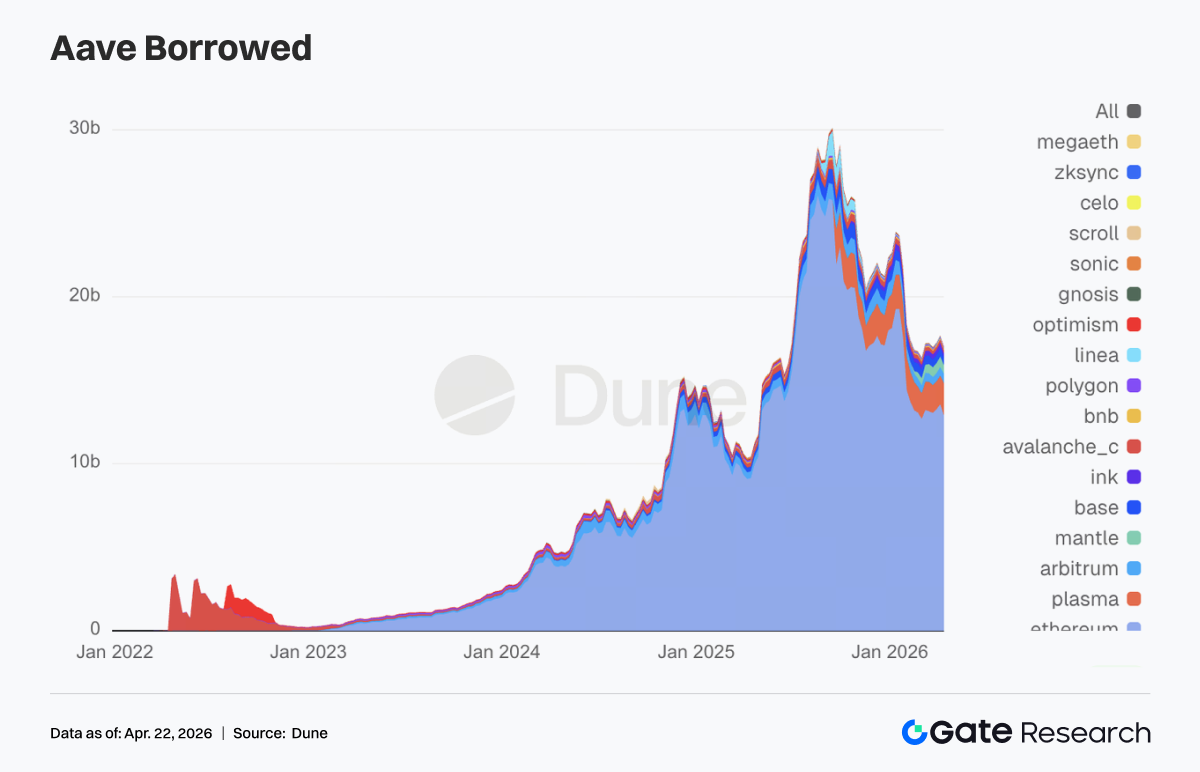
4. The KelpDAO incident significantly impacted Aave, and lending capital withdrew from the main markets
Aave’s total loan balance fell significantly, ending its steady upward trend. In the lending scenarios of core networks such as Ethereum main market, Mantle, and Base, deleveraging worth hundreds of millions of dollars occurred. Over the weekend, Aave froze rsETH collateral and imposed protective restrictions on WETH across Core, Prime, Arbitrum, Base, Mantle, and Linea. Although Aave’s contracts themselves were not breached, and the source of the problem lay in KelpDAO’s rsETH cross-chain bridge, Aave, as the largest lending liquidity pool, bore the most direct chain reaction. Further market concerns were triggered by the possibility that hackers had extracted hundreds of millions of dollars using rsETH as collateral, potentially creating bad debt. Precisely because of this, the V4 Hub-and-Spoke risk isolation framework previously promoted by Aave Labs suddenly shifted this week from being an architectural upgrade to a real market repricing need.
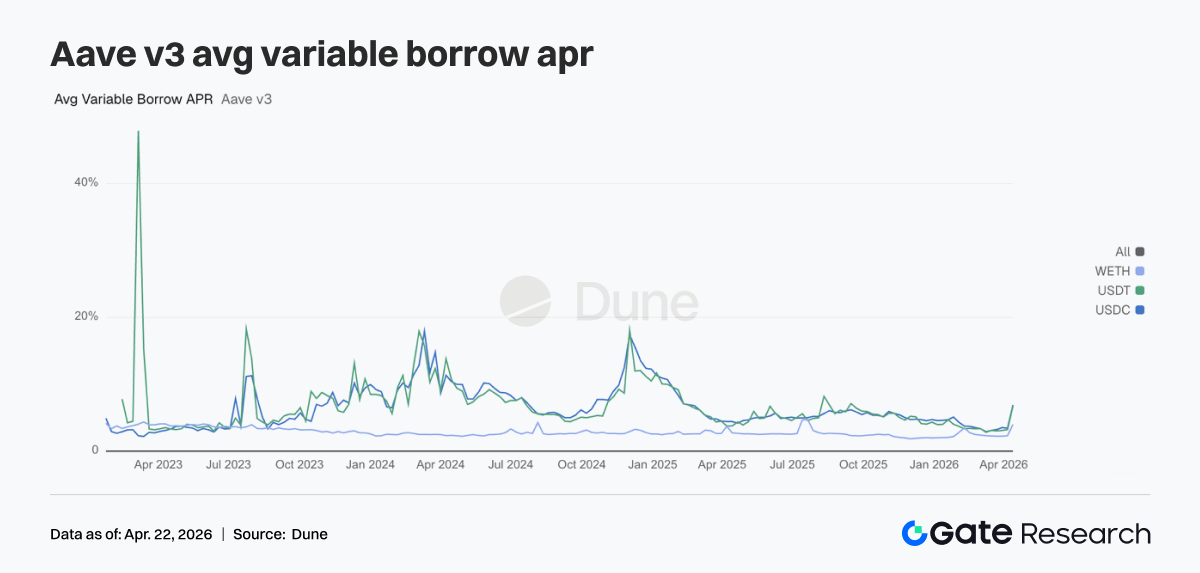
5. The security incident triggered a chain reaction, sending borrowing rates for Aave’s three core assets sharply higher
What the rate side reflects is the instant tension when the shock occurs. The average floating borrowing APR for USDC jumped directly from 3.42% to 6.91%, USDT rose from 3.22% to 6.76%, and WETH also climbed from 2.29% to 4.00%. After the rsETH incident, because Aave had to bear bad debt and market panic spread, liquidity and funds were rapidly withdrawn from Aave. The available depth of WETH and stablecoin pools in the main markets suddenly became thin, and utilization even reached 100%, leaving almost no liquidity. Aave’s risk team then made emergency adjustments to the WETH interest rate models on Arbitrum, Base, Mantle, and Linea, cutting the full-utilization borrowing cost from 8.5%–10.5% to 3%, which in turn confirmed just how tight pool liquidity had become at the time. This week’s surge in rates precisely reflected the full projection of an external black swan event penetrating into Aave’s funding rates.
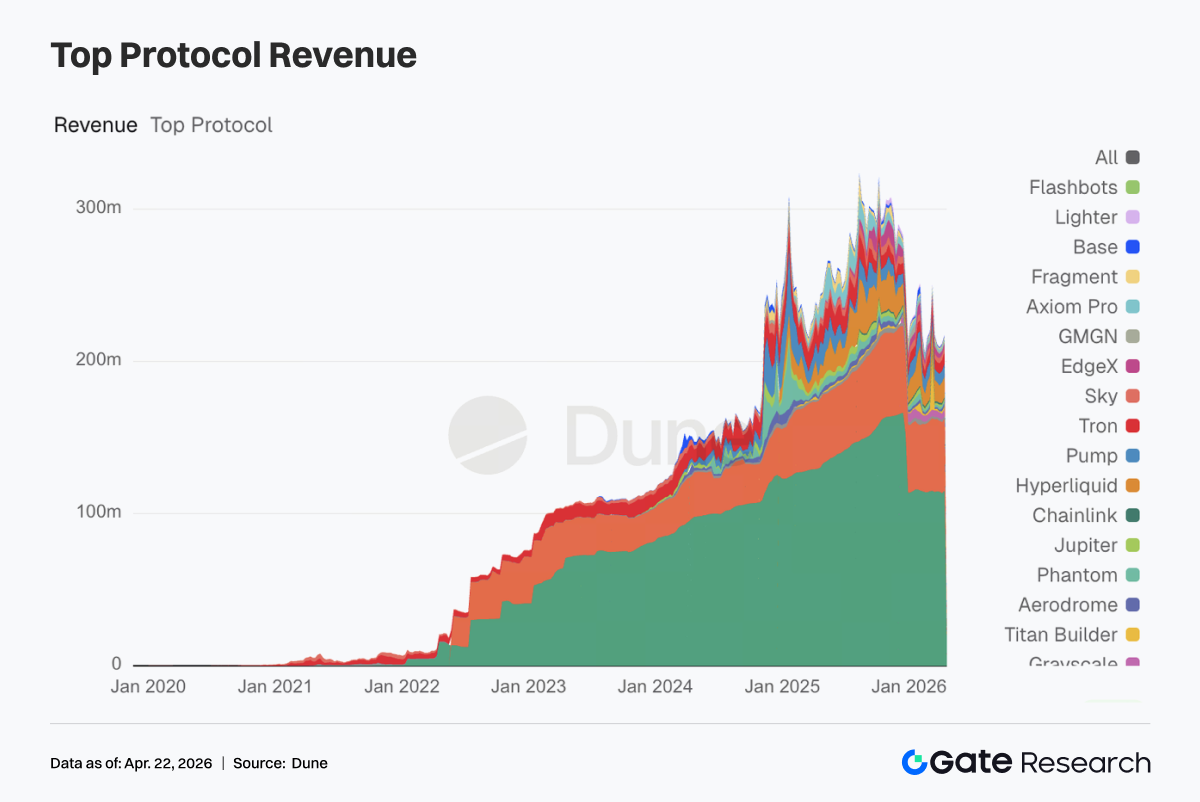
6. Revenue at leading protocols remained resilient, while Aave showed clear stress-driven earnings characteristics
Tether and Circle still ranked first and second, and the stablecoin issuance side remained the most stable source of cash flow. Hyperliquid and Pump maintained revenue near the previous week’s high levels, showing that on-chain trading still had elasticity. Aave’s revenue reached $2.02 million this week, a very significant increase from the previous week, but this was stress-driven income after liquidity was squeezed, with relatively limited sustainability. Protocols such as Aerodrome and Titan Builder, each with weekly revenue reaching $1 million, also posted growth, showing that market capital has not left trading.
4. Derivatives Tracking
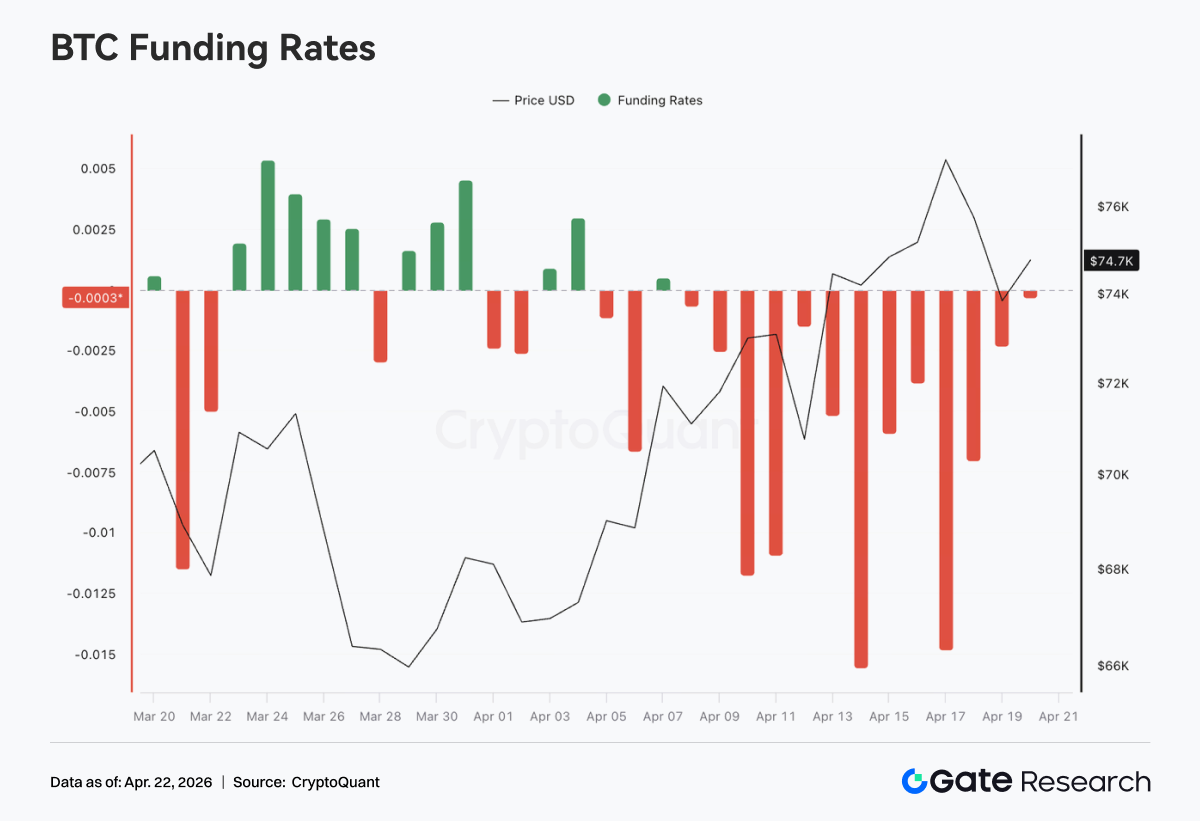
4.1 BTC funding rates remained deeply negative, while price moved up in a volatile manner and hit a new local high
Over the past week, BTC funding rates overall remained in negative territory, and around mid-April there were multiple episodes of extreme negative readings, with the lowest approaching -0.015. This shows that bearish sentiment in the perpetual futures market continued to dominate and short crowding remained elevated. Correspondingly, after experiencing an earlier pullback, price gradually moved up from around the 70K area and at one point rose to near 76K, overall showing a typical divergence structure of “deeply negative funding rates but continuously strengthening price.” This structure means shorts were continuously paying funding while also bearing the pressure of rising prices, with short squeeze momentum continuously building up. The price increase was driven more by spot buying or passive short covering.
From the rhythm perspective, after April 10, funding rates clearly turned to a deeper negative range, while price accelerated upward and made a new local high. This indicates that during the breakout, shorts did not stop out in any obvious way, and may even have added to positions against the trend, further strengthening the potential elasticity of a squeeze. Overall, the current market is in a phase where bearish sentiment dominates but price performance remains strong. The derivatives side remains persistently bearish, while spot or structural buying provides support. Under this highly divergent structure, if price stays at high levels or moves further upward, short covering may accelerate the rally. At the same time, however, persistently strong negative funding also means that if price pulls back, leveraged shorts already have a certain cushion, so short-term volatility may increase significantly.
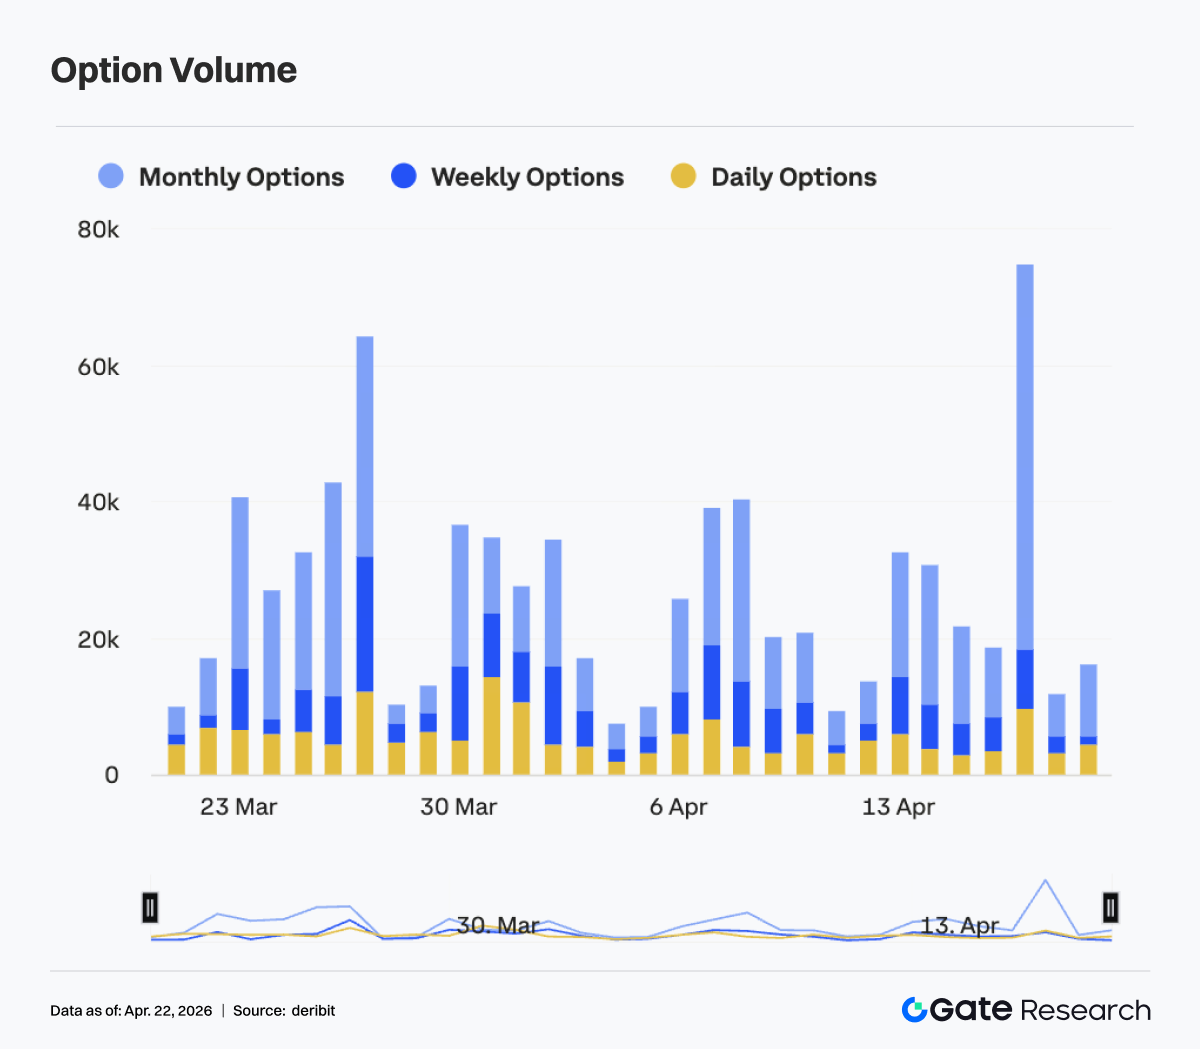
4.2 BTC options structure repaired quickly, with stronger short-end elasticity and a temporary flattening
Between April 13 and April 19, implied volatility across BTC options generally moved up noticeably, with the structure gradually repairing from the previously relatively steep discount state. Specifically, mid- and short-dated option IVs such as 7D, 30D, and 60D were still at local lows around April 13, at approximately the -6 to -8 range, but then rose rapidly and collectively moved up to around -3 to -4 near April 17, showing significantly stronger volatility elasticity. By contrast, the increase in long-dated IVs such as 90D and 180D was relatively limited, and the overall curve showed a clear flattening pattern, indicating that the market significantly raised its pricing of short-term volatility.
Structurally, around April 17, the short end was at one point clearly above the medium and long end, and the options structure briefly showed signs of inversion, reflecting a rapid warming of expectations for short-term event-driven moves or price volatility. Such a sharp rise in short-end IV usually corresponds to a phase of accelerated market moves or concentrated release of uncertainty. At the trading level, it is more reflected in chasing gamma and rising short-term hedging demand.
However, after April 18, as short-end IV quickly fell back, with 7D retracing clearly, the structure returned to a slight positive slope, indicating that short-term sentiment cooled somewhat and that previously concentrated volatility expectations were starting to be partially realized or digested. Overall, the current IV options structure has gone through a process of “deep discount -> rapid repair -> short-end overheating -> rebalancing.” In the short term, the market has rapidly switched from extremely compressed volatility expectations to a repricing of volatility. Structurally, this reflects trading capital rapidly switching risk preferences over short cycles. In the near term, attention is still needed on whether price volatility converges along with IV pullback, or whether it triggers another round of amplified volatility.
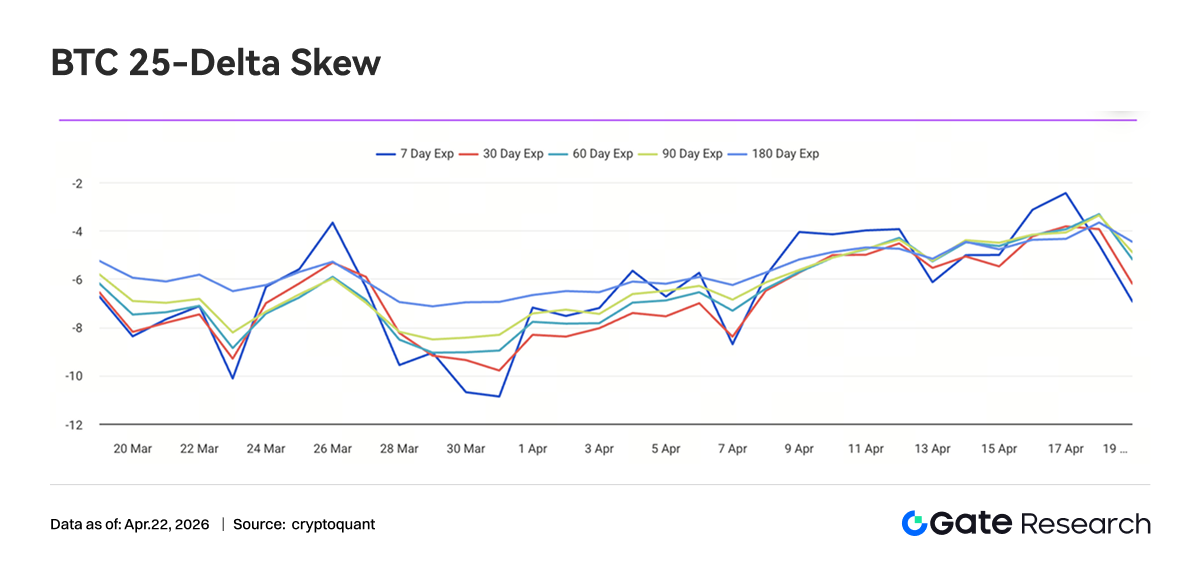
4.3 BTC 25-Delta Skew rose clearly, and tail-risk pricing continued to converge
Between April 13 and April 19, BTC 25-Delta Skew across all maturities remained in negative territory overall, but the center clearly moved upward, mainly distributed in the -6 to -3 vol range. Compared with the extreme level below -10 reached at one point in late March, the current skew has clearly repaired by about 3 to 5 vol points, showing that although put premium still dominates, the market’s pricing of downside tail risk is continuing to converge.
From the term structure perspective, short-dated skew (7D) fluctuated most violently, and around April 17 it rapidly rose to near -2, clearly above the medium- and long-dated levels. This reflects a rapid cooling in short-term demand for protective puts, and even signs of temporary de-hedging. Meanwhile, medium- and long-dated skew from 30D to 180D was relatively stable, basically remaining in the -5 to -3 range. Although it also rose in sync, it still did not leave negative territory overall, indicating that the market still retains a certain defensive allocation over the medium and long term.
Structurally, this round of skew rise resonated with stronger prices and compressed volatility: during the continued price rise, marginal demand for downside protection declined, and put premium was gradually compressed, but a positive skew structure dominated by call premium has not yet emerged. This means current market sentiment has shifted from “strong defense” to “weak defense,” but has not yet entered a full risk-on release phase.
Overall, BTC skew has returned from extreme safe-haven pricing to a relatively neutral but still defensive range, and tail-risk premium has declined significantly. If price remains strong in the short term, skew may still have room to repair further toward the -2 to 0 range. But against the backdrop of long-dated skew still remaining negative, institutional capital has not yet fully turned aggressive, and the market as a whole is still in a transition stage of “reduced hedging but not fully removed.”
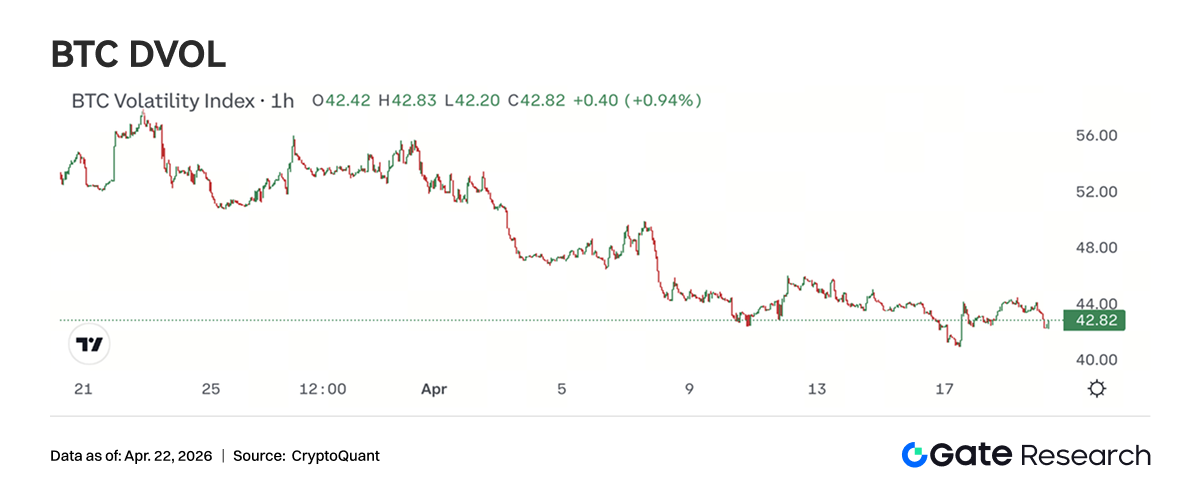
4.4 DVOL continued to fall back into a low range, and volatility premium further converged
Between April 13 and April 19, BTC DVOL generally maintained a volatile downward trend, gradually falling from above 45 to near 42. Although there was a slight rebound around April 13, it failed to form a trend-like rise, and then continued to decline, touching a local low around April 17 at about 41. Current DVOL is already clearly below early-April levels and is approaching a local low range, showing that the market’s risk premium for short-term volatility continues to be compressed.
Structurally, this round of DVOL decline was not accompanied by obvious sharp price swings, but was gradually compressed during a volatile price rise, reflecting the market’s consensus expectation of “trend-like上涨 but low volatility.” Compared with earlier volatility pulses driven by events, such as rapid short-term spikes, the current DVOL pullback has been smoother, indicating that the market’s pricing of sudden risks has clearly dulled and volatility premium is being systematically reduced. DVOL is now gradually approaching the edge of the 40–45 low-volatility range; if it falls further, it will enter a historically relatively low level. Against this backdrop, short-volatility strategies such as short straddles and short strangles still dominate, but as DVOL continues to compress, their profit space is narrowing and marginal cost-performance is declining.
5. Outlook
Sources:
-
Investing, https://investing.com/currencies/xau-usd-historical-data
-
Gate, https://www.gate.com/trade/BTC_USDT
-
CMC, https://coinmarketcap.com/real-world-assets/?type=all-tokens
-
Coinglass, https://www.coinglass.com/pro/depth-delta
-
Dune, https://dune.com/gateresearch/gate-tradfi#weekly-volume
-
Dune, https://dune.com/gateresearch/gate-institutional-weekly-report
-
Bybit, https://www.bybit.com/future-activity/en/tradfi
-
Bitget, https://www.bitgettradfi.com/tradfi/XAUUSD
-
CryptoQuant, https://cryptoquant.com/asset/btc/chart/derivatives
-
Amberdata, https://pro.amberdata.io/options/deribit/btc/current/
Gate Research is a comprehensive blockchain and cryptocurrency research platform that provides deep content for readers, including technical analysis, market insights, industry research, trend forecasting, and macroeconomic policy analysis.
Disclaimer
Investing in cryptocurrency markets involves high risk. Users are advised to conduct their own research and fully understand the nature of the assets and products before making any investment decisions. Gate is not responsible for any losses or damages arising from such decisions.