Summary
-
Over the past month, total stablecoin market cap has surpassed $320B and continues to expand, while RWA scale has grown in parallel. Capital is increasingly staying on-chain rather than flowing into exchanges.
-
Overall on-chain activity has declined. Solana still records the highest transaction count, but saw a notable drop in April. Base and Polygon both experienced declines in transactions and active addresses, while Ethereum saw rising fees despite lower activity.
-
Security incidents involving Drift and KelpDAO in April triggered large-scale capital migration and deleveraging. This pushed up mainnet fees and lending rates, and had a clear impact on cross-chain net flows.
-
On the price side, BTC and ETH rebounded significantly and returned to the cost basis range for most holders, while on-chain activity and TVL have yet to recover in tandem.
From March 1 to mid-to-late April 2026, Solana firmly held its position as the most active chain. Base and Polygon maintained resilience as low-cost execution layers, while Arbitrum saw an uptick in cross-chain net inflows. However, deeper data signals that capital on-chain is becoming more directional. The key question is no longer which chain is the most active, but which can convert liquidity into sustained usage and revenue, and which can continue to absorb assets even after security incidents.
In terms of actual usage, Solana recorded an average of 118.2M daily transactions in March and 88.26M in April, still far ahead of others. Ethereum mainnet saw daily transactions edge down from 2.21M to 2.15M, while fees rose from $342.9K to $460.8K. Base posted a 11.28% increase in TVL from March 1 to April 22, but turned negative in cross-chain net flows in April, indicating that its TVL growth was driven more by internal asset rotation rather than new external inflows. Arbitrum’s net inflows expanded to $437.6M in April, but this was partly linked to the April 18 KelpDAO bridge exploit, where abnormal capital movements created the appearance of inflows.
Changes in stablecoins and RWA assets are equally important. Around March 13, total stablecoin market cap reached a new high of $320.9B. On March 17, on-chain RWA value climbed to $27.14B. Stablecoins continue to remain on-chain, while RWAs are expanding on-chain, gradually aligning settlement assets with yield-bearing assets. Moving into April, Circle conducted multiple large-scale USDC mints on Solana, including $3.25B in the week of April 6, followed by another $550M on April 7, and an additional $250M on April 16. Demand for high-efficiency execution layers remains intact, but deployment speed is currently outpacing the rate at which real yield can be absorbed.
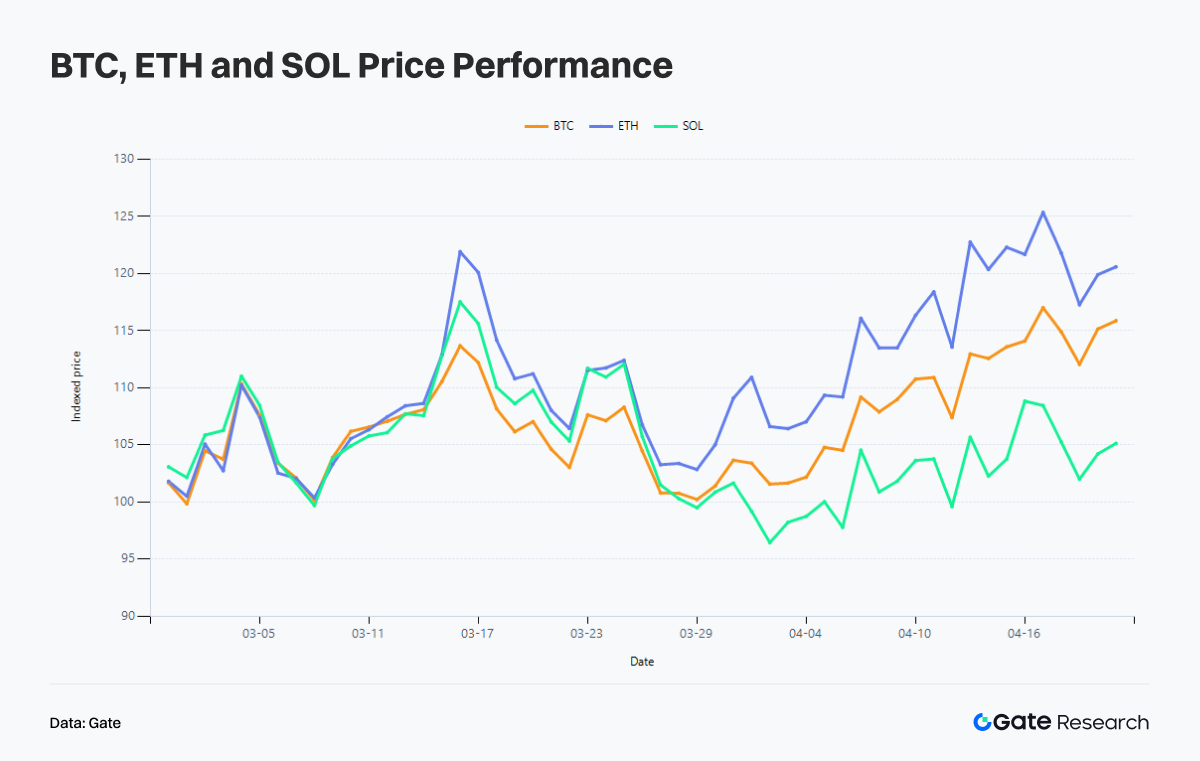
On the BTC side, price recovery has outpaced on-chain expansion. During the period, BTC rose 15.86%, ETH gained 20.58%, and SOL increased 5.13%. By mid-to-late April, BTC added approximately 277K new addresses, and around 75.7% of addresses returned to profit. The cost basis for holdings between one and three months is concentrated around $74.2K, with price now back within the comfort zone for most holders.
Throughout this period, frequent DeFi security incidents reshaped market perception. High activity no longer implies high quality, and strong net inflows do not necessarily reflect genuine preference. The April 1 Drift exploit and the April 18 KelpDAO incident both triggered large-scale reassessments of cross-chain risk and collateral quality. In March, the market was still willing to chase high-frequency interactions. By April, attention shifted toward the origin of liquidity, sources of yield, bridge reliability, and the final destination chain for capital.
I. Overview of On-chain Activity and Capital Flows: Capital Begins to Reject Inefficient Activity
During the period, on-chain activity did not enter a broad cooldown phase. At the same time, capital is clearly differentiating between real demand and short-term noise. This divergence first becomes visible across four core metrics: transaction count, active addresses, fees, and cross-chain net flows.
I.1 Transaction Count: Solana Remains Dominant, but Slows in April

From a transaction count perspective, Solana remains the clear leader. In March 2026, Solana recorded an average of 118.2M daily transactions, while April averaged 88.26M, a 25.33% decline MoM. This suggests that the high-frequency activity driven by Meme, on-chain trading, and short-term narratives in late March did not carry through into April.
Base and Polygon remain in the second tier. Base recorded 9.176M average daily transactions in March and 7.839M in April, down 14.57%. Polygon posted 9.859M and 8.758M respectively, a decline of 11.17%. Both chains demonstrate a more mature usage structure where activity cools but does not collapse. Unlike narrative-driven chains or those heavily reliant on Meme cycles, established applications such as Polymarket continue to provide baseline traffic.
Ethereum mainnet transaction count remained largely unchanged. March averaged 2.211M daily transactions, while April came in at 2.147M, a modest 2.88% decline. This reflects Ethereum’s core role. Its value is no longer defined by how many transactions it processes, but by which transactions cannot happen without it. Bitcoin represents another form of stability. It recorded 475K daily transactions in March, rising to 521K in April, a 9.57% increase that remains within a normal fluctuation range.
I.2 Active Addresses: Users Remain On-chain, but Broad Participation No Longer Commands Value
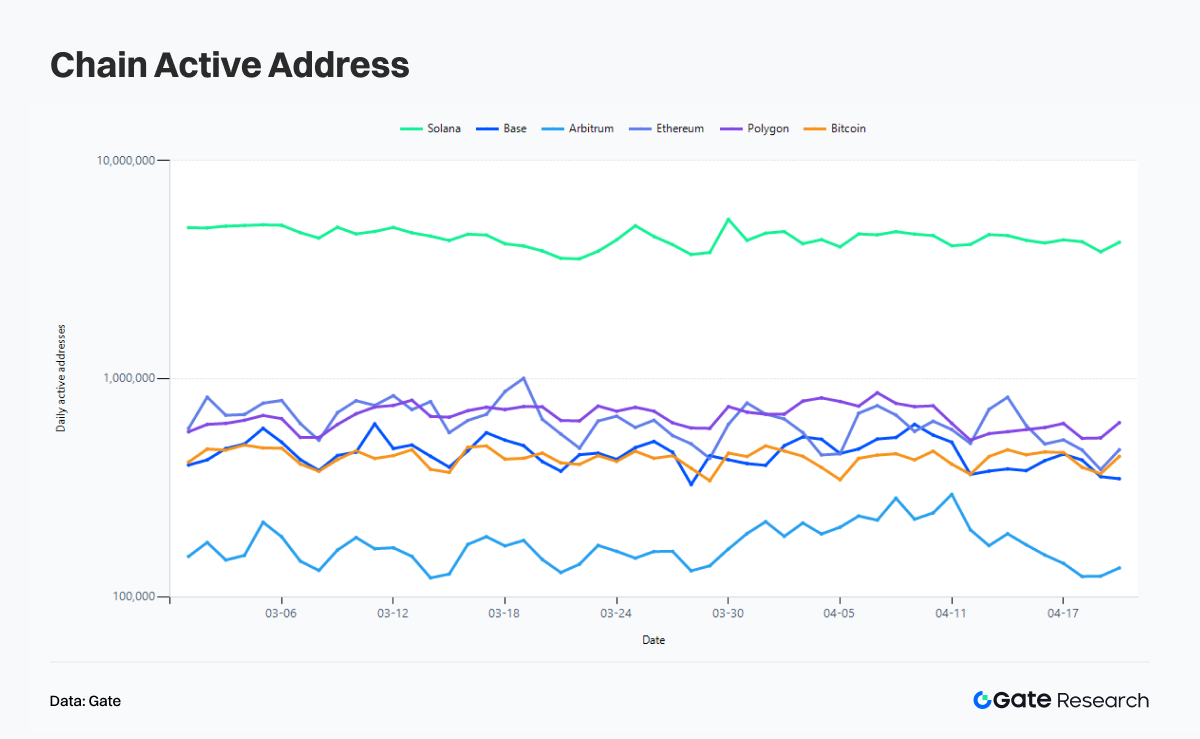
Changes in active addresses offer a clearer view of user structure. Solana recorded 4.471M average daily active addresses in March, declining to 3.955M in April, a drop of 11.54%. The decline in addresses is notably smaller than the drop in transaction count, indicating that after the Meme narrative cooled, interaction intensity per address has decreased.
Similar declines were observed across other major chains. Base saw average daily active addresses fall from 459.9K to 414.8K, down 9.81%. Polygon declined from 673.3K to 608.8K, down 9.59%. Bitcoin dropped from 435.7K to 390.4K, a 10.39% decrease. Ethereum mainnet saw a sharper decline, from 675.0K to 532.7K, down 21.09%, the largest among major chains.
Arbitrum presents a different pattern. Its average daily active addresses increased from 160.4K to 179.8K, up 12.13%, while transaction count fell from 2.262M to 1.485M, a 34.34% decline. This reflects a more distributed but shallower interaction profile in April. More addresses are active, but transaction depth per address has decreased. This combination does not resemble organic growth, but is more consistent with event-driven activity, capital migration, or short-term fund reallocation.
If viewed in isolation, address count may suggest Ethereum is losing traction. However, when considered alongside fees, the conclusion reverses. The market has historically used address growth to tell a user adoption story, but by 2026 this narrative is increasingly insufficient. Address count reflects attention, not capital quality. It shows that activity exists on-chain, but does not reveal who is actually paying.
I.3 Fees: DeFi Capital Outflows Push Ethereum Fees Higher
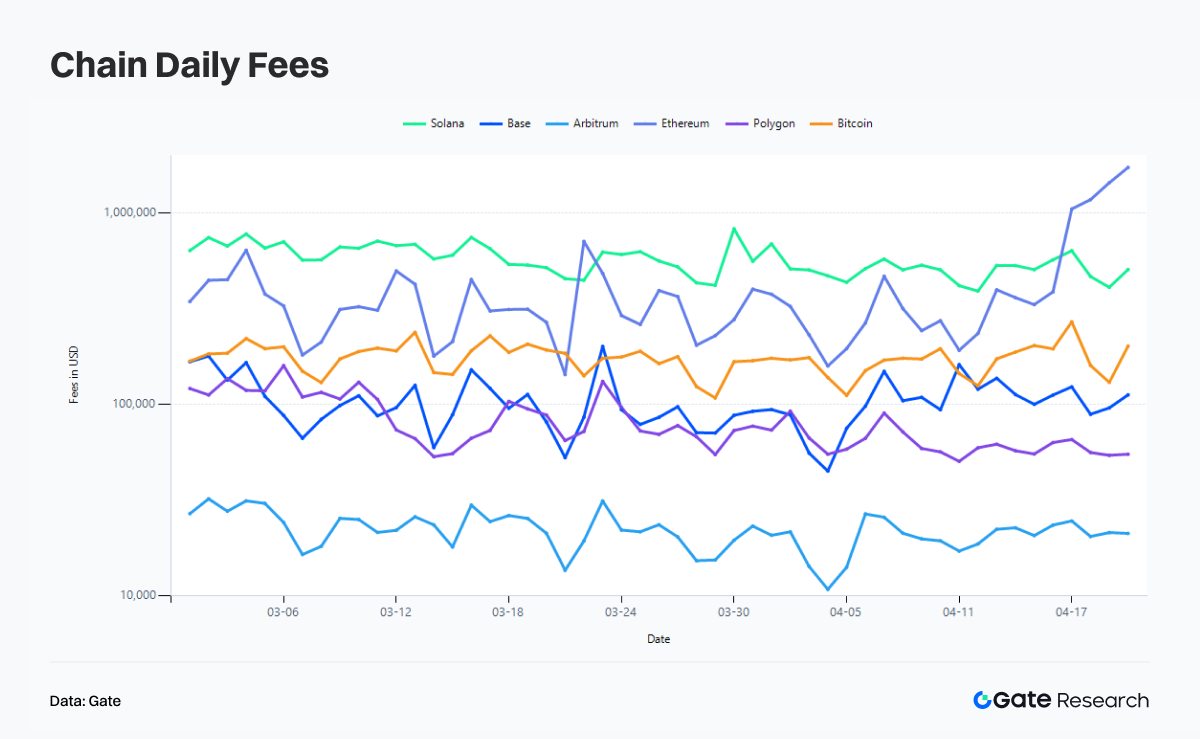
Fees carry the highest information density in this period. Solana recorded $611.1K in average daily fees in March, declining to $463.1K in April, a 24.22% drop, broadly in line with the decline in transaction count. Activity remains high, but the density of transactions willing to pay for congestion has decreased. To some extent, this also reflects a decline in Meme quality, with fewer projects capable of scaling to large market caps.
Base saw fees decline from $104.2K to $94.1K, a modest 9.70% drop, consistent with declines in both transactions and active addresses. Polygon dropped from $92.2K to $57.4K, down 37.71%, indicating that lower-quality traffic on low-cost chains exits quickly.
Ethereum presents a clear divergence. Daily transaction count remained largely flat, and active addresses declined by 21.09%, yet fees increased from $342.9K to $460.8K, a 34.38% rise. Transactions on Ethereum mainnet became more expensive in April. On a daily basis, this increase in fees is closely tied to the chain reaction triggered by the KelpDAO incident, as whales and large holders competed to pay higher gas fees to exit protocols exposed to rsETH lock-in risk.
I.4 Cross-chain Net Flows: Security Incidents and Abnormal Capital Movements Distort “Net Inflows”
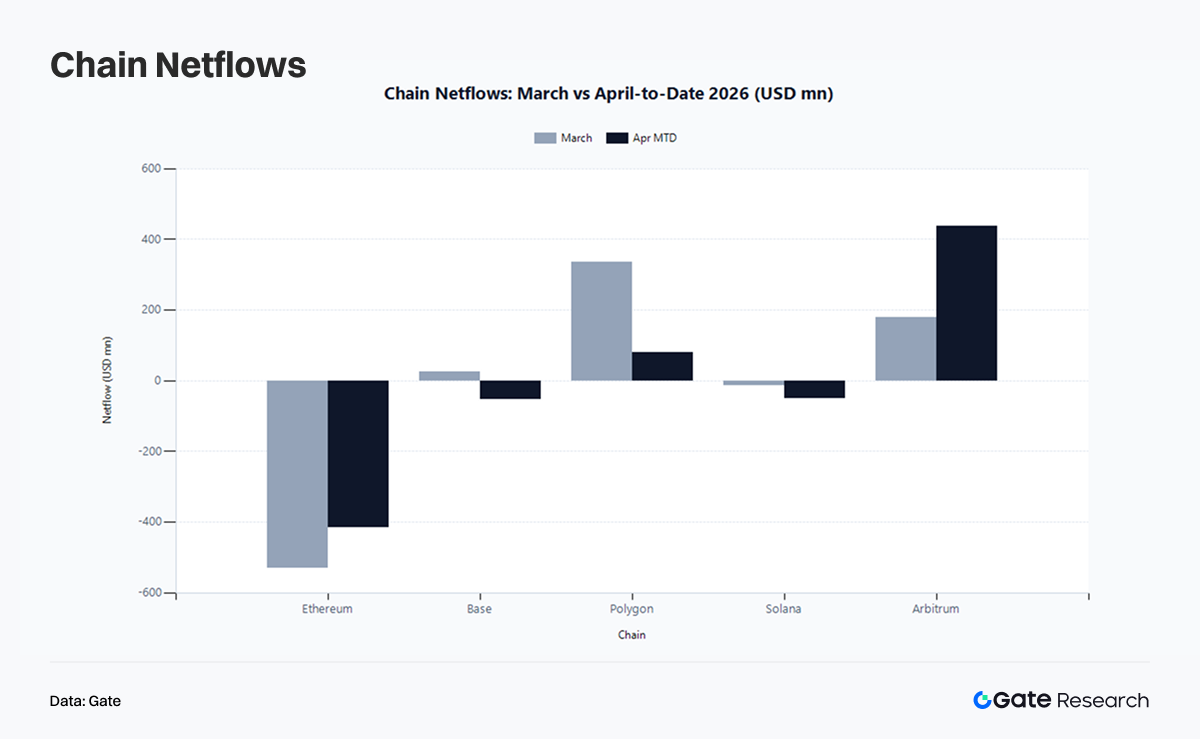
In March, Polygon recorded $336.7M in net inflows, Arbitrum saw $180.0M in net inflows, and Base posted a modest $25.93M inflow. Ethereum saw $530M in net outflows, while Solana recorded a slight $12.7M outflow. Moving into April, Arbitrum’s net inflows expanded to $437.6M, and Polygon maintained $81.38M in net inflows. Ethereum’s net outflows narrowed to $416.5M. Base shifted to net outflows of $53.39M, while Solana’s net outflows widened to $49.1M.
It is important to interpret April’s net flows within the context of events. On April 18, KelpDAO was exploited, and on April 21, the Arbitrum Security Council froze 30,766 ETH, valued at approximately $71.1M. Abnormal cross-chain transfers, fund tracing, and asset repositioning all contributed to amplified inflows on certain chains, without necessarily reflecting genuine ecosystem preference.
As a result, Arbitrum’s elevated net inflows in April indicate that both capital and risk were passing through it. Similarly, Solana’s expanding net outflows do not imply weakening competitiveness. Instead, it may suggest that after stablecoin issuance increased, capital chose to wait rather than immediately engage in on-chain PvP activity. Base’s shift from net inflows to net outflows highlights a harsher reality. Capital previously attracted by social engagement, lightweight interactions, and narrative-driven traffic is now exiting, revealing relatively low stickiness.
I.5 TVL: The Way Capital Stays On-chain Is No Longer Just “Bridging In”
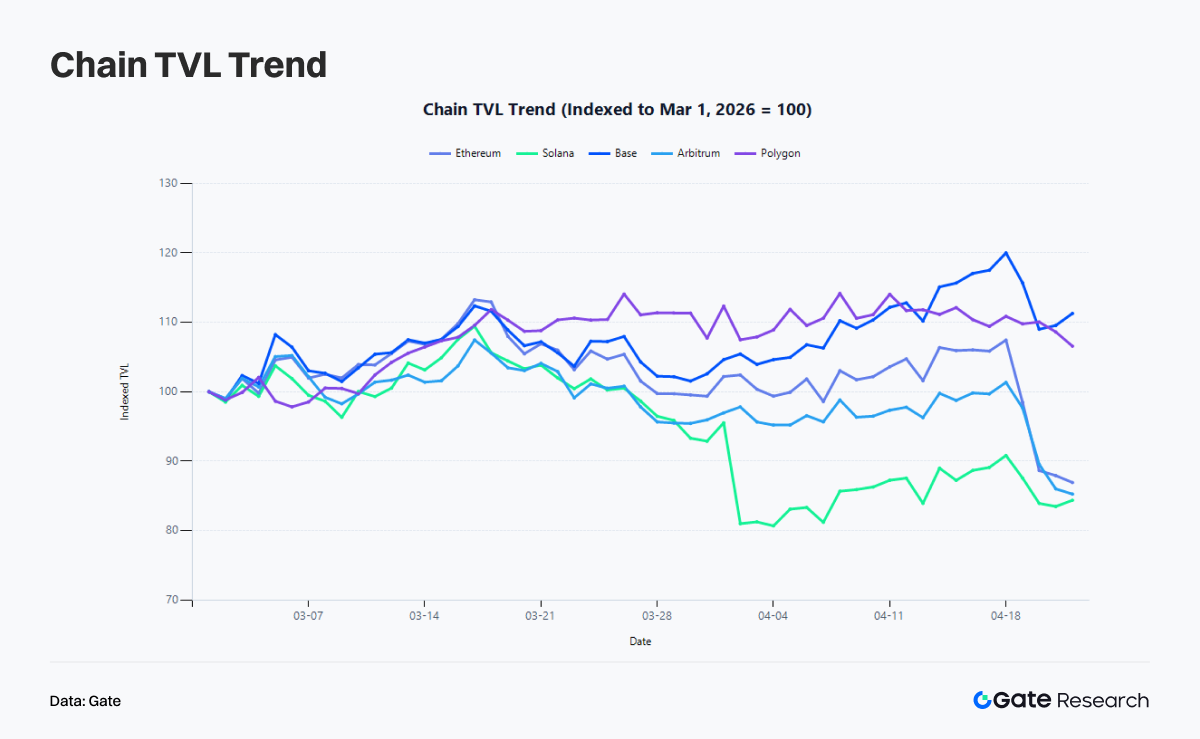
During the period, Ethereum TVL declined from $52.6B to $45.73B, down 13.07%. Solana fell from $6.636B to $5.598B, a 15.63% decline. Arbitrum dropped from $1.991B to $1.698B, down 14.74%. In contrast, Base increased from $3.874B to $4.311B, up 11.28%, while Polygon rose from $1.147B to $1.222B, a 6.57% gain.
It is clear that net flows and TVL do not move in a one-to-one relationship. Base turned negative in net flows during April, yet its TVL continued to rise, indicating that capital remained on-chain and was reallocated internally. Ethereum continued to see net outflows alongside rising fees, largely driven by pressure from security incidents.
II. Events Reshape On-chain Structure: From Stablecoin Inventory to Security Premium
Data never evolves in isolation. From March to mid-to-late April, several key events directly altered how capital moved on-chain and reshaped the meaning behind the data itself.
II.1 March: Stablecoin Market Cap Surpasses $320B as Capital Stays On-chain Waiting for Opportunities
Around March 13, total stablecoin market cap reached a record high of approximately $320.9B, while stablecoin balances on exchanges did not expand in tandem. This divergence indicates that incremental dollar liquidity did not flow into exchanges for high-volatility speculation as seen in previous cycles. Instead, it remained on-chain in wallets, protocol positions, yield pools, and RWA-related products.
The surge in on-chain activity during March reflects a restructuring of capital inventory. Stablecoins staying on-chain set the stage for subsequent RWA expansion, higher settlement demand on mainnets, and short-term growth in high-performance chains.
II.2 Mid-March: On-chain RWA Value Reaches $27.14B as the System Moves Toward Financial Integration
On March 17, on-chain RWA value reached $27.14B, marking an 8.83% increase over 30 days. On-chain infrastructure is beginning to absorb more real-world yield-bearing assets. Traditional capital is placing greater emphasis on clear settlement layers, trusted custody pathways, stablecoin liquidity, and more reliable liquidation systems.
Against this backdrop, the premium once assigned to purely high-frequency chains is starting to fade.
II.3 Late March: Solana Meme Sector Rebounds as Speculative Demand Persists but Rotates Faster
On March 26, the Solana Meme sector saw a notable rebound, with assets such as PONKE, MSQ, and WOLF gaining strength. This coincided with peak transaction activity on-chain. Solana maintained an average of 118.2M daily transactions in March, reflecting continued reliance on its low latency, low cost, and native trading culture to support speculative demand.
However, the late March rebound did not extend into a stronger trend in April. This indicates that on-chain narratives are now rotating at a faster pace. At this stage, Meme assets can still ignite trading activity, but struggle to sustain long-term valuation.
II.4 Early April: Large-scale USDC Minting on Solana Signals Liquidity Migration Ahead of Revenue Recovery
April’s narrative on Solana was shaped by a series of USDC minting events. On March 6, the USDC Treasury minted another $250M on Solana. During the week of April 6, Circle minted $3.25B USDC on Solana, followed by an additional $550M on April 7, bringing total issuance over the past 30 days to more than $10.19B. On April 16, another $250M was minted. Solana has become one of the primary networks for large-scale stablecoin inventory migration.
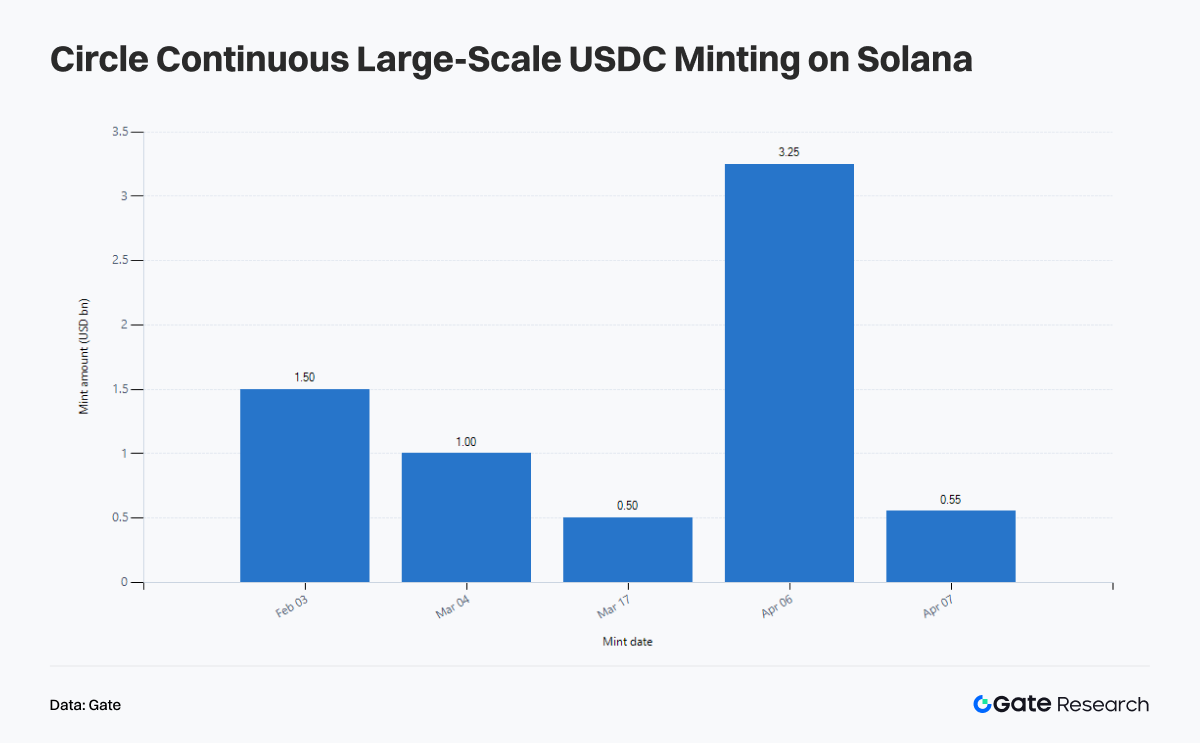
However, stablecoin minting reflects liquidity availability, not efficient utilization. In April, Solana’s transaction count, active addresses, and fees all declined compared to March, while TVL fell by 15.63%. In other words, stablecoin inventory is growing, but the application layer that converts this inventory into sustained fees and protocol revenue remains underdeveloped.
II.5 April 1: Drift Exploit Offsets Solana’s Activity Advantage with a Security Premium
On April 1, Drift Protocol was exploited, resulting in losses of approximately $285M. This marked one of the largest DeFi security incidents in 2026 and one of the most severe shocks to Solana since the Wormhole incident. Following the attack, Drift’s TVL dropped sharply from around $550M to $255M. The attacker bridged funds across chains into approximately 129K ETH and distributed them across multiple addresses.
The impact on Solana extended beyond capital loss to valuation. The Drift incident reinforced a key market realization: speed does not equal security, and activity does not equal trust. This led to a notable divergence. Despite continued stablecoin minting on Solana in April, SOL price rose only 5.13% during the period, significantly underperforming BTC and ETH. On-chain liquidity and confidence did not recover in tandem.
II.6 Mid-April: AI Narrative Returns
On April 15, abnormal on-chain activity and rising DEX volumes in TAO and VIRTUAL signaled a return of the AI Agent narrative to the center of the market. As Meme momentum faded and RWA stabilized, capital continued searching for a narrative that combines imagination with fundamental support, with AI emerging as a key direction.
The resurgence of the AI narrative also raises new requirements for public chains. Low cost, high-frequency interaction, composable assets, deep stablecoin liquidity, and infrastructure capable of supporting an agent-driven economy all become critical. In this context, the return of AI strengthens the division between high-performance execution layers and stable settlement layers.
II.7 April 18 to April 21: KelpDAO Incident Forces Repricing of Cross-chain and Collateral Risk
On April 18, a security incident involving the rsETH cross-chain bridge associated with KelpDAO affected approximately $292M. The exploit path was concentrated in the interaction between cross-chain bridges and restaking structures, exposing vulnerabilities in how LRT assets are wrapped and mapped across chains. As rsETH is widely used as collateral in DeFi, the incident quickly propagated from a single security issue into lending and liquidity markets.
Aave estimated potential bad debt exposure in the range of $124M to $230M and rapidly implemented defensive measures, including freezing rsETH as collateral, adjusting WETH parameters across multiple networks, and limiting additional risk exposure in affected markets. Although the protocol itself was not directly attacked, uncertainty around collateral value and liquidity positioned Aave at the center of risk transmission.
The market rapidly entered a deleveraging phase. A large number of users repaid loans and withdrew WETH and stablecoins, driving utilization rates of core asset pools sharply higher, at times approaching 100%, with liquidity tightening significantly. At the same time, borrowing rates for USDC, USDT, and WETH surged, reflecting short-term funding stress and rising demand for safety.
In addition, on April 21, Arbitrum froze 30,766 ETH, valued at approximately $71.1M, linked to the incident.
III. BTC, ETH, SOL Price and Bitcoin On-chain Structure: Price Recovery Ahead of Network Expansion
During the period, BTC rose from $65,874 to $76,323, gaining 15.86%. ETH increased from $1,929.87 to $2,327.09, up 20.58%. SOL moved from $81.85 to $86.05, a 5.13% increase.
III.1 Bitcoin: Price Recovery Gains Momentum
As of mid-to-late April, Bitcoin added approximately 277,088 non-zero addresses, with around 75.7% of addresses in profit. The cost basis for holdings between one and three months is approximately $74,200. At the same time, Bitcoin’s realized cap change has recovered from around -$28.7B at the end of February to approximately -$3.0B.
BTC has moved from a phase of widespread underwater positions to one where the majority of holders are back in profit. A 75.7% profit ratio is sufficient to ease market panic, but also implies that as price approaches resistance, profit-taking and breakeven selling will become more likely. The ~$74.2K cost cluster serves as a key support zone with meaningful holding strength.
III.2 Ethereum: Fees and Price Rising Together
Ethereum, particularly in late April, was significantly affected by the KelpDAO rsETH incident, with negative cross-chain net flows and declining active addresses. However, security incidents are not fundamentally tied to the network itself. Ethereum mainnet fees increased 34.38% in April compared to March, while price rose 20.58% over the same period.
Ethereum has entered a phase where it supports stablecoins, RWA, and institutional DeFi. Rather than keeping all activity on Ethereum, what matters is that high-value activity ultimately settles on Ethereum.
III.3 Solana: Strong Activity Fails to Translate into Price Strength as Security Risk Gets Priced In
Solana’s issue is not a lack of capital, users, or narratives, but a shift in valuation logic. In April, Solana still recorded the highest transaction count in the market, nearly 4M daily active addresses, and continued waves of USDC minting. Yet its price increased only 5.13% from early March, significantly lagging BTC and ETH.
This gap reflects a change in how the market prices Solana. It is no longer valued simply as the most active chain, but based on whether it can convert activity into high-quality revenue and whether it can withstand security-related discounting. Solana’s strengths remain, but its valuation framework has shifted.
IV. Key Sectors and Forward Watch: Real Winners Are Those with Clear Structural Positioning
When combining data and events from March and April, a clear stratification of on-chain capital emerges.
The first layer is stablecoins and RWA. These represent capital inventory and yield-bearing assets, determining whether capital is willing to stay on-chain over the long term. Stablecoin market cap surpassed $320B in March, RWA value reached $27.14B in mid-March, and stablecoin market cap further climbed to around $322B by mid-April. Capital is no longer entering the market with a purely speculative mindset, but increasingly with an asset allocation approach, with institutional players becoming dominant liquidity providers.
The second layer is high-performance execution layers. Solana maintains the highest transaction density and strong stablecoin issuance capacity. Base continues to demonstrate effective TVL organization, while Polygon absorbs practical demand as a low-cost execution layer. The competition here centers on converting low cost into sustainable revenue and security credibility.
The third layer is event-driven flows. Ethereum shows the largest net outflows, while Arbitrum appears to lead in net inflows. However, when accounting for the KelpDAO incident and the freezing of illicit funds, these flows are largely driven by black swan events rather than intrinsic network value.
The fourth layer is narrative rotation. The AI narrative returned in April, but unlike previous cycles, not all AI-related assets moved together. Capital is now focusing on infrastructure projects that show measurable on-chain signals and can support real interaction volume. Narratives remain important, but the market increasingly demands on-chain validation.
V. Conclusion: Security Comes First, Institutional Capital Is Shaping the Market
Capital has not left the on-chain ecosystem, but it is no longer willing to pay for low-quality activity. Solana remains the most active chain, but no longer commands the highest premium by default. Ethereum has seen declining address counts, yet has reclaimed pricing power over high-value settlement. Base’s TVL has continued to rise even as bridging flows weaken, reflecting resilience driven by internal capital reallocation. Polygon maintains steady demand through low-cost execution. Arbitrum appears to attract capital, but is also absorbing risk migration and the side effects of abnormal bridging activity.
Bitcoin operates in a different framework. Its price recovery has already taken place, while network expansion has yet to fully catch up. With 277K new addresses, 75.7% of addresses in profit, and a cost basis cluster around $74.2K, the market signals that BTC has moved past its most vulnerable phase, yet remains far from retail-driven euphoria.
Two underlying trends define this period. First, the continued expansion of stablecoins and RWA is building a new layer of financial inventory on-chain. Second, security incidents have raised the market’s risk discount rate. Any weakness in cross-chain systems, restaking structures, or leveraged yield mechanisms will quickly lead to a loss of confidence and capital withdrawal.
Going forward, key areas to monitor include whether stablecoin inventory can be converted into sustained fees and protocol revenue, whether RWA, yield-bearing stablecoins, and institutional DeFi continue to reinforce the division between Ethereum and high-quality execution layers, and whether market pricing of collateral quality and protocol security evolves further in response to recent incidents.
References:
Gate Research is a comprehensive blockchain and cryptocurrency research platform that provides deep content for readers, including technical analysis, market insights, industry research, trend forecasting, and macroeconomic policy analysis. Disclaimer Investing in cryptocurrency markets involves high risk. Users are advised to conduct their own research and fully understand the nature of the assets and products before making any investment decisions. Gate is not responsible for any losses or damages arising from such decisions.