This comprehensive analysis examines DEFI token's market position and price trajectory from 2026 to 2031, providing expert insights for decentralized finance investors. Currently trading at $0.000341 with extreme market fear conditions, DEFI combines Web3 SocialFi technology with security solutions addressing the emerging DeFi ecosystem. The article integrates historical price evolution, institutional adoption trends, macroeconomic factors, and technological developments to forecast realistic price ranges: $0.00029-$0.00035 for 2026, escalating to $0.00031-$0.00061 by 2031. Professional investment strategies include long-term holding for believers in Web3 innovation and active trading for experienced participants, complemented by robust risk management frameworks emphasizing portfolio diversification and secure storage via Gate Web3 Wallet. Despite significant volatility and liquidity constraints, the low price point presents opportunities for risk-tolerant investors willing to conduct thorough due diligence
Introduction: DEFI's Market Position and Investment Value
De.Fi (DEFI), positioned as a Web3 SocialFi and antivirus platform, has been working to onboard the next wave of cryptocurrency investors since its launch in 2024. As of February 2026, DEFI maintains a market capitalization of approximately $640,530, with a circulating supply of around 1.88 billion tokens, and the price hovering near $0.000341. This asset, which combines accessibility and gamification with risk mitigation technology, is playing an increasingly important role in the Web3 security and social finance space.
This article will comprehensively analyze DEFI's price trends from 2026 to 2031, incorporating historical patterns, market supply and demand dynamics, ecosystem developments, and macroeconomic conditions to provide investors with professional price forecasts and practical investment strategies.
I. DEFI Price History Review and Market Status
DEFI Historical Price Evolution Trajectory
- 2024: De.Fi launched on Gate.com on January 30 with a publish price of $0.2, reaching a price peak of $1.09 on January 31
- 2024-2025: Following the initial peak, the token experienced significant price corrections during market adjustment periods
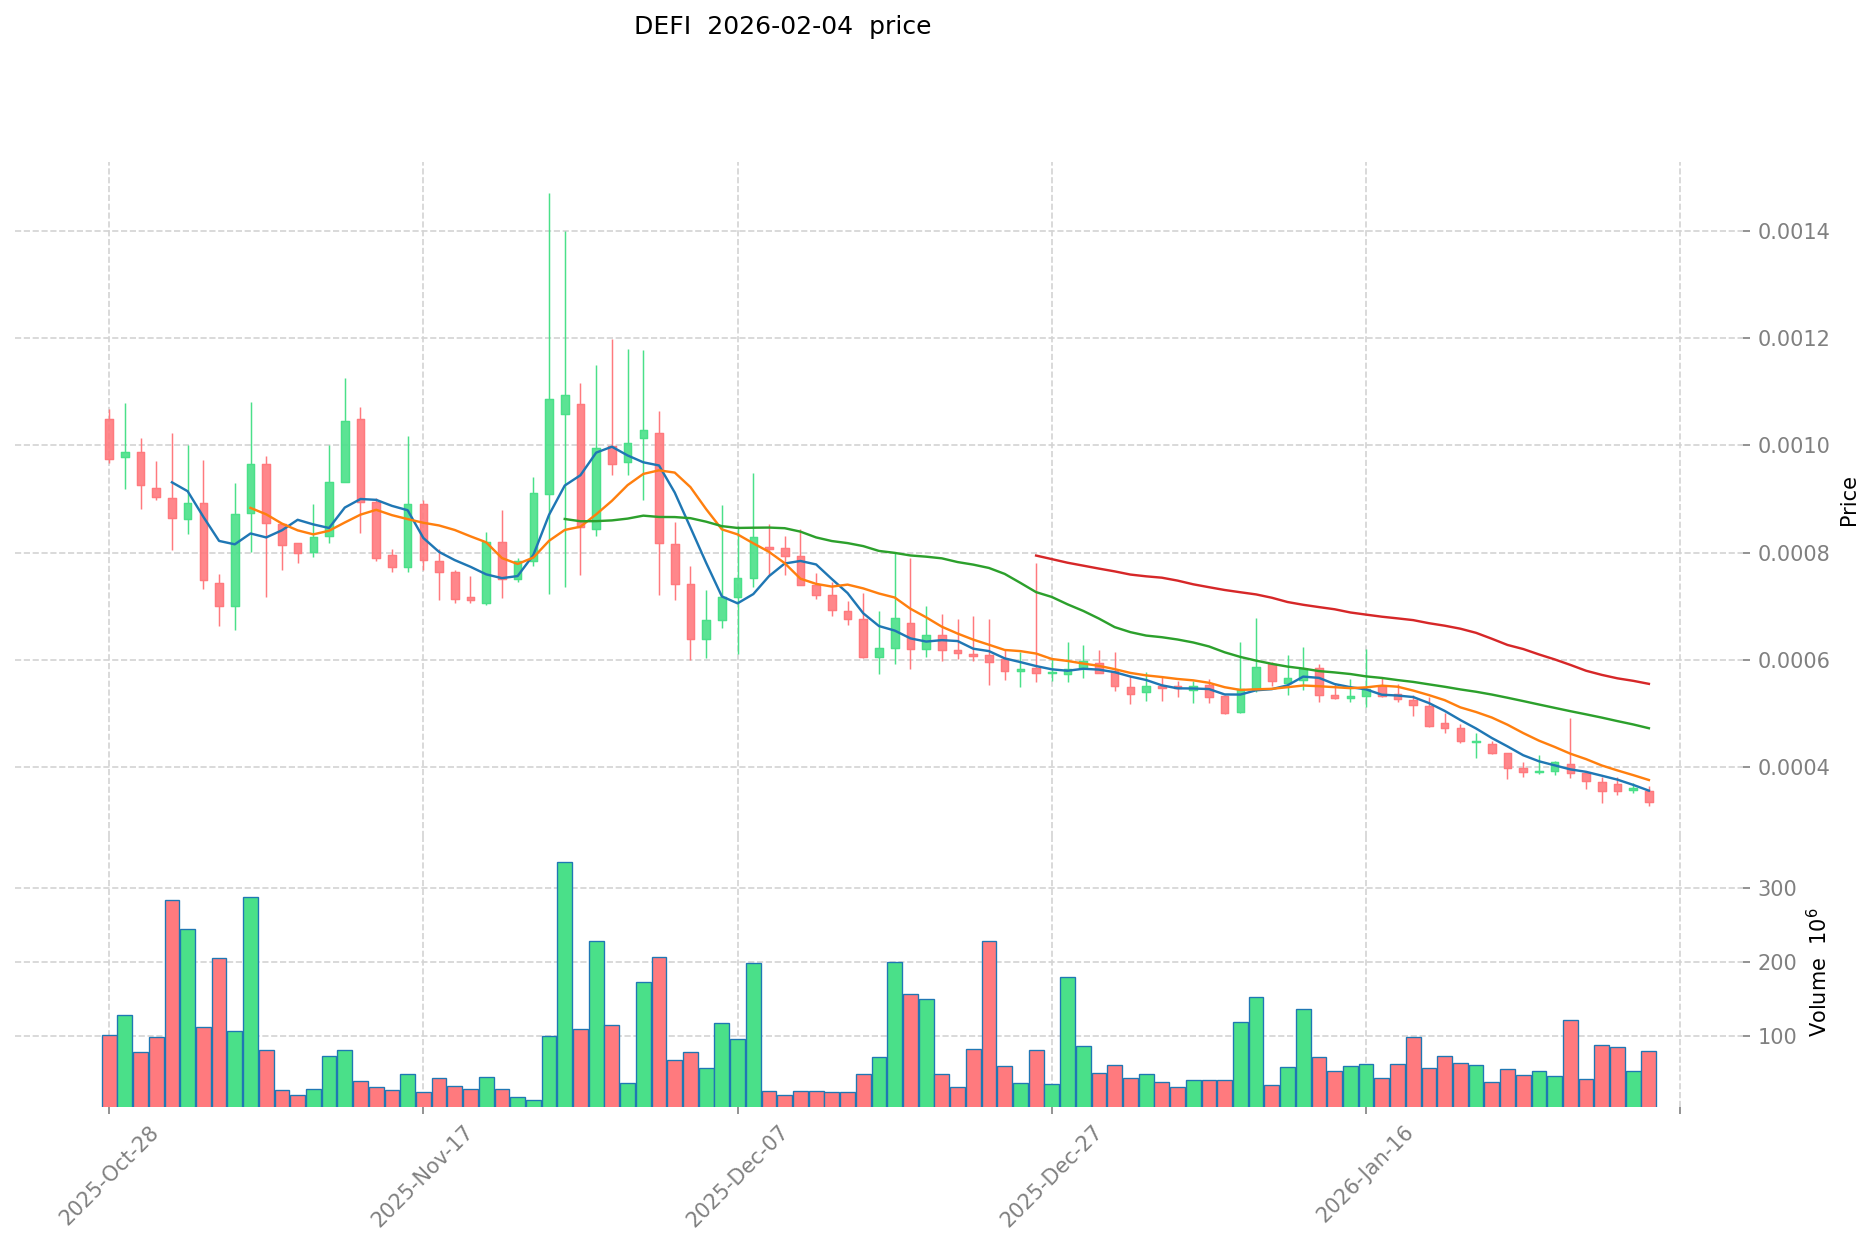
- 2026: The price declined substantially, reaching the historical low of $0.0003271 on February 3
DEFI Current Market Situation
As of February 5, 2026, DEFI is trading at $0.000341, reflecting notable volatility across multiple timeframes. The token has experienced a 1.47% decrease over the past hour and a 4.03% decline in the last 24 hours, with trading volume reaching $31,769.92 during this period.
Over extended periods, the price movement shows more pronounced changes. The 7-day performance indicates a 16.41% decline, while the 30-day period reflects a 36.99% decrease. The annual perspective reveals a substantial 98.96% decline from year-ago levels.
DEFI currently maintains a market capitalization of $640,530.87, with a circulating supply of 1,878,389,653 tokens representing 62.61% of the maximum supply of 3 billion tokens. The token ranks at position 2,840 by market capitalization and holds approximately 9,855 holders. The market cap to fully diluted valuation ratio stands at 62.61%, indicating the proportion of tokens currently in circulation.
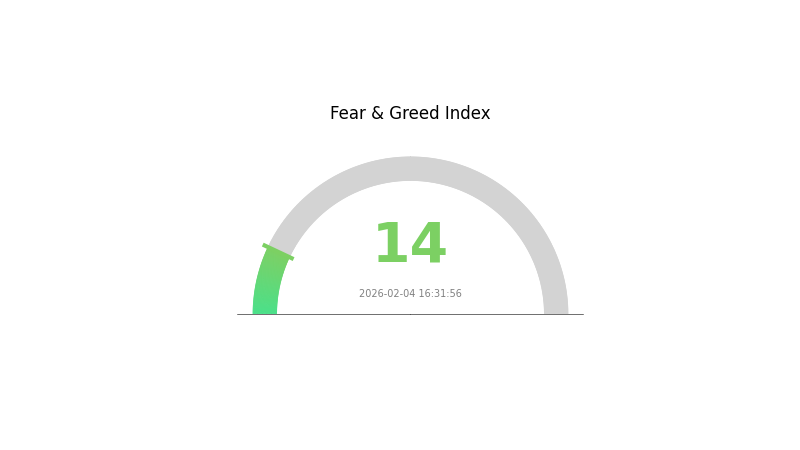
The 24-hour trading range spans from a low of $0.0003271 to a high of $0.000356. According to the crypto fear and greed index, the current market sentiment registers at 14, indicating extreme fear conditions in the broader cryptocurrency market.
Click to view current DEFI market price
DEFI Market Sentiment Indicator
2026-02-04 Fear and Greed Index: 14 (Extreme Fear)
Click to view current Fear & Greed Index
The DeFi market is currently experiencing extreme fear, with the fear and greed index hitting 14. This indicates significant market pessimism and heightened risk aversion among investors. During such periods, market volatility tends to increase, and selling pressure may intensify. However, extreme fear often presents contrarian investment opportunities for long-term participants. It's crucial to maintain a disciplined approach, conduct thorough research, and avoid making emotional decisions. Consider reviewing your portfolio strategy and risk management on Gate.com to navigate this challenging market environment effectively.
DEFI Holding Distribution
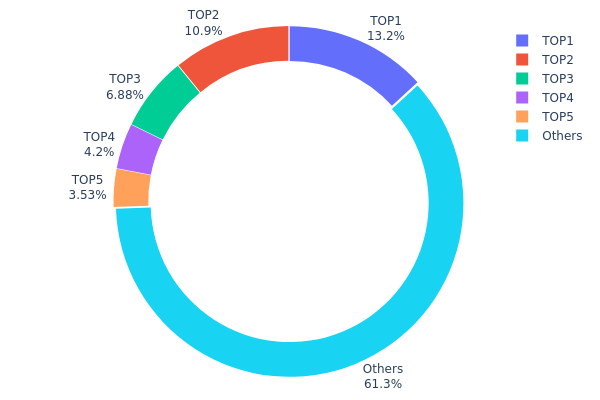
The holding distribution chart reveals the concentration of token ownership across different wallet addresses, serving as a critical indicator of decentralization and potential market manipulation risks. According to the latest on-chain data, the top 5 addresses collectively control approximately 38.65% of the total DEFI supply, with the largest single address holding 148,002.11K tokens (13.15%), followed by the second-largest at 122,574.71K tokens (10.89%). The remaining 61.35% of tokens are distributed among other addresses, suggesting a moderately decentralized ownership structure.
This distribution pattern indicates a relatively balanced ecosystem compared to many emerging DeFi projects. While the top two addresses command significant influence with combined holdings exceeding 24%, the fact that no single entity controls more than 15% reduces the likelihood of unilateral price manipulation. The substantial portion held by "Others" (61.35%) demonstrates healthy retail and institutional participation, which typically contributes to market stability and liquidity depth.
However, investors should remain cognizant that approximately 40% concentration within the top 5 addresses still poses potential risks during periods of market volatility. Large holders could theoretically coordinate selling pressure or influence governance decisions, though the current distribution suggests a maturing project with established stakeholder diversity. The on-chain structure reflects a developing equilibrium between decentralization ideals and practical token distribution, positioning DEFI within acceptable parameters for a legitimate DeFi protocol.
Click to view current DEFI Holding Distribution
| Top |
Address |
Holding Qty |
Holding (%) |
| 1 |
0x0d07...b492fe |
148002.11K |
13.15% |
| 2 |
0xf89d...5eaa40 |
122574.71K |
10.89% |
| 3 |
0x74de...a2f9a1 |
77426.85K |
6.88% |
| 4 |
0x0529...c553b7 |
47299.85K |
4.20% |
| 5 |
0x58ed...a36a51 |
39714.26K |
3.53% |
| - |
Others |
689846.22K |
61.35% |
II. Core Factors Influencing DeFi's Future Price
Supply Mechanisms
-
Token Burn and Deflationary Models: Several major DeFi protocols have implemented token burn mechanisms to reduce circulating supply. Ethereum's EIP-1559 upgrade introduced a fee-burning mechanism that has gradually reduced ETH supply growth, creating potential deflationary pressure during high network activity periods.
-
Historical Patterns: According to DeFiLlama data, the Total Value Locked (TVL) in DeFi grew from under $5 billion at the end of 2020 to over $150 billion by late 2023, demonstrating massive expansion. Historical cycles show that supply mechanisms combined with demand growth significantly impact token valuations.
-
Current Impact: As of 2025, the DeFi market is expected to continue expanding, with TVL projections potentially reaching $400 billion. The combination of controlled token issuance and increasing adoption creates favorable supply-demand dynamics for price appreciation.
Institutional and Major Holder Dynamics
-
Institutional Holdings: Major DeFi protocols like Aave and Uniswap have attracted significant institutional attention. Aave's TVL reached approximately $4.5 billion by 2023, representing nearly 30% of the DeFi lending market share, indicating strong institutional confidence.
-
Enterprise Adoption: Traditional financial institutions are increasingly participating in DeFi through regulated channels. The approval of Bitcoin ETFs has opened pathways for institutional capital to flow into crypto markets, with products like ProShares Bitcoin Strategy ETF exceeding $20 billion in assets under management.
-
National Policies: The evolving regulatory landscape, particularly discussions around strategic cryptocurrency reserves and ETF approvals, signals growing governmental acceptance. The U.S. government's more open stance toward blockchain technology has encouraged industry development and institutional participation.
Macroeconomic Environment
-
Monetary Policy Impact: Interest rate cycles significantly influence DeFi yields. As central banks like the Federal Reserve, European Central Bank, and Bank of England adjust rates, DeFi protocols can offer attractive yield arbitrage opportunities. Data shows that Aave's average yields have consistently exceeded U.S. Treasury rates, creating compelling alternatives for yield-seeking investors.
-
Inflation Hedge Characteristics: DeFi protocols offering stablecoin yields and real-world asset integration provide inflation protection mechanisms. Platforms like MakerDAO have successfully channeled U.S. Treasury yields into DeFi, creating sustainable real yield opportunities backed by traditional assets.
-
Geopolitical Factors: Global financial uncertainty and cross-border payment needs have accelerated DeFi adoption. The technology's permissionless nature and censorship resistance make it attractive during periods of geopolitical tension, driving increased usage and value accrual.
Technological Development and Ecosystem Building
-
Infrastructure Maturation: The DeFi ecosystem has evolved beyond simple liquidity mining to encompass sophisticated protocols. Platforms like Aave have undergone years of battle-testing, while projects like Hyperliquid and Ethena demonstrate continued innovation in derivatives and yield generation.
-
Cross-Chain Integration: Layer 2 solutions and high-performance blockchains are enabling new DeFi applications. Projects like Polymarket and other platforms leverage improved infrastructure to deliver seamless user experiences without necessarily requiring native tokens.
-
Ecosystem Applications: Major DeFi protocols continue expanding their offerings. Aave introduced its own stablecoin (GHO), while protocols are exploring fixed-rate products and synthetic assets. Innovations like Pendle's yield tokenization and Ethena's delta-neutral strategies represent successful product-market fit discoveries, with Ethena growing to $5 billion in positions.
-
DeFi-CeFi Integration: The convergence of decentralized and centralized finance represents a pragmatic evolution. Real yield generation through mechanisms like funding rate arbitrage (as pioneered by Ethena) and U.S. Treasury integration (as utilized by MakerDAO) demonstrates how hybrid models address sustainability concerns while maintaining decentralized distribution.
III. 2026-2031 DEFI Price Prediction
2026 Outlook
- Conservative Prediction: $0.00029 - $0.00034
- Neutral Prediction: Around $0.00034
- Optimistic Prediction: Up to $0.00035 (requiring favorable market sentiment and increased trading activity)
2027-2029 Outlook
- Market Stage Expectation: The token may enter a gradual growth phase with increasing volatility, as the broader cryptocurrency market matures and DeFi adoption expands.
- Price Range Predictions:
- 2027: $0.00019 - $0.00046
- 2028: $0.00020 - $0.00053
- 2029: $0.00044 - $0.00063
- Key Catalysts: Potential drivers include enhanced protocol adoption, strategic partnerships, technological improvements in DeFi infrastructure, and positive regulatory developments that may boost investor confidence.
2030-2031 Long-term Outlook
- Base Scenario: $0.00045 - $0.00059 (assuming steady market conditions and sustained DeFi sector growth)
- Optimistic Scenario: $0.00055 - $0.00061 (contingent on significant ecosystem expansion and increased utility)
- Transformative Scenario: Prices could potentially reach the higher end of projected ranges if breakthrough innovations or mainstream institutional adoption materialize within the DeFi space
- February 5, 2026: DEFI trading within the predicted range of $0.00029 - $0.00035 (early-stage price discovery phase)
| Year |
Predicted High Price |
Predicted Average Price |
Predicted Low Price |
Price Change |
| 2026 |
0.00035 |
0.00034 |
0.00029 |
0 |
| 2027 |
0.00046 |
0.00034 |
0.00019 |
0 |
| 2028 |
0.00053 |
0.0004 |
0.0002 |
17 |
| 2029 |
0.00063 |
0.00046 |
0.00044 |
36 |
| 2030 |
0.00059 |
0.00055 |
0.00045 |
60 |
| 2031 |
0.00061 |
0.00057 |
0.00031 |
66 |
IV. DEFI Professional Investment Strategy and Risk Management
DEFI Investment Methodology
(1) Long-term Holding Strategy
- Suitable for: Investors who believe in Web3 SocialFi technology and DeFi security solutions with medium to long-term investment horizons
- Operational Recommendations:
- Accumulate positions gradually during market corrections, avoiding concentrated purchases at single price points
- Monitor project development milestones and ecosystem expansion progress regularly
- Secure storage using Gate Web3 Wallet with multi-signature protection enabled
(2) Active Trading Strategy
- Technical Analysis Tools:
- Volume analysis: Monitor 24-hour trading volume of approximately $31,769 to identify liquidity patterns and potential breakout signals
- Support and resistance levels: Current 24-hour range between $0.0003271 (low) and $0.000356 (high) provides short-term trading boundaries
- Swing Trading Considerations:
- Consider the high volatility reflected in the -16.41% weekly change when setting stop-loss parameters
- Account for the relatively low market capitalization of approximately $640,530 which may result in increased price sensitivity
DEFI Risk Management Framework
(1) Asset Allocation Principles
- Conservative investors: 1-2% of crypto portfolio allocation
- Aggressive investors: 3-5% of crypto portfolio allocation
- Professional investors: Up to 8-10% with active monitoring and hedging strategies
(2) Risk Hedging Solutions
- Portfolio diversification: Balance DEFI holdings with established large-cap cryptocurrencies to reduce concentration risk
- Position sizing: Limit individual trade exposure to no more than 2-3% of total investment capital given the token's volatility profile
(3) Secure Storage Solutions
- Hot wallet recommendation: Gate Web3 Wallet for active trading positions with convenient access and integrated security features
- Cold storage approach: For long-term holdings exceeding $1,000 equivalent, consider hardware wallet solutions with offline key management
- Security precautions: Enable two-factor authentication, verify contract address (0x6b0faca7ba905a86f221ceb5ca404f605e5b3131 on Ethereum), and never share private keys or seed phrases
V. DEFI Potential Risks and Challenges
DEFI Market Risks
- High volatility exposure: The token has experienced a -98.96% decline over the past year, demonstrating significant downside potential during adverse market conditions
- Limited liquidity: With a 24-hour trading volume of approximately $31,769 and market cap around $640,530, large orders may face slippage challenges
- Market capitalization fluctuations: Ranking at position 2,840 with only 0.000024% market dominance indicates susceptibility to broader market sentiment shifts
DEFI Regulatory Risks
- DeFi sector scrutiny: Ongoing regulatory developments in major jurisdictions may impact projects combining social finance and security features
- Compliance evolution: Changes in Web3 and SocialFi regulatory frameworks could require operational adjustments
- Geographic restrictions: Potential limitations on service availability in certain regions based on evolving crypto regulations
DEFI Technical Risks
- Smart contract vulnerabilities: As an ERC-20 token on Ethereum, the project depends on contract security and audit quality
- Platform dependency: Reliance on Ethereum network performance may expose users to congestion or high gas fees during peak periods
- Project execution risk: The ambitious goal of onboarding 100 million investors requires sustained development and market adoption
VI. Conclusion and Action Recommendations
DEFI Investment Value Assessment
De.Fi represents a specialized opportunity within the Web3 SocialFi and security technology sector, combining gamification with risk mitigation tools. The project addresses a genuine need for accessible DeFi security solutions. However, investors should carefully weigh the significant price decline (-98.96% over one year) and limited liquidity against the project's long-term vision. The current low price point of $0.000341 may present opportunities for risk-tolerant investors, but the token's volatility profile requires cautious position sizing and active risk management.
DEFI Investment Recommendations
✅ Beginners: Start with small exploratory positions (under 1% of portfolio) to understand the project's dynamics while focusing on education about DeFi security concepts
✅ Experienced investors: Consider allocation of 2-5% with dollar-cost averaging approach, maintaining strict stop-loss levels and regularly reassessing fundamental developments
✅ Institutional investors: Conduct comprehensive due diligence on project roadmap, team credentials, and competitive positioning before committing capital; implement hedging strategies and liquidity management protocols
DEFI Trading Participation Methods
- Spot trading: Purchase DEFI tokens directly on Gate.com with immediate settlement and self-custody options
- Gate Web3 Wallet integration: Utilize decentralized wallet features for direct interaction with De.Fi platform services while maintaining asset control
- Gradual accumulation: Implement systematic investment plans during market stabilization periods to reduce timing risk exposure
Cryptocurrency investment carries extreme risk, and this article does not constitute investment advice. Investors should make prudent decisions based on their own risk tolerance and are advised to consult professional financial advisors. Never invest more than you can afford to lose.
FAQ
What are DeFi tokens and what is the significance of DeFi price prediction?
DeFi tokens are digital assets used in decentralized finance applications. DeFi price prediction enables investors to assess market trends and make informed trading decisions, capturing potential value opportunities in the rapidly evolving crypto market.
How to conduct DeFi token price prediction, what are the common analysis methods?
Common methods include technical analysis and fundamental analysis. Key metrics are Total Value Locked (TVL), market cap, and 24-hour trading volume. Evaluate team credibility, smart contract security, tokenomics, and community engagement for accurate predictions.
What are the main factors affecting DeFi token prices?
DeFi token prices are primarily influenced by market demand, liquidity pool trading volume, and overall market trends. Large transactions cause price fluctuations through price impact, while liquidity supply on decentralized platforms significantly affects pricing dynamics.
Popular DeFi prediction tools include Glassnode, Coinglass, and DeFi Pulse. Select reliable sources by evaluating historical accuracy, user reviews, data transparency, and real-time market analysis capabilities. Compare multiple tools for comprehensive insights.
What are the risks of DeFi price prediction and how to avoid being misled?
DeFi price prediction risks include smart contract vulnerabilities, oracle manipulation, and social engineering. Avoid being misled by conducting thorough code audits, verifying team credentials, checking multi-signature wallet controls, and using only reputable data sources for price information.
What are the respective roles of technical analysis and fundamental analysis in DeFi price prediction?
Technical analysis predicts DeFi prices through charts and indicators, identifying trend patterns. Fundamental analysis evaluates project value, tokenomics, and ecosystem strength. Combined, they provide comprehensive price forecasting insights.
What are the differences between DeFi token price prediction and traditional stock prediction?
DeFi token predictions rely on decentralized market supply and demand, reflecting collective expectations rather than institutional analysis. They feature 24/7 trading volume, higher volatility, and faster price movements compared to traditional stocks with regulated market hours and analyst-driven valuations.
How to develop investment strategies based on DeFi price predictions, and what should be noted?
Focus on market volatility and trends when developing strategies. Monitor trading volume, diversify positions, set clear entry and exit points, and regularly review performance against market conditions.
* The information is not intended to be and does not constitute financial advice or any other recommendation of any sort offered or endorsed by Gate.