This comprehensive DPR price analysis provides professional forecasts and investment strategies for 2026-2031. As a Web 3.0 privacy-focused infrastructure token, DPR currently trades at $0.0001979 with extreme market fear (index: 14). The article examines DPR's price history, current market dynamics including liquidity constraints and extreme concentration risk (top holder controls 70.57%), and core influencing factors spanning supply mechanisms, macroeconomic conditions, and ecosystem development. Expert predictions project DPR reaching $0.0002-$0.0029 in 2026, with potential growth to $0.00037-$0.00044 by 2031. The guide offers tailored investment strategies for different investor profiles, emphasizing risk management, secure storage via Gate Web3 Wallet, and stringent due diligence requirements. Suitable for investors analyzing emerging Web 3.0 infrastructure opportunities seeking data-driven market insights.
Introduction: DPR's Market Position and Investment Value
Deeper Network (DPR), positioned as a decentralized distributed blockchain network building truly private, secure, and fair internet infrastructure, has been developing its Web 3.0 ecosystem since its establishment in 2018. As of 2026, DPR maintains a market capitalization of approximately $651,868, with a circulating supply of around 3.29 billion tokens, and the price currently hovering around $0.0001979. This asset, recognized as a pioneering force in decentralized network infrastructure, is playing an increasingly important role in the privacy-focused internet services sector.
This article will comprehensively analyze DPR's price trajectory from 2026 to 2031, combining historical patterns, market supply and demand dynamics, ecosystem development, and macroeconomic environment factors to provide investors with professional price forecasts and practical investment strategies.
I. DPR Price History Review and Current Market Status
Historical Price Evolution of DPR
- 2021: DPR reached a notable price level of $0.334751 on April 12, marking a significant milestone in its early trading period
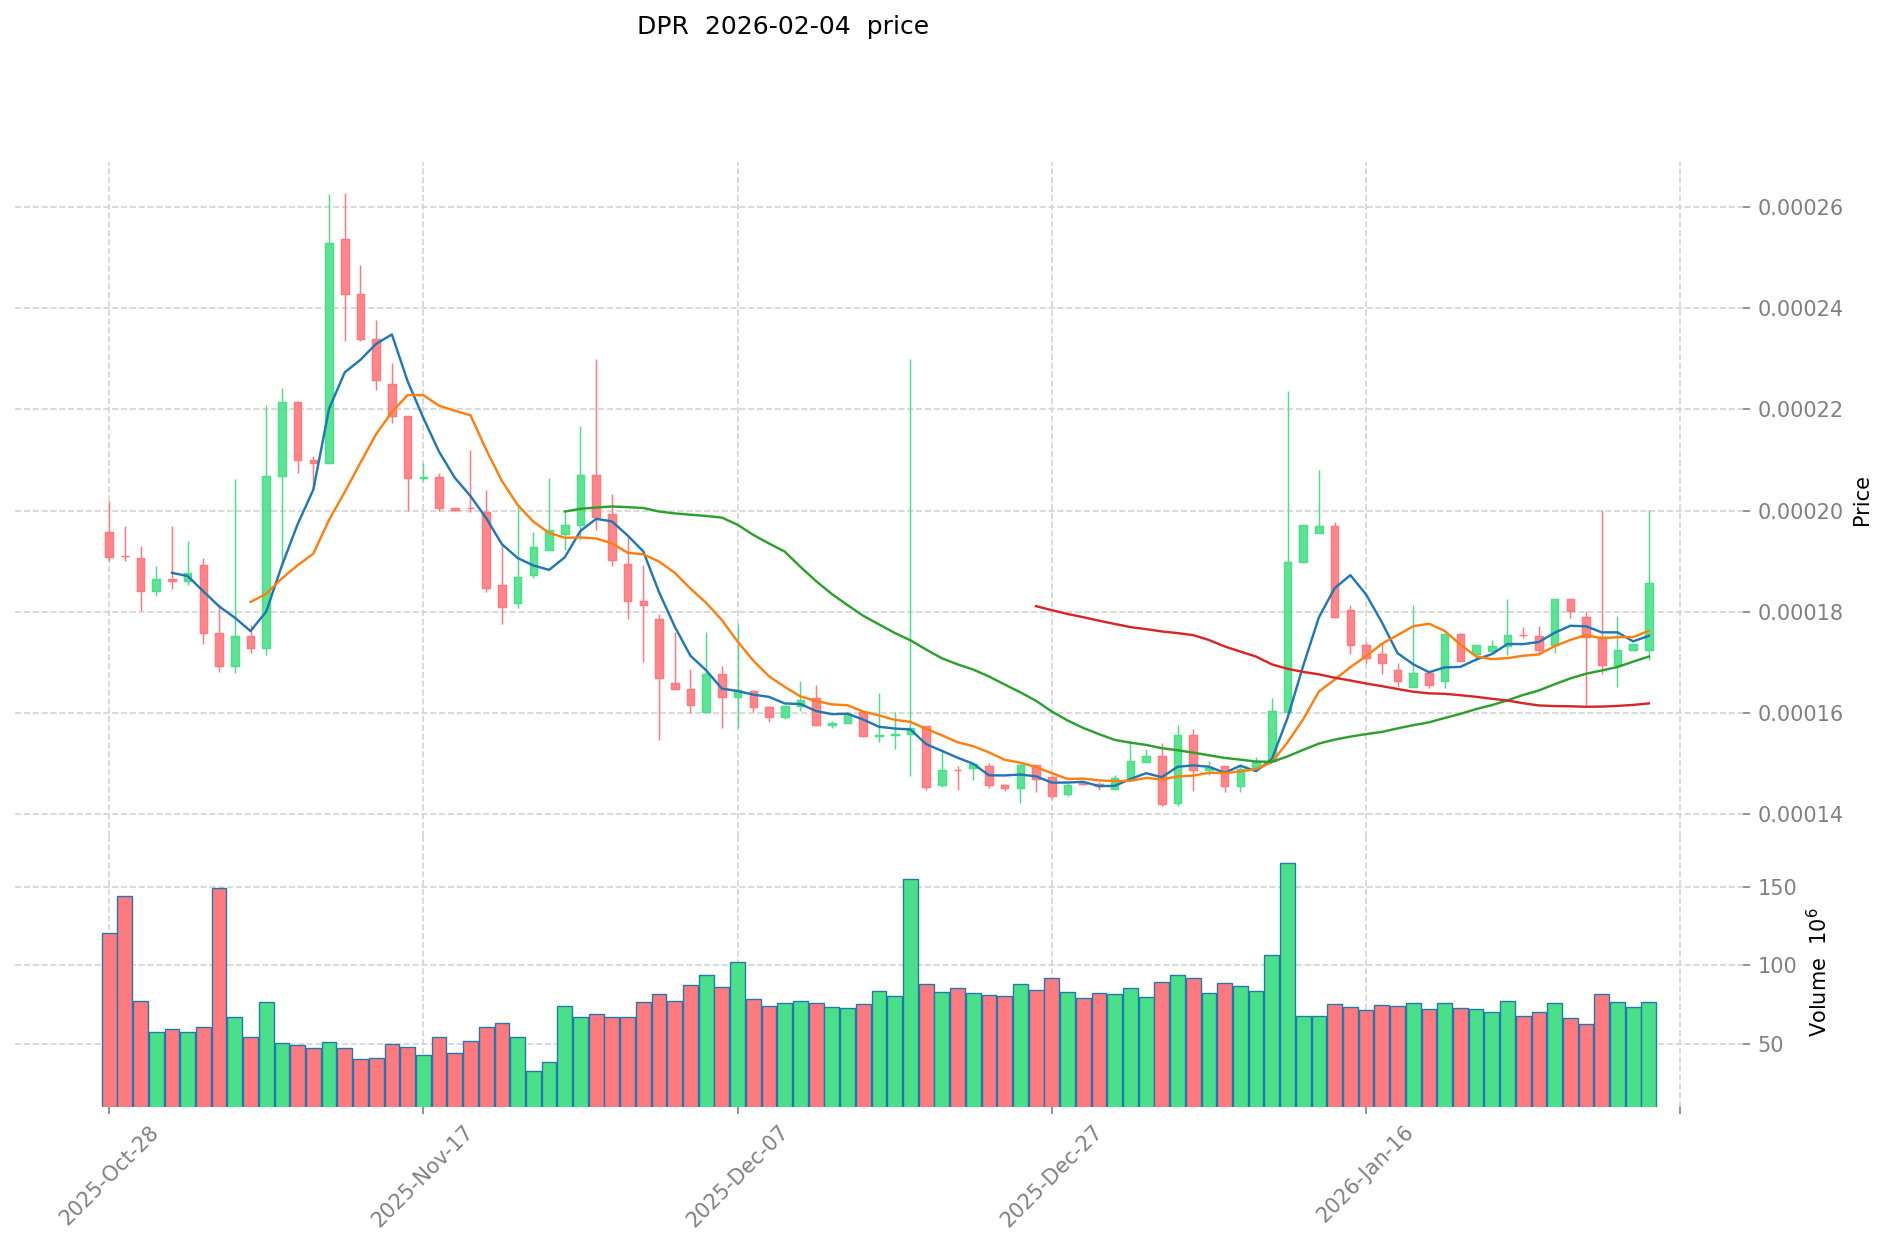
- 2026: The token experienced considerable price movement, with the price dropping to $0.0001416 on January 4, representing a substantial decline from previous levels
Current Market Status of DPR
As of February 5, 2026, DPR is trading at $0.0001979, showing mixed short-term performance across different timeframes. The token has demonstrated a 14.92% increase over the past 24 hours, with trading activity reaching $15,837.06 in volume.
Over the past week, DPR has gained 10.68%, while the 30-day performance shows a 33.18% increase. However, the annual performance reflects a decline of 89.1%, indicating significant volatility over the longer term.
The token's 24-hour trading range spans from $0.0001704 to $0.0002141. With a circulating supply of approximately 3.29 billion tokens out of a maximum supply of 10 billion, DPR represents a circulating ratio of 32.94%. The current market capitalization stands at approximately $651,868, with a fully diluted market cap of $1.97 million.
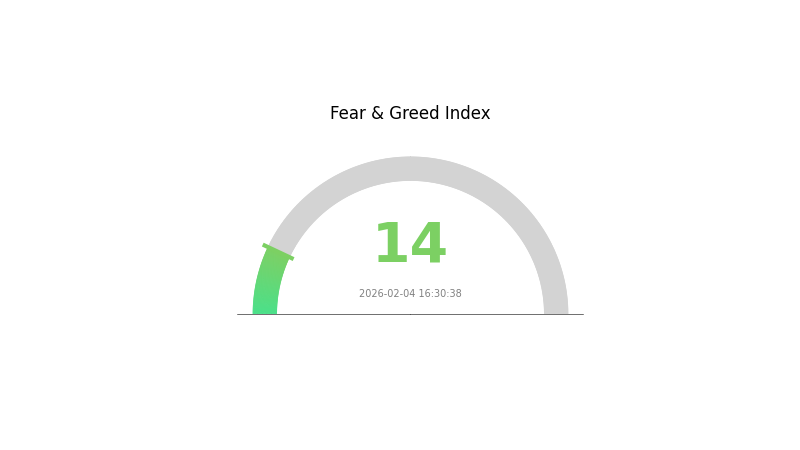
The cryptocurrency market sentiment index currently registers at 14, indicating an environment of extreme fear among market participants. DPR maintains a presence across multiple blockchain networks, with contract deployments on both Ethereum and BSC networks.
Click to view current DPR market price
DPR Market Sentiment Index
2026-02-04 Fear and Greed Index: 14 (Extreme Fear)
Click to view current Fear & Greed Index
The cryptocurrency market is currently experiencing extreme fear, with the Fear and Greed Index dropping to 14. This historically low reading suggests investors are highly cautious and risk-averse. During such periods, markets typically see reduced trading activity and increased volatility. However, extreme fear often presents contrarian opportunities for long-term investors. Monitor market developments closely on Gate.com and consider your risk tolerance before making investment decisions during this volatile period.
DPR Holding Distribution
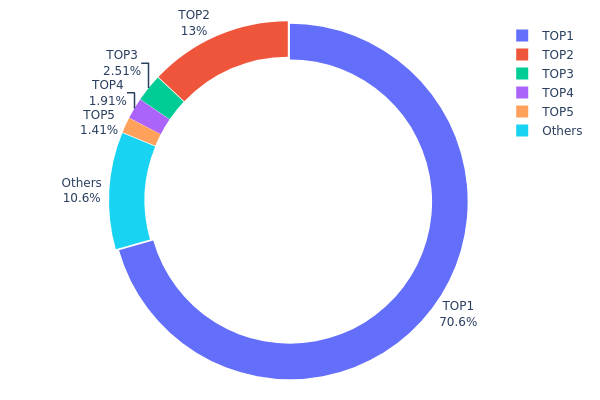
The holding distribution chart reflects the concentration of token supply across different wallet addresses, serving as a critical indicator of decentralization and potential market manipulation risks. A highly concentrated distribution, where a small number of addresses control the majority of supply, typically signals elevated volatility risk and potential single-point manipulation threats. Conversely, a more dispersed distribution generally indicates healthier market structure and stronger resistance to coordinated price manipulation.
Current on-chain data reveals significant concentration in DPR's holding structure. The top address (0x1959...289aaf) controls 4,669,500K tokens, representing 70.57% of total supply—an exceptionally high concentration level. The second-largest holder (0x7a7a...753697) holds 858,116K tokens at 12.96%, while the third through fifth addresses collectively account for only 5.82%. Combined, the top five addresses control 89.35% of total supply, leaving merely 10.65% distributed among remaining holders. This extreme concentration pattern significantly deviates from typical decentralized token distribution models.
Such concentrated holding structure poses considerable implications for market dynamics. The dominant position of the top holder creates substantial single-point risk—large-scale transfers or liquidations from this address could trigger severe price volatility. The high concentration may also facilitate coordinated manipulation, as a small number of major holders possess sufficient market power to influence price discovery mechanisms. Furthermore, this distribution pattern may restrict organic trading activity and liquidity depth, potentially amplifying price slippage during periods of elevated trading volume. From a decentralization perspective, DPR's current structure exhibits characteristics more aligned with centralized control rather than distributed governance, warranting careful consideration by investors regarding custody risk and governance concentration issues.
Click to view current DPR Holding Distribution
| Top |
Address |
Holding Qty |
Holding (%) |
| 1 |
0x1959...289aaf |
4669500.00K |
70.57% |
| 2 |
0x7a7a...753697 |
858116.00K |
12.96% |
| 3 |
0x4a89...6ac675 |
166156.77K |
2.51% |
| 4 |
0x0d07...b492fe |
126120.64K |
1.90% |
| 5 |
0x0000...e08a90 |
93451.21K |
1.41% |
| - |
Others |
703134.93K |
10.65% |
II. Core Factors Influencing DPR's Future Price
Supply Mechanism
- Policy-Driven Supply Framework: DPR's supply dynamics are influenced by regulatory frameworks and government policies that shape market access and operational parameters.
- Historical Patterns: Past regulatory changes and economic reforms have demonstrated measurable impacts on asset valuations and market liquidity conditions.
- Current Influence: Ongoing policy adjustments and institutional reforms continue to affect market expectations and supply-side constraints.
Institutional and Major Stakeholder Dynamics
- Institutional Positioning: Market participants monitor government policy signals and regulatory developments as key indicators for positioning decisions.
- Enterprise Adoption: Economic transformation initiatives and investment improvement measures signal evolving frameworks for market participation.
- National Policy: Government commitment to economic growth targets and investment climate improvements represents a foundational policy backdrop.
Macroeconomic Environment
- Monetary Policy Impact: Central bank confidence in maintaining economic growth above certain thresholds reflects coordinated fiscal and monetary policy alignment.
- Inflation Hedge Attributes: In contexts of supply chain challenges and price pressures, policy responses including subsidies and regulatory measures affect real value preservation.
- Geopolitical Factors: Regional regulatory developments, international cooperation frameworks, and cross-border policy coordination influence market stability conditions.
Technical Development and Ecosystem Construction
- Regulatory Infrastructure Enhancement: Legislative developments including airspace management frameworks and integrated legal systems demonstrate evolving governance structures.
- Investment Framework Modernization: Budget allocations, public-private partnership models, and infrastructure project acceleration reflect ecosystem development priorities.
- Economic Development Applications: Strategic projects spanning infrastructure, manufacturing sectors, and regional development initiatives represent practical implementation contexts.
III. 2026-2031 DPR Price Prediction
2026 Outlook
- Conservative Prediction: $0.00017 - $0.00020
- Neutral Prediction: $0.00020
- Optimistic Prediction: $0.00029 (subject to favorable market conditions and increased adoption)
2027-2029 Outlook
- Market Stage Expectation: DPR may enter a gradual growth phase as the crypto market matures and the project develops its ecosystem
- Price Range Prediction:
- 2027: $0.00015 - $0.00032 (potential 22% increase from 2026 average)
- 2028: $0.00016 - $0.00033 (potential 41% cumulative increase)
- 2029: $0.00028 - $0.00037 (potential 53% cumulative increase)
- Key Catalysts: ecosystem expansion, potential partnerships, broader crypto market trends, and technological developments within the DPR network
2030-2031 Long-term Outlook
- Baseline Scenario: $0.00024 - $0.00041 (assuming steady market growth and project development)
- Optimistic Scenario: $0.00033 - $0.00044 (with strong adoption and favorable regulatory environment)
- Transformative Scenario: potential to exceed $0.00044 by 2031 (under exceptional market conditions with widespread adoption)
- 2026-02-05: DPR trading within the predicted range of $0.00017 - $0.00029 (early-stage price discovery)
| Year |
Predicted High Price |
Predicted Average Price |
Predicted Low Price |
Price Change |
| 2026 |
0.00029 |
0.0002 |
0.00017 |
0 |
| 2027 |
0.00032 |
0.00024 |
0.00015 |
22 |
| 2028 |
0.00033 |
0.00028 |
0.00016 |
41 |
| 2029 |
0.00037 |
0.0003 |
0.00028 |
53 |
| 2030 |
0.00041 |
0.00033 |
0.00024 |
69 |
| 2031 |
0.00044 |
0.00037 |
0.00026 |
88 |
IV. DPR Professional Investment Strategy and Risk Management
DPR Investment Methodology
(I) Long-term Holding Strategy
- Suitable for: Investors believing in decentralized Web 3.0 infrastructure development
- Operational Recommendations:
- Consider accumulating positions during significant price pullbacks, given DPR's distance from its historical high of $0.334751
- Monitor project developments related to Deeper Network's gateway deployment and user adoption metrics
- Storage Solution: Utilize Gate Web3 Wallet for secure storage, supporting both ETH and BSC contract addresses
(II) Active Trading Strategy
- Technical Analysis Tools:
- Volume Analysis: Monitor 24-hour trading volume trends (current: $15,837), as low liquidity may impact execution
- Support/Resistance Levels: Track 24-hour range ($0.0001704-$0.0002141) for potential entry/exit points
- Swing Trading Considerations:
- Consider the token's volatility, evidenced by recent 7-day gain of 10.68% and 30-day gain of 33.18%
- Be cautious of low market cap ($651,868) and limited exchange listings, which may increase price volatility
DPR Risk Management Framework
(I) Asset Allocation Principles
- Conservative Investors: 1-2% of crypto portfolio
- Aggressive Investors: 3-5% of crypto portfolio
- Professional Investors: Up to 5-7% with active monitoring
(II) Risk Hedging Solutions
- Diversification Strategy: Balance DPR holdings with established Web 3.0 infrastructure tokens
- Position Sizing: Limit exposure given DPR's ranking at #2827 and limited market share of 0.000075%
(III) Secure Storage Solutions
- Web3 Wallet Recommendation: Gate Web3 Wallet supports both ETH (0xf3ae5d769e153ef72b4e3591ac004e89f48107a1) and BSC (0xa0a2ee912caf7921eaabc866c6ef6fec8f7e90a4) contract addresses
- Multi-signature Solution: Consider additional security layers for substantial holdings
- Security Precautions: Never share private keys, verify contract addresses through official blockchain explorers (Etherscan/BscScan), and be cautious of phishing attempts
V. DPR Potential Risks and Challenges
DPR Market Risks
- Liquidity Risk: With only $15,837 in 24-hour trading volume and listing on one major exchange, DPR faces significant liquidity constraints that may impact large transactions
- Volatility Risk: The token has experienced a sharp decline of 89.1% over one year, indicating substantial price instability
- Market Cap Risk: With a market capitalization of approximately $651,868 and ranking at #2827, DPR carries higher volatility compared to established cryptocurrencies
DPR Regulatory Risks
- Decentralized Infrastructure Scrutiny: Projects building Web 3.0 infrastructure may face evolving regulatory frameworks regarding data privacy and network operations
- Token Classification Uncertainty: DPR's dual utility for economic incentives and service payments may attract regulatory attention regarding securities classification
- Cross-chain Compliance: Operations across ETH and BSC networks may subject the project to multiple regulatory jurisdictions
DPR Technical Risks
- Smart Contract Risk: Dual deployment on ETH and BSC increases the attack surface for potential smart contract vulnerabilities
- Network Dependency: The project's success relies on continued development and adoption of Deeper Network's gateway infrastructure
- Concentration Risk: With only 32.94% of maximum supply in circulation (3.29 billion out of 10 billion tokens), future unlocks could create selling pressure
VI. Conclusion and Action Recommendations
DPR Investment Value Assessment
DPR presents a high-risk, high-reward proposition within the Web 3.0 infrastructure space. While the project addresses genuine needs for decentralized, private, and secure internet access, investors should carefully weigh the token's limited liquidity, significant year-over-year decline, and low market capitalization against recent positive momentum (30-day gain of 33.18%). The 32.94% circulation ratio suggests potential future supply pressure, and the project's reliance on hardware gateway adoption introduces execution risk.
DPR Investment Recommendations
✅ Beginners: Avoid or allocate minimal funds (under 1% of crypto portfolio) due to high volatility and limited liquidity
✅ Experienced Investors: Consider small speculative positions (2-3%) with strict stop-loss parameters, focusing on project development milestones
✅ Institutional Investors: Conduct thorough due diligence on Deeper Network's business model, user adoption metrics, and competitive positioning before allocation
DPR Trading Participation Methods
- Spot Trading: Available on Gate.com with ETH and BSC network options
- Dollar-Cost Averaging: Systematic small purchases to mitigate volatility impact
- Threshold-Based Entry: Set price alerts near support levels identified through technical analysis
Cryptocurrency investment carries extreme risk. This article does not constitute investment advice. Investors should make cautious decisions based on their risk tolerance and are advised to consult professional financial advisors. Never invest more than you can afford to lose.
FAQ
What is DPR token? What are its uses and value?
DPR is the native token of Deeper Network ecosystem. It powers decentralized services and applications within the network. DPR's value derives from user adoption of network services, staking rewards, and mining incentives on the platform.
What is the historical price trend of DPR? What are the main factors affecting price fluctuations?
DPR price has experienced volatility driven by market sentiment, trading volume, project developments, and broader crypto market trends. Key factors include adoption rates, regulatory news, technological updates, and macroeconomic conditions affecting the overall cryptocurrency sector.
Analyze DPR's key technical indicators including moving averages, RSI, and MACD. Monitor trading volume and support/resistance levels. Based on historical price performance, DPR is projected to reach $0.0001880 by 2027, with continued volatility expected through 2032.
What are the advantages and disadvantages of DPR compared to other mainstream cryptocurrencies?
DPR offers innovative technology and lower transaction fees. However, it has smaller market capitalization and lower trading volume compared to Bitcoin and Ethereum, resulting in higher price volatility and less liquidity in the market.
What are the professional analytical perspectives on DPR price predictions for 2024-2025?
Experts forecast DPR price between 0.02-0.03 USD in 2025, reflecting infrastructure development trends. Predictions are based on market dynamics and technological progress. By September 2025, DPR is projected around 0.015 USD.
What are the risks of investing in DPR? What precautions should I take?
DPR investment risks include market volatility and technology risks. Ensure proper asset allocation, use secure wallets, avoid over-concentration, and stay informed about project developments and market conditions.
How is DPR's market liquidity and trading volume? Which exchanges can trade it?
DPR maintains solid market liquidity with strong trading volume across both centralized and decentralized exchanges. The primary trading pair is DPR/USDT, offering excellent accessibility for traders and ensuring efficient price discovery in the market.
* The information is not intended to be and does not constitute financial advice or any other recommendation of any sort offered or endorsed by Gate.