This comprehensive analysis examines TAKER Protocol's price trajectory from 2026 to 2031, combining historical performance review, market dynamics, and ecosystem development factors. Currently trading at $0.003761 with extreme market fear sentiment, TAKER offers potential gradual appreciation opportunities for Bitcoin ecosystem investors willing to accept high volatility. The article provides professional price forecasts ranging from conservative to optimistic scenarios, actionable investment strategies including dollar-cost averaging and position sizing, and critical risk management frameworks tailored for different investor profiles. With 2026 predictions spanning $0.00363-$0.00459 and long-term potential exceeding $0.01161 by 2031, TAKER presents a high-risk, high-reward opportunity within the Bitcoin incentive layer ecosystem. Investors should utilize Gate exchange for spot trading and implement strict portfolio allocation limits of 1-12% based on risk tolerance and experience level.
Introduction: TAKER's Market Position and Investment Value
Taker Protocol (TAKER), positioned as the first and largest Bitcoin ecosystem incentive protocol designed to democratize Bitcoin gains for fractional holders, has been serving as a Bitcoin Incentive Layer. As of 2026, TAKER has a market capitalization of approximately $639,370, with a circulating supply of about 170 million tokens, and its price maintains around $0.003761. This asset, recognized as an innovative rewards framework within the Bitcoin ecosystem, is playing an increasingly important role in encouraging adoption and utilization of Bitcoin and its derivatives.
This article will comprehensively analyze TAKER's price trajectory from 2026 to 2031, combining historical patterns, market supply and demand dynamics, ecosystem development, and macroeconomic conditions to provide investors with professional price forecasts and practical investment strategies.
I. TAKER Price History Review and Market Status
TAKER Historical Price Evolution Trajectory
- 2025: Project launched in July with an initial offering price of $0.10, reaching an all-time high of $0.2252 on July 18, demonstrating strong early market interest
- 2025: Market correction phase occurred from July to December, with price declining from the peak of $0.2252 to an all-time low of $0.001687 on December 16, representing a significant adjustment period
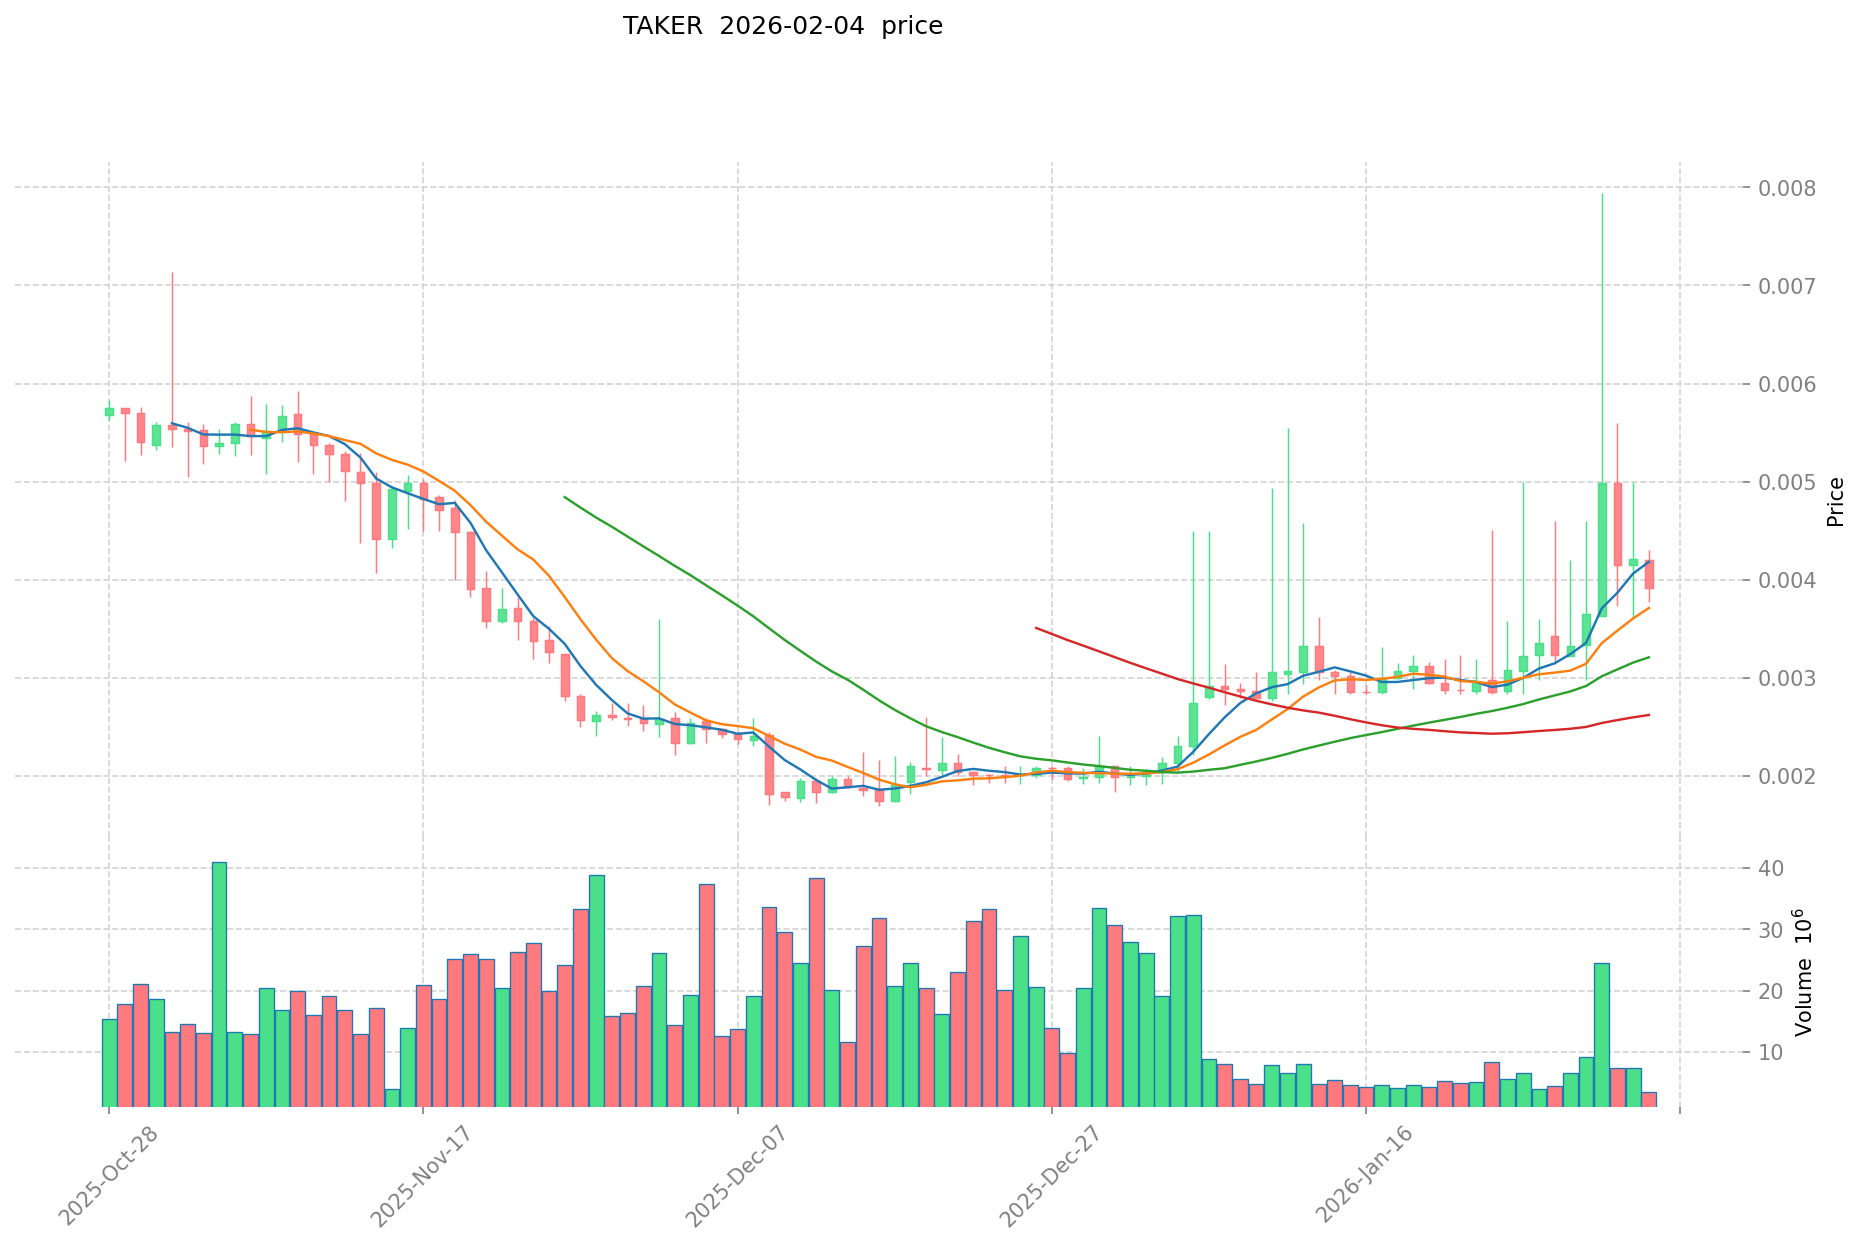
- 2026: Recovery phase beginning in early 2026, with price showing upward momentum, increasing by 30.43% over the past 30 days to reach $0.003761
TAKER Current Market Situation
As of February 5, 2026, TAKER is trading at $0.003761, with a 24-hour trading volume of $15,170.94. The token has experienced a 6.67% decrease over the past 24 hours, following a broader weekly decline of 9.15%. Despite short-term volatility, the token has demonstrated notable recovery momentum with a 30.43% gain over the past month.
The current market capitalization stands at approximately $639,370, with 170 million tokens in circulation, representing 17% of the total supply of 1 billion tokens. The fully diluted market cap is calculated at $3.76 million. TAKER's market dominance remains modest at 0.00014% of the total cryptocurrency market.
The token is deployed on the BSC (BEP-20) standard and is currently listed on 5 exchanges, with Gate.com being one of the primary trading platforms. The project has attracted 3,389 holders since its launch. Trading within the past 24 hours has ranged between a low of $0.003676 and a high of $0.004095.
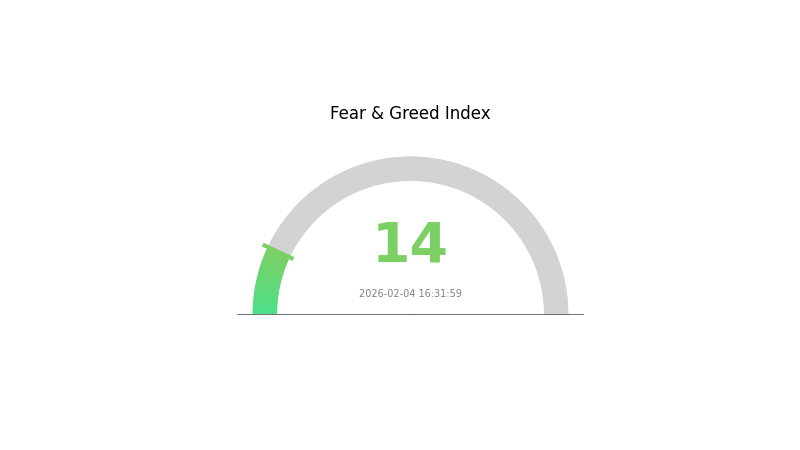
The current Fear & Greed Index reading of 14 indicates an "Extreme Fear" sentiment in the broader market, which may be influencing TAKER's recent price movements. The token remains considerably below its all-time high, trading at approximately 98.3% below its peak value.
Click to view the current TAKER market price
TAKER Market Sentiment Index
2026-02-04 Fear and Greed Index: 14 (Extreme Fear)
Click to view current Fear & Greed Index
The crypto market is currently experiencing extreme fear, with the Fear and Greed Index standing at 14. This exceptionally low reading indicates widespread investor pessimism and heightened market anxiety. During such periods, risk assets typically face selling pressure as participants adopt defensive positions. However, extreme fear historically presents contrarian opportunities for long-term investors, as panic-driven prices may deviate significantly from fundamental value. Traders should exercise caution and conduct thorough analysis before making investment decisions in this volatile environment.
TAKER Holdings Distribution
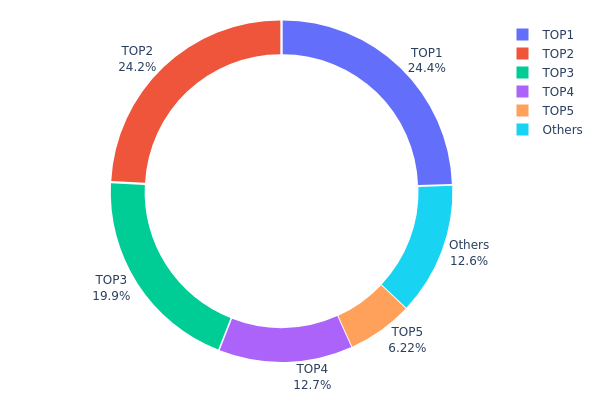
The holdings distribution chart reveals the concentration of token ownership across different wallet addresses, serving as a critical indicator of decentralization and market structure stability. As of February 5, 2026, TAKER's on-chain distribution exhibits a notably high concentration pattern that warrants careful examination.
The top five addresses collectively control approximately 87.4% of the total TAKER supply, with the leading address holding 24.44% (40,437.95K tokens) and the second-largest wallet maintaining 24.18% (39,998.00K tokens). The third-ranked address accounts for 19.86% of supply, while the fourth and fifth positions hold 12.70% and 6.22% respectively. This distribution pattern indicates significant centralization, as the remaining holders ("Others") collectively possess only 12.6% of the circulating supply.
This concentration level presents both structural vulnerabilities and market implications. The dominant position of the top two addresses, each controlling nearly one-quarter of the supply, creates potential for substantial price volatility should these holders decide to liquidate positions. Furthermore, the limited distribution among the top five addresses reduces the project's decentralization profile, potentially exposing the token to coordinated selling pressure or market manipulation risks. The relatively small percentage held by the broader holder base suggests limited retail participation and may indicate reduced liquidity depth during volatile market conditions.
Click to view current TAKER Holdings Distribution
| Top |
Address |
Holding Qty |
Holding (%) |
| 1 |
0x73d8...4946db |
40437.95K |
24.44% |
| 2 |
0x93de...85d976 |
39998.00K |
24.18% |
| 3 |
0x9355...87e6d9 |
32866.40K |
19.86% |
| 4 |
0x0d07...b492fe |
21022.46K |
12.70% |
| 5 |
0x13a5...a1dcdf |
10293.97K |
6.22% |
| - |
Others |
20796.33K |
12.6% |
II. Core Factors Influencing TAKER's Future Price
Market Demand and Adoption Trends
- Trading Volume Impact: TAKER's price trajectory is closely tied to overall market demand and trading activity. As market participants increasingly adopt the protocol, heightened trading volumes may contribute to price appreciation.
- Institutional Participation: The involvement of institutional investors plays a significant role in price dynamics. Greater institutional engagement could potentially enhance market depth and stability.
- Broader Economic Factors: Macroeconomic conditions, including monetary policy shifts and economic cycles, influence investor sentiment toward digital assets like TAKER.
Fee Structure and Trading Economics
- Maker-Taker Model: The protocol operates within a maker-taker fee framework, which affects trading costs across the ecosystem. Market participants who provide liquidity (makers) typically benefit from lower fees, while those accepting liquidity (takers) may face higher costs.
- Cost Optimization: As trading volumes fluctuate, the fee structure directly impacts the economic incentives for market participants, which in turn may influence demand for TAKER tokens.
- Exchange Dynamics: The distribution of trading activity across various platforms affects price discovery and liquidity, with centralized venues currently maintaining dominant market share.
- Protocol Infrastructure: The underlying technical architecture and ongoing development efforts contribute to long-term value proposition. Improvements in transaction efficiency and security may support sustained adoption.
- Ecosystem Integration: Integration with decentralized finance applications and cross-platform compatibility could expand use cases and strengthen the token's utility within the broader digital asset landscape.
Regulatory and Market Structure
- Compliance Environment: Evolving regulatory frameworks across jurisdictions may impact operational parameters and market access, influencing both short-term volatility and long-term viability.
- Market Sentiment: Investor perception, shaped by technical developments, partnership announcements, and competitive positioning, remains a key driver of price movements in the digital asset sector.
III. 2026-2031 TAKER Price Prediction
2026 Outlook
- Conservative Forecast: $0.00363 - $0.00382
- Neutral Forecast: $0.00382 - $0.00420
- Optimistic Forecast: $0.00420 - $0.00459 (requires favorable market conditions and increased adoption)
2027-2029 Mid-term Outlook
- Market Stage Expectation: The token may enter a gradual growth phase, with potential volatility as the project develops its ecosystem and user base
- Price Range Predictions:
- 2027: $0.00362 - $0.00593
- 2028: $0.00350 - $0.00633
- 2029: $0.00388 - $0.00769
- Key Catalysts: Platform development milestones, community expansion, broader market sentiment in the crypto sector, and potential integration with major exchanges like Gate.com
2030-2031 Long-term Outlook
- Base Scenario: $0.00616 - $0.00978 (assuming steady project development and moderate market conditions)
- Optimistic Scenario: $0.00741 - $0.01161 (assuming strong ecosystem growth, increased utility, and favorable regulatory environment)
- Transformative Scenario: Potential to exceed $0.01161 (requires exceptional adoption rates, major partnerships, and sustained bull market conditions)
- 2026-02-05: TAKER shows potential for gradual appreciation over the next five years, with predictions suggesting cumulative growth ranging from modest gains to potential increases exceeding 100% by 2031
| Year |
Predicted High Price |
Predicted Average Price |
Predicted Low Price |
Price Change |
| 2026 |
0.00459 |
0.00382 |
0.00363 |
1 |
| 2027 |
0.00593 |
0.0042 |
0.00362 |
11 |
| 2028 |
0.00633 |
0.00507 |
0.0035 |
34 |
| 2029 |
0.00769 |
0.0057 |
0.00388 |
51 |
| 2030 |
0.00978 |
0.0067 |
0.00616 |
78 |
| 2031 |
0.01161 |
0.00824 |
0.00741 |
119 |
IV. TAKER Professional Investment Strategy and Risk Management
TAKER Investment Methodology
(1) Long-term Holding Strategy
- Suitable for: Bitcoin ecosystem believers and long-term crypto investors seeking exposure to Bitcoin incentive protocols
- Operational Recommendations:
- Consider accumulating positions during market consolidation phases, with TAKER currently trading at approximately $0.003761, significantly below its historical high of $0.2252
- Implement dollar-cost averaging to mitigate volatility risk, particularly given the 24-hour price fluctuation range of $0.003676-$0.004095
- Storage Solution: Utilize Gate Web3 Wallet for secure storage, which supports BEP-20 tokens and provides comprehensive asset management features
(2) Active Trading Strategy
- Technical Analysis Tools:
- Volume Analysis: Monitor the 24-hour trading volume of approximately $15,171 to identify liquidity patterns and potential entry/exit points
- Support and Resistance Levels: Track the recent low of $0.001687 (ATL on December 16, 2025) as a critical support zone and $0.004095 (24-hour high) as immediate resistance
- Swing Trading Considerations:
- The 30-day price increase of 30.43% suggests potential medium-term momentum, though the 7-day decline of 9.15% indicates short-term consolidation
- Set stop-loss orders below key support levels to limit downside exposure in volatile market conditions
TAKER Risk Management Framework
(1) Asset Allocation Principles
- Conservative Investors: 1-3% of crypto portfolio allocation
- Aggressive Investors: 5-8% of crypto portfolio allocation
- Professional Investors: 8-12% of crypto portfolio allocation with active monitoring
(2) Risk Hedging Solutions
- Portfolio Diversification: Balance TAKER holdings with established cryptocurrencies and Bitcoin-related assets to reduce concentration risk
- Position Sizing: Limit single position exposure based on the token's relatively low market dominance of 0.00014% and circulating supply of 170 million tokens (17% of total supply)
(3) Secure Storage Solutions
- Hot Wallet Recommendation: Gate Web3 Wallet provides convenient access for active traders with multi-layer security protocols
- Cold Storage Solution: For long-term holdings exceeding $10,000, consider hardware wallet solutions with offline key management
- Security Precautions: Enable two-factor authentication, verify contract address (0xc19539eb93444523ec8f1432624924d2e6226546 on BSC), and never share private keys or seed phrases
V. TAKER Potential Risks and Challenges
TAKER Market Risks
- High Volatility: TAKER has experienced a 92.93% decline from its all-time high over the past year, demonstrating significant price volatility that may continue
- Low Liquidity: With a 24-hour trading volume of approximately $15,171 and market cap of $639,370, the token exhibits relatively limited liquidity compared to established cryptocurrencies
- Limited Exchange Availability: Currently listed on only 5 exchanges, which may restrict trading options and price discovery mechanisms
TAKER Regulatory Risks
- Bitcoin Derivative Classification: As a protocol incentivizing Bitcoin and its derivatives, TAKER may face evolving regulatory scrutiny regarding its classification and compliance requirements
- Cross-border Regulatory Uncertainty: Operating across multiple jurisdictions exposes the protocol to varying regulatory frameworks that could impact token utility and accessibility
- Securities Classification Risk: Depending on jurisdictional interpretation, TAKER's reward mechanisms could potentially be classified as securities, affecting its trading and distribution
TAKER Technical Risks
- Smart Contract Vulnerabilities: As a BEP-20 token operating on BSC, TAKER is subject to potential smart contract bugs or exploits that could affect token functionality
- Protocol Dependency: The project's reliance on Bitcoin ecosystem adoption and integration may limit growth if Bitcoin derivative markets develop more slowly than anticipated
- Centralization Concerns: With only 3,389 holders and 17% circulating supply, token distribution may be relatively concentrated, potentially affecting price stability and governance
VI. Conclusion and Action Recommendations
TAKER Investment Value Assessment
TAKER Protocol represents an innovative approach to Bitcoin ecosystem incentivization, backed by notable investors including Electric, DCG, Dragonfly, and Spartan. The protocol's mission to democratize Bitcoin gains for fractional holders addresses a genuine market need. However, the token faces significant challenges, including substantial price decline from historical highs, limited liquidity, and early-stage adoption metrics. The 30.43% increase over the past 30 days suggests some recovery momentum, but the 92.93% annual decline underscores the high-risk nature of this investment. Long-term value depends on successful protocol adoption, Bitcoin ecosystem growth, and the project's ability to scale its incentive mechanisms to millions of users as envisioned.
TAKER Investment Recommendations
✅ Beginners: Limit exposure to 1-2% of crypto portfolio, prioritize education about Bitcoin ecosystem protocols, and only invest amounts you can afford to lose completely. Consider observing project development for 3-6 months before establishing positions.
✅ Experienced Investors: Consider small speculative positions (3-5% of crypto portfolio) with strict risk management protocols. Monitor protocol adoption metrics, holder growth, and exchange listing developments. Implement systematic position scaling based on clearly defined technical and fundamental milestones.
✅ Institutional Investors: Conduct comprehensive due diligence on protocol mechanics, team background, and competitive positioning. Consider TAKER as a small-cap Bitcoin ecosystem play within a diversified crypto portfolio, with allocation not exceeding 2-3% of total crypto exposure. Establish direct communication channels with the project team for strategic updates.
TAKER Trading Participation Methods
- Spot Trading on Gate.com: Access TAKER through Gate.com's spot trading platform, which provides reliable liquidity and competitive trading fees for active position management
- Wallet Storage: Transfer tokens to Gate Web3 Wallet for secure self-custody, enabling participation in potential future protocol incentives and governance mechanisms
- Research and Monitor: Track project developments through official channels (https://taker.xyz/, https://twitter.com/TakerProtocol, and https://docs.taker.xyz/) to stay informed about protocol updates and ecosystem partnerships
Cryptocurrency investment carries extremely high risks, and this article does not constitute investment advice. Investors should make prudent decisions based on their own risk tolerance and are advised to consult professional financial advisors. Never invest more than you can afford to lose.
FAQ
What is the TAKER token? What are its main uses and application scenarios?
TAKER is the core token of Taker Protocol, enabling trading of Bitcoin derivatives while distributing on-chain and protocol revenues to users. Its main applications include yield expansion for BTC and derivative assets, serving as the dApp layer for the Bitcoin ecosystem.
What are the main factors affecting TAKER price?
TAKER price is primarily influenced by trading volumes, market supply and demand dynamics, user tier levels that determine fee rates, and overall cryptocurrency market volatility. Higher user tiers typically enjoy lower fees, which affects effective pricing.
How to predict TAKER token price? What analysis methods are available?
TAKER price prediction uses technical analysis(examining charts and trends)and fundamental analysis(evaluating project development and market demand). Monitor trading volume, market sentiment, and on-chain metrics for comprehensive forecasting.
Over the past year, TAKER price declined 90.39%. The highest price reached $0.08065, while the lowest dropped to $0.001276, reflecting significant market volatility in this period.
What are the risks of investing in TAKER tokens? What should I pay attention to?
Key risks include phishing attacks and fraudulent contracts. Protect your private keys, diversify investments, and avoid concentrated risk exposure. Exercise caution with token activities across multiple chains.
What are the advantages or disadvantages of TAKER compared to similar tokens?
TAKER offers high liquidity and low transaction fees with strong market fundamentals. However, it faces higher volatility compared to major cryptocurrencies. The token demonstrates solid utility and community support, positioning it competitively in the market.
* The information is not intended to be and does not constitute financial advice or any other recommendation of any sort offered or endorsed by Gate.