Master Japanese candlestick charts like a professional and explore the most well-known patterns with examples
Japanese Candlesticks: Definition and Overview
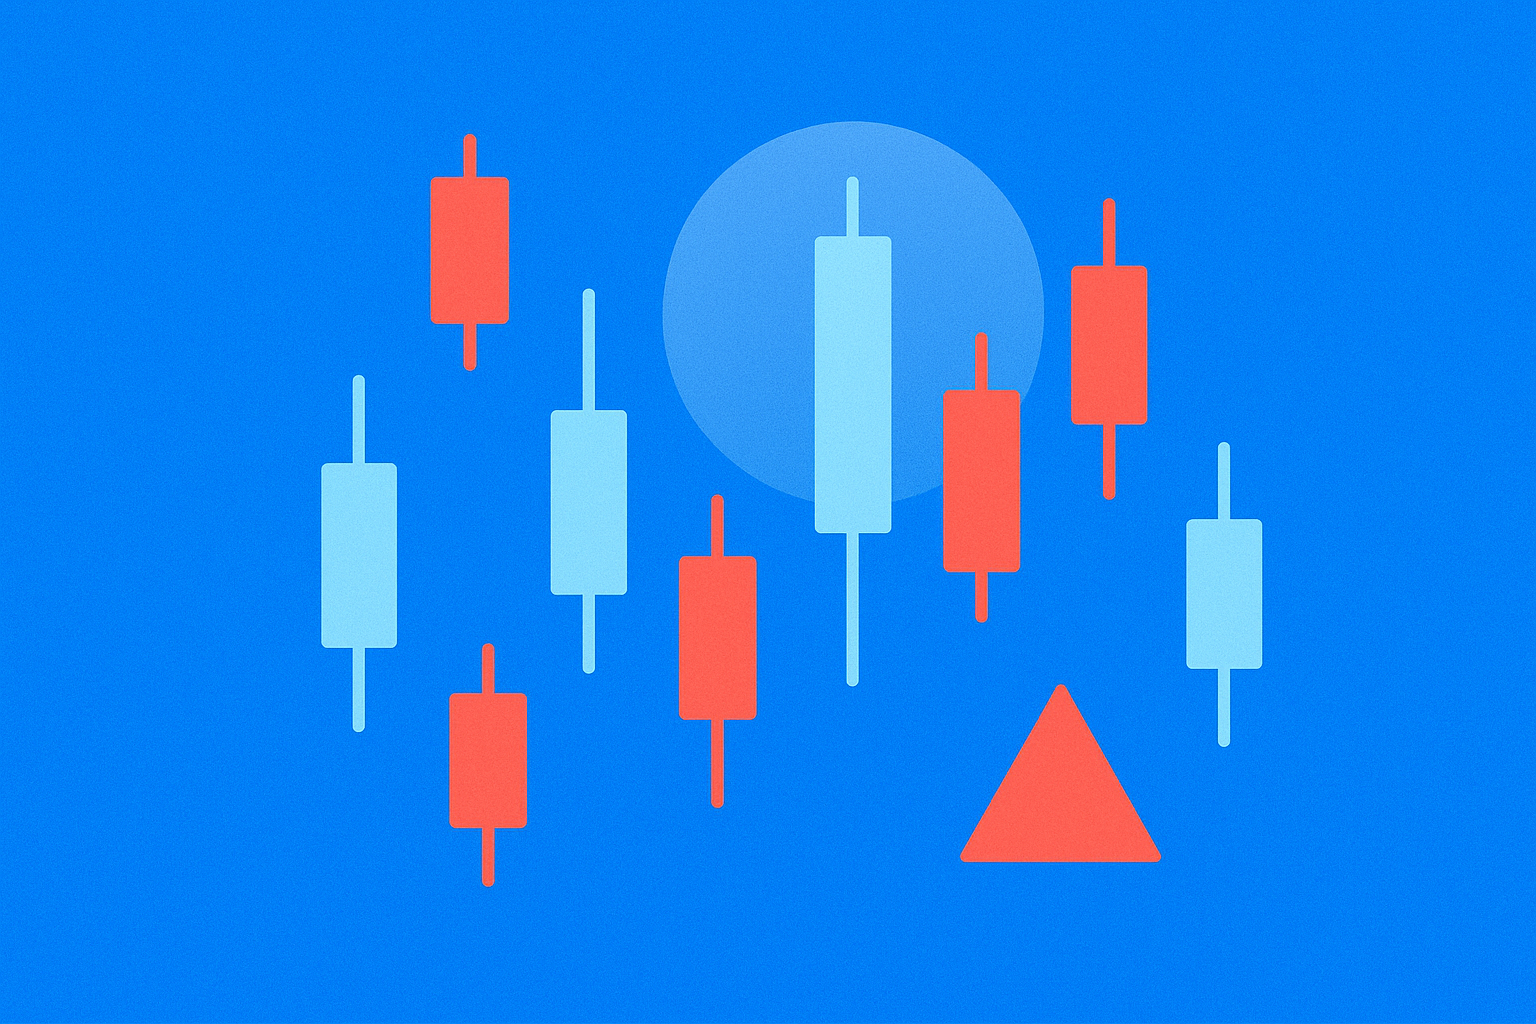
Japanese candlesticks are a centuries-old analytical tool used in financial markets to forecast future movements of financial assets. By analyzing candlesticks on price charts, traders can identify potential trends and anticipate market direction.
Beyond serving as a technical indicator, Japanese candlesticks mirror investor psychology and behavioral dynamics in response to price action. Each candlestick illustrates the ongoing battle between buyers and sellers within a defined time frame. Price movements—rises and declines—stem from the interplay of greed and fear in the market, and candlestick patterns have proven effective at predicting these recurring cycles.
In the cryptocurrency market, candlesticks are indispensable due to the sector’s volatility and rapid pace. Understanding candlestick patterns enables traders to make more informed decisions and manage trading risks.
How to Read Japanese Candlesticks
Every candlestick on a chart presents key data about price movement over a specific time interval, including:
- Highest price reached during the interval
- Lowest price reached in the same interval
- Closing price at the end of the candle
- Opening price at the start of the candle
- Trading volume, which reflects the intensity of buying or selling pressure during the candle’s formation
Candle Color: A green (or white, on some platforms) candle indicates a price increase—the close is higher than the open. A red (or black) candle signals a price decrease—the close is lower than the open.
Key Candlestick Components:
-
Body: The thick central part of the candle, representing the distance between the opening and closing prices. A large body shows strong buying pressure when green, or strong selling pressure when red. A small body suggests market indecision and a lack of clear direction.
-
Wick: The thin line extending above and below the body, representing the contest between buyers and sellers. A long wick indicates market rejection of a particular price level, while a short wick signals clear directional momentum.
-
Open: The price at which the candle begins.
-
Close: The price at which the candle ends and closes.
Candlestick Time Frame: Each candlestick represents a specific time interval chosen by the trader—one minute, five minutes, one hour, one day, one week, or even one month. The longer the time frame, the greater the significance and influence of the candlestick on the overall trend. For example, a weekly candlestick carries much more weight than a daily or hourly one.
Major Japanese Candlestick Patterns in Crypto Trading
Rather than memorizing patterns mechanically, focus on understanding the narrative each candlestick reveals. Every pattern reflects a particular market sentiment and hints at likely price movements.
Hammer Candlestick: In this pattern, price opens at a given level, then heavy selling drives it sharply down. Subsequently, increased buying pressure overcomes the sellers, and price rises back to the opening level or slightly above.
This pattern signals strong rejection of selling at lower price levels. It suggests market belief that the asset’s value should rise instead of fall further. Hammer candlesticks often indicate a possible bullish reversal, especially after a prolonged downtrend.
Bullish Engulfing: This pattern features two consecutive candles—the second, a large green candle, completely engulfs the preceding small red candle. It typically appears at the end of a downtrend and signals a strong shift toward upward momentum.
The prominent green body of the second candle demonstrates substantial buying strength entering the market, overpowering the previous selling pressure. This pattern is especially impactful on higher time frames, such as daily or weekly candles.
Bearish Engulfing: The bearish engulfing pattern is the inverse of the bullish version and forms at the end of an uptrend. It points to a potential reversal toward bearish movement. Here, a large red candle engulfs the prior small green candle.
The red candle’s body is much larger than the preceding green candle, highlighting robust rejection of buying pressure and the arrival of significant selling force. This pattern warns traders holding long positions to consider taking profits or exiting.
Morning Star Candle: Composed of three consecutive candles, the morning star is a powerful bullish reversal pattern. The first candle shows a strong downtrend with a large red body. The second (morning star) candle is small, reflecting market indecision and weakening bearish momentum.
The third candle reveals strong buying pressure with a large green body that closes above the midpoint of the first red candle. This pattern marks the gradual weakening of selling pressure, followed by a surge in buying strength. It usually develops at the end of a downtrend and reliably signals a new bullish direction.
Shooting Star: A single-candle pattern, the shooting star warns of a potential end to an uptrend. It features pronounced rejection at higher price levels. Price surges to a session high, but selling pressure overtakes, causing the close to fall near or below the open.
The long upper wick indicates buyers attempted to push the price upward, but sellers prevailed and rejected the high prices. This pattern often appears after a strong uptrend, signaling a possible reversal or at least a bearish correction.
Distinctive Features of the Cryptocurrency Market
The crypto market has unique characteristics that differentiate it from traditional financial sectors. Fluctuating trading volumes and the relative market capitalization of certain coins make it highly volatile and sensitive to news and events.
Such volatility makes mastering candlestick analysis essential—context, time frame, and accompanying trading volume all play critical roles in signal reliability, beyond mere pattern memorization.
Candlestick Patterns Alone Aren’t Sufficient: Always consider the broader market picture. What’s the prevailing trend for the cryptocurrency over the selected period? Is the environment generally bullish or bearish?
Key considerations when analyzing candlestick patterns:
- Are there recent technical updates or news related to the cryptocurrency or its project?
- How do global economic conditions affect risk markets overall?
- What geopolitical or regulatory developments might impact the crypto sector?
- What’s the trading volume accompanying the pattern? High volume lends credibility to the signal.
- Does the pattern occur near a major support or resistance level?
Combining candlestick analysis with fundamental insights and sentiment assessment yields a more holistic view and improves the odds of successful trading outcomes.
Candlestick Reading: A Skill Built Through Practice
Mastering candlestick analysis requires time and consistent practice. You can’t become an expert by memorizing patterns alone—hands-on experience and market observation are essential.
The best way to enhance your candlestick reading skills is to analyze a variety of charts and patterns. Focus on understanding the narrative behind each candlestick formation and the reasoning for subsequent price movements.
Start by reviewing historical price charts of different cryptocurrencies, identify recurring patterns, and observe how prices responded afterward. This exercise helps develop trading intuition and a deeper grasp of market psychology.
Every chart presents a unique story through its candlestick patterns. Learning to interpret these stories equips you to pursue sustainable trading profits.
Japanese candlesticks are among the most effective indicators for developing robust trading strategies and protecting your capital. They’re invaluable for designing risk management tactics, such as setting stop-loss and take-profit levels. Understanding candlesticks enables you to determine optimal entry and exit points, and where to place protective orders.
Always remember: successful trading depends not only on technical analysis, but also on psychological discipline and sound risk management. Candlestick analysis is most effective when integrated into a comprehensive trading framework that accounts for all market factors.
FAQ
What Are Japanese Candlesticks? What Do Their Four Core Elements Represent (Open, Close, High, Low)?
Japanese candlesticks are a price charting tool for analyzing cryptocurrencies. Their four core elements are: open price (first price in the period), close price (last price), high price (maximum reached), and low price (minimum recorded).
What Are the Most Common Japanese Candlestick Patterns? How Do You Identify Classic Patterns Like Hammer, Engulfing, and Morning Star With Examples?
Popular patterns include: hammer (small body, long lower wick—signals bullish reversal), bullish engulfing (bullish candle engulfs preceding bearish candle), and morning star (three candles indicate reversal of a downtrend). These patterns help pinpoint market turning points.
How Can You Judge Buy and Sell Signals in the Market Using Japanese Candlestick Patterns?
Candlestick patterns provide actionable signals: hammer and three white soldiers suggest buying opportunities, while three black crows and inverted hammer signal selling opportunities. These formations are highly effective for identifying market direction.
What Is the Difference and Relationship Between Japanese Candlestick Analysis and Other Technical Analysis Tools Like Moving Averages and MACD?
Candlestick analysis visually highlights price and volume patterns, while moving averages and MACD rely on mathematical formulas to identify trends. Candlesticks offer immediate, intuitive clarity; other indicators provide quantitative analysis. Combining all three methods enhances precision in forecasting price movements.
What Common Mistakes Should Beginners Avoid When Using Candlestick Patterns in Trading?
Avoid analyzing each candlestick in isolation or ignoring broader market context. Don't rely on single signals—filter out market noise and focus on strong patterns and major trends to improve trading decisions.
How Does Candlestick Pattern Analysis Vary Across Different Time Frames (Daily, 4-Hour, Hourly)?
Daily candlesticks reveal long-term trends and deliver stronger signals, while shorter intervals (4-hour, hourly) reflect short-term volatility and frequent pattern repetition. Longer time frames yield deeper, more reliable signals for traders.
Share
Content
How to Buy Cryptocurrency


Trending Cryptocurrencies


How to Withdraw Money from Crypto Exchanges in 2025: A Beginner's Guide
Hedera Hashgraph (HBAR): Founders, Technology, and Price Outlook to 2030

Jasmy Coin: A Japanese Crypto Tale of Ambition, Hype, and Hope
IOTA (MIOTA) – From Tangle Origins to 2025 Price Outlook
Bitcoin Price in 2025: Analysis and Market Trends

How to Trade Bitcoin in 2025: A Beginner's Guide

Top 6 Decentralized Exchanges: Comprehensive Guide to the Best DEX Platforms
APR vs. APY in Cryptocurrency: Key Differences Explained

2026 GARI Price Prediction: Expert Analysis and Market Forecast for the Upcoming Year
2026 EARNM Price Prediction: Expert Analysis and Market Forecast for the Coming Year
2026 RFC Price Prediction: Expert Analysis and Market Forecast for the Next Generation of Decentralized Finance