2026 CTP Price Prediction: Expert Analysis and Market Forecast for Cryptocurrency Trading Platform Token


Introduction: CTP's Market Position and Investment Value
Ctomorrow Platform (CTP), positioned as an innovative AI-powered skincare solution platform with an integrated Scan-to-Earn (S2E) reward system, has been developing its ecosystem since its launch in 2021. As of 2026, CTP maintains a market capitalization of approximately $1.53 million, with a circulating supply of around 1.5 billion tokens and a price hovering near $0.001. This asset, characterized by its unique combination of precision AI technology and blockchain-based rewards in the beauty tech sector, is gradually establishing its presence in the intersection of digital health and decentralized applications.
This article will comprehensively analyze CTP's price trends from 2026 to 2031, incorporating historical patterns, market supply-demand dynamics, ecosystem development, and macroeconomic conditions to provide investors with professional price forecasts and practical investment strategies.
I. CTP Price History Review and Market Status
CTP Historical Price Evolution Trajectory
- 2021: CTP launched with a publishing price of $0.012, establishing its initial market presence in the blockchain-based skincare AI sector
- 2024: The token experienced significant volatility, reaching an all-time high of $0.007032 on May 30, 2024, followed by a decline to an all-time low of $0.00077 on the same date, reflecting substantial market fluctuation
- 2024-2026: CTP entered a prolonged correction phase, with the price declining from its peak levels and experiencing a year-over-year decrease of approximately 74.72%
CTP Current Market Status
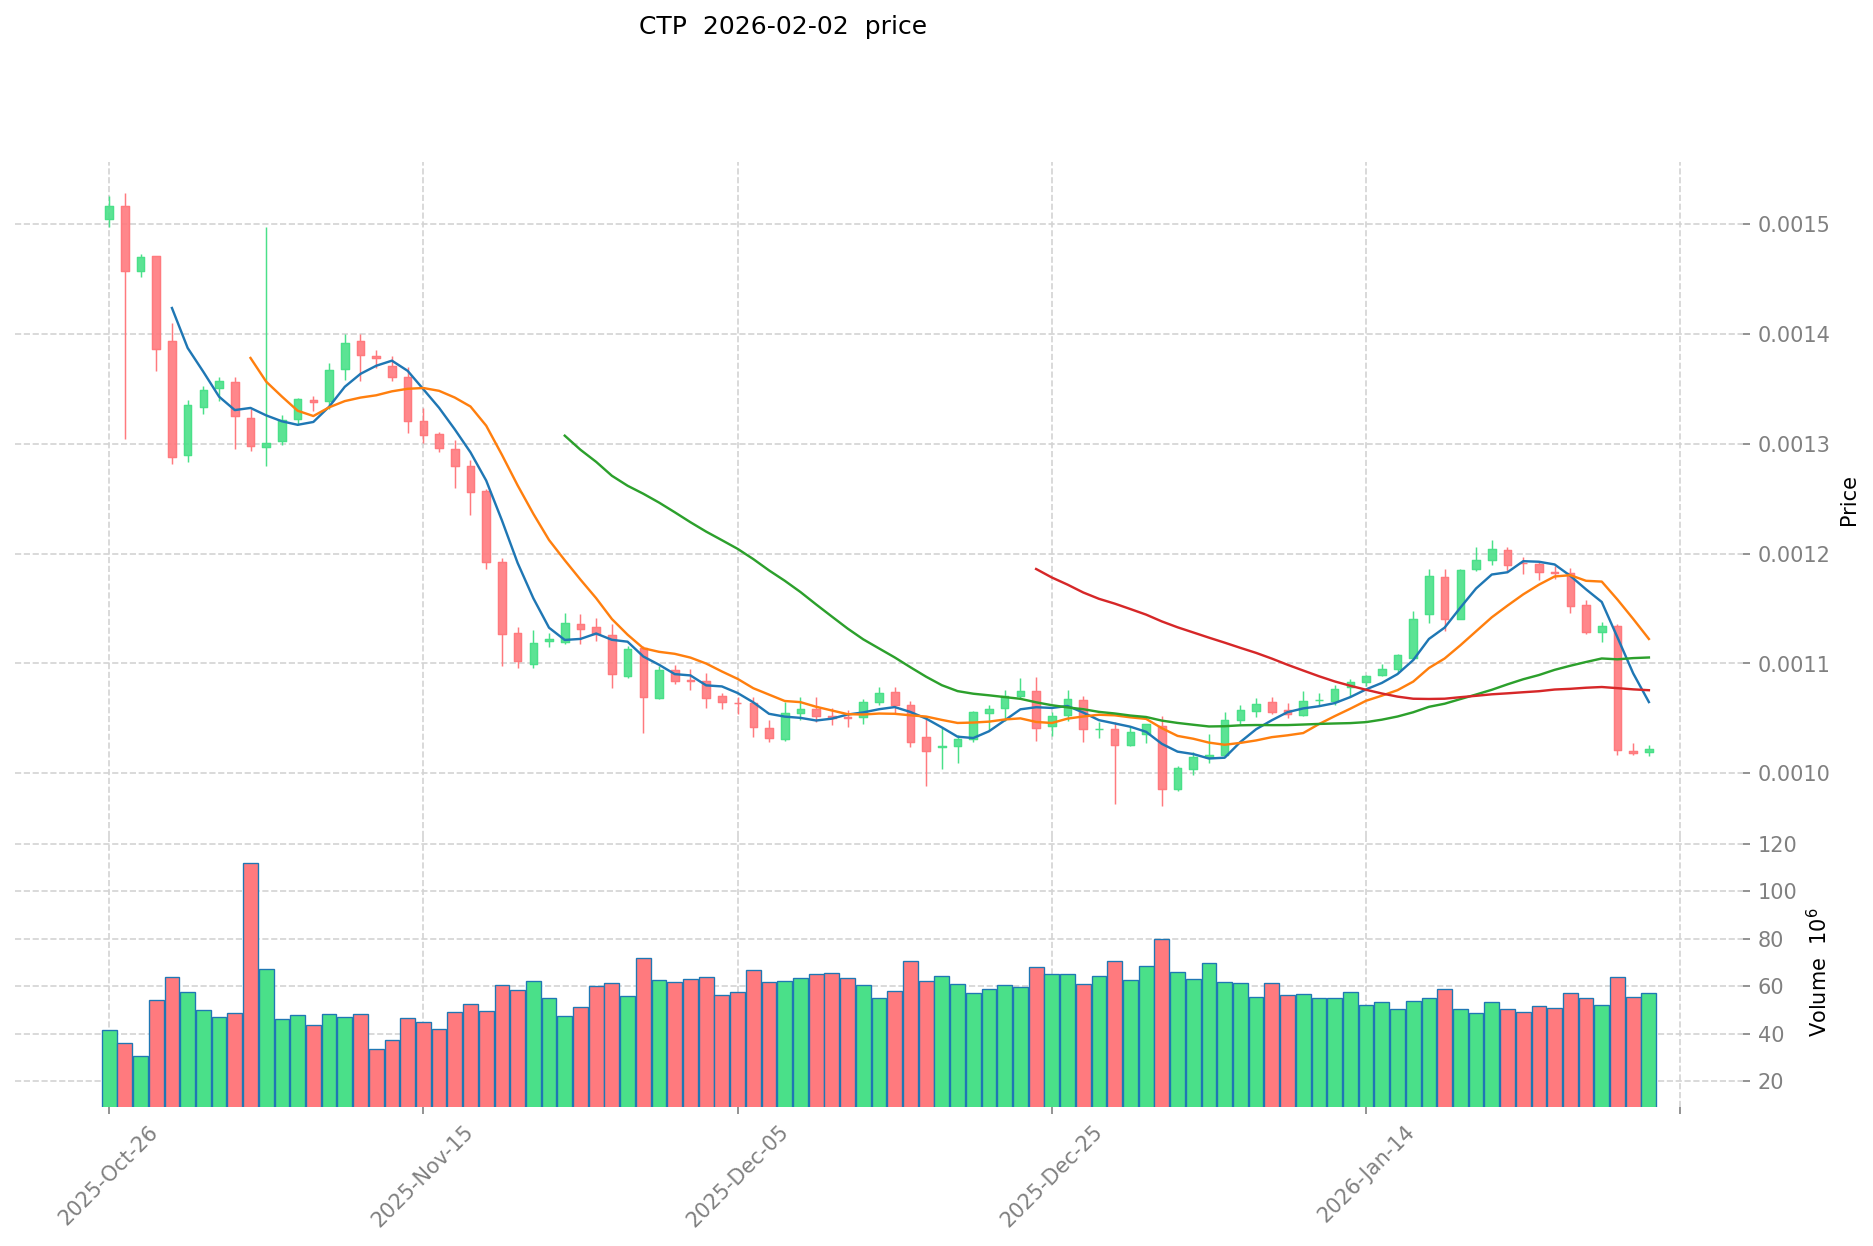
As of February 2, 2026, CTP is trading at $0.0010196, with a 24-hour trading volume of $58,650.92. The token has shown a modest 24-hour price change of 0.03%, with an intraday high of $0.0010256 and a low of $0.0010158.
The market capitalization stands at approximately $1.53 million, with a circulating supply of 1.5 billion tokens out of a maximum supply of 9 billion tokens, representing a circulation ratio of 16.67%. The fully diluted market cap is calculated at $9.18 million.
CTP currently ranks #2224 in the cryptocurrency market, holding a market dominance of 0.00033%. The token has experienced a notable 7-day decline of 14.26%, though it shows a 30-day gain of 1.3%. The token maintains a holder base of 19,076 addresses and is listed on 2 exchanges.
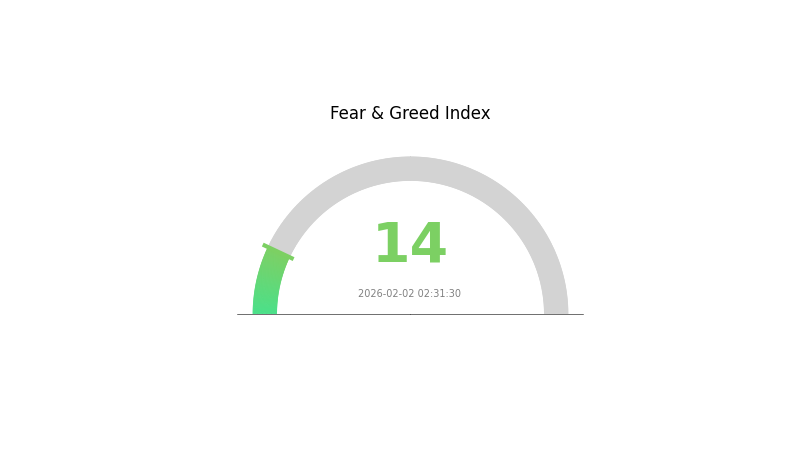
The current market sentiment index stands at 14, indicating an "Extreme Fear" condition in the broader market, which may be influencing CTP's price performance.
Click to view the current CTP market price
CTP Market Sentiment Index
2026-02-02 Fear and Greed Index: 14 (Extreme Fear)
Click to view current Fear & Greed Index
The cryptocurrency market is currently experiencing extreme fear with an index reading of 14. This exceptionally low score indicates heightened market anxiety and pessimistic sentiment among investors. When the fear and greed index drops to such extreme levels, it often signals potential accumulation opportunities for long-term investors, as market prices may be significantly undervalued. However, traders should remain cautious and conduct thorough research before making investment decisions during periods of extreme market fear.
CTP Holding Distribution
The holding distribution chart illustrates how CTP tokens are allocated across different wallet addresses, providing insights into the token's ownership concentration and decentralization level. This metric is crucial for understanding market structure and potential price dynamics.
Based on the current data, CTP exhibits a moderately high concentration pattern. The top address holds approximately 24.69% (2,222,723K tokens) of the total supply, while the top five addresses collectively control around 55.8% of all tokens. The remaining 44.2% is distributed among other addresses, indicating a relatively centralized ownership structure. This concentration level suggests that a small number of major holders possess significant influence over the token's market movements.
Such distribution characteristics present both opportunities and risks for market participants. On one hand, the substantial holdings by top addresses could indicate strong confidence from early investors or strategic partners. On the other hand, this concentration creates potential vulnerability to large-scale sell-offs, which could trigger significant price volatility. The current structure may also facilitate price manipulation scenarios, as coordinated actions among major holders could disproportionately impact market dynamics. Additionally, the limited decentralization raises questions about the token's long-term governance stability and community-driven development trajectory.
Click to view current CTP Holding Distribution
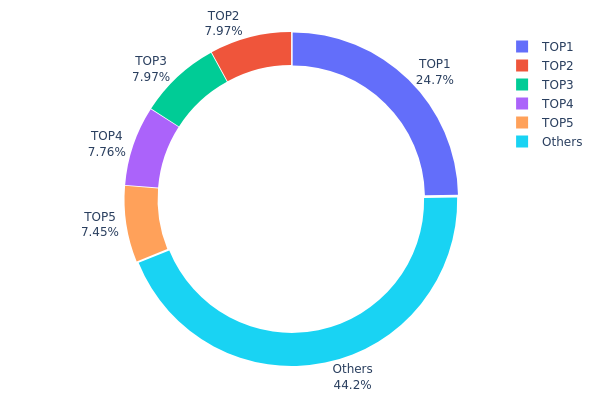
| Top | Address | Holding Qty | Holding (%) |
|---|---|---|---|
| 1 | 0xbba2...c6cf1e | 2222723.00K | 24.69% |
| 2 | 0x0bbf...456f10 | 716919.70K | 7.96% |
| 3 | 0x4353...69a44f | 716919.70K | 7.96% |
| 4 | 0x1e91...848ee8 | 698278.49K | 7.75% |
| 5 | 0x57fc...17b219 | 670347.35K | 7.44% |
| - | Others | 3974811.76K | 44.2% |
II. Core Factors Influencing CTP's Future Price
Supply Mechanism
- Raw Material Costs: Aluminum coil prices account for approximately 85% of CTP plate direct material costs, directly determining product costs. Global aluminum prices serve as a key influencing factor for CTP product costs and market prices.
- Historical Patterns: Aluminum price fluctuations have a significant impact on CTP plate prices. The cost structure demonstrates strong correlation between raw material pricing and final product valuation.
- Current Impact: Supply chain stability and aluminum market dynamics continue to shape CTP pricing structures. Material cost variations remain a primary driver of price movements in the current market environment.
Macroeconomic Environment
- Market Demand Factors: Industry growth and demand trends in Central and Eastern European markets for industrial and logistics real estate space influence CTP's expansion trajectory. Market fundamentals support sustained growth through 2030.
- Supply Chain Dynamics: Raw material price fluctuations and transportation costs affect overall product pricing. Short-term material price increases may lead to continued unit cost pressures.
- Policy Environment: Regulatory changes and tariff policies impact supply chain structures and pricing mechanisms within the industry.
III. 2026-2031 CTP Price Forecast
2026 Outlook
- Conservative Forecast: $0.00057 - $0.00102
- Neutral Forecast: Around $0.00102
- Optimistic Forecast: Up to $0.0012 (requires favorable market conditions and increased adoption)
2027-2029 Outlook
- Market Stage Expectation: Gradual growth phase with moderate volatility as the project establishes its market presence
- Price Range Forecast:
- 2027: $0.00107 - $0.00119 (approximately 8% change from 2026)
- 2028: $0.00062 - $0.00161 (approximately 12% change, with potential for increased fluctuation)
- 2029: $0.00088 - $0.00196 (approximately 35% change, indicating stronger upward momentum)
- Key Catalysts: Market maturity, ecosystem development, potential partnerships, and broader crypto market trends
2030-2031 Long-term Outlook
- Base Scenario: $0.00162 - $0.00242 (assuming steady project development and stable market conditions)
- Optimistic Scenario: $0.00167 - $0.00288 (assuming accelerated adoption and favorable regulatory environment)
- Transformative Scenario: Approaching $0.00288 (requires exceptional market conditions, significant technological breakthroughs, or major institutional adoption)
- 2026-02-02: CTP is positioned at the beginning of its forecast period with an average expected price of $0.00102
| Year | Predicted High Price | Predicted Average Price | Predicted Low Price | Price Change |
|---|---|---|---|---|
| 2026 | 0.0012 | 0.00102 | 0.00057 | 0 |
| 2027 | 0.00119 | 0.00111 | 0.00107 | 8 |
| 2028 | 0.00161 | 0.00115 | 0.00062 | 12 |
| 2029 | 0.00196 | 0.00138 | 0.00088 | 35 |
| 2030 | 0.00242 | 0.00167 | 0.00162 | 63 |
| 2031 | 0.00288 | 0.00204 | 0.00164 | 100 |
IV. CTP Professional Investment Strategy and Risk Management
CTP Investment Methodology
(1) Long-term Holding Strategy
- Suitable for: Investors seeking exposure to AI-powered skincare technology and blockchain-based reward systems
- Operational Recommendations:
- Consider accumulating positions during market downturns, given the token's historical volatility with a 74.72% decline over the past year
- Monitor the project's major app updates and data utilization developments, as these are priority goals for the current year
- Storage Solution: Use Gate Web3 Wallet for secure storage of CTP tokens on the BSC (BEP-20) network
(2) Active Trading Strategy
- Technical Analysis Tools:
- Volume Analysis: Monitor the 24-hour trading volume of approximately $58,650 to identify liquidity trends and potential entry/exit points
- Moving Averages: Track short-term price movements given the token's recent 14.26% decline over 7 days versus a modest 1.3% gain over 30 days
- Swing Trading Key Points:
- Consider the token's trading range between $0.0010158 (24h low) and $0.0010256 (24h high) for intraday opportunities
- Be aware of the significant distance from all-time high of $0.007032, suggesting potential recovery opportunities if project fundamentals strengthen
CTP Risk Management Framework
(1) Asset Allocation Principles
- Conservative Investors: 1-2% of crypto portfolio allocation
- Aggressive Investors: 3-5% of crypto portfolio allocation
- Professional Investors: Up to 5-8% with active monitoring
(2) Risk Hedging Solutions
- Position Sizing: Limit initial investment to small allocations given the token's low market cap of approximately $1.53 million and high volatility
- Dollar-Cost Averaging: Implement systematic purchasing to mitigate timing risk in this volatile low-cap asset
(3) Secure Storage Solutions
- Hot Wallet Recommendation: Gate Web3 Wallet for convenient access and trading on BSC network
- Security Precautions: Given the BEP-20 token standard, always verify contract address (0xb850cac12ab85d4400db61ac78dc5fc2418b6868) before transactions to avoid scams; never share private keys or seed phrases
V. CTP Potential Risks and Challenges
CTP Market Risks
- Liquidity Risk: With only 2 exchanges listing CTP and modest 24-hour trading volume of approximately $58,650, investors may face challenges executing large trades without significant price impact
- Volatility Risk: The token has experienced substantial price fluctuations, declining 74.72% over the past year while showing short-term instability with a 14.26% drop over 7 days
- Market Cap Risk: Ranking at #2,224 with a market share of only 0.00033%, CTP faces significant competition and limited market recognition
CTP Regulatory Risks
- Token Classification Uncertainty: As a utility token integrated with a consumer app-based reward system, regulatory clarity around its classification remains uncertain across different jurisdictions
- Platform Compliance: The S2E (Scan to Earn) model may face scrutiny from regulators examining crypto reward mechanisms and their potential classification
CTP Technical Risks
- Smart Contract Risk: As a BEP-20 token on BSC, CTP is subject to potential vulnerabilities in its contract code, though no specific audit information is available in the provided materials
- Centralization Risk: With only 16.67% of total supply currently circulating (1.5 billion out of 9 billion tokens), significant token unlock events could create selling pressure
- Platform Dependency: The token's value is closely tied to adoption of the CTomorrow app and its AI-powered skincare features; slower-than-expected user growth could negatively impact demand
VI. Conclusion and Action Recommendations
CTP Investment Value Assessment
CTP presents an innovative intersection of AI technology, skincare applications, and blockchain-based rewards through its S2E system. The project's focus on data utilization and major app updates suggests developmental momentum. However, significant risks persist: the token has declined 74.72% over the past year, maintains low liquidity with limited exchange listings, and holds a minimal 0.00033% market share. The substantial gap between circulating supply (16.67%) and total supply presents potential dilution concerns. While the 30-day performance shows modest recovery (1.3% gain), near-term volatility remains evident. Long-term value depends heavily on successful execution of the CTomorrow app roadmap and user adoption of the precision AI skincare platform.
CTP Investment Recommendations
✅ Beginners: Start with minimal allocation (0.5-1% of crypto portfolio) to gain exposure while limiting downside risk; focus on learning about the project's S2E model before increasing position size
✅ Experienced Investors: Consider small speculative positions (2-3% allocation) if confident in the AI skincare market opportunity; implement strict stop-loss levels given historical volatility
✅ Institutional Investors: Conduct thorough due diligence on tokenomics, particularly the vesting schedule for the remaining 83.33% of tokens; engage directly with the project team regarding roadmap execution and user metrics
CTP Trading Participation Methods
- Spot Trading on Gate.com: Access CTP/USDT trading pairs with competitive fees and liquidity
- Gate Web3 Wallet Integration: Store and manage CTP tokens securely while maintaining full control of private keys
- Dollar-Cost Averaging: Establish regular small purchases to build positions while mitigating timing risk in this volatile asset
Cryptocurrency investment carries extremely high risks, and this article does not constitute investment advice. Investors should make prudent decisions based on their own risk tolerance and are advised to consult professional financial advisors. Never invest more than you can afford to lose.
FAQ
What is CTP's historical price trend? What significant price fluctuations occurred in the past?
CTP has experienced significant price volatility throughout its history, with notable fluctuations in 2021 and 2022, followed by an uptrend in early 2023. The token has demonstrated both substantial gains and corrections, reflecting typical market dynamics.
What are the main factors affecting CTP price?
CTP price is driven by macroeconomic conditions, energy prices, policy changes, market demand, trading volume, and regulatory developments. These factors collectively determine CTP's market performance.
How to conduct CTP price technical analysis and prediction?
Analyze CTP price trends using moving averages and trendlines to identify market direction. Key indicators include crossover signals and K-line patterns. Combine multiple indicators for comprehensive technical analysis to enhance prediction accuracy.
What are the common analysis methods for CTP price prediction (such as K-line, moving averages, indicators, etc.)?
Common CTP price prediction methods include K-line charts, moving averages (MA), Relative Strength Index (RSI), and Bollinger Bands. These tools help identify trends and potential entry/exit points for trading decisions.
What is the current price of CTP? How is the recent price trend?
CTP is currently trading at $0. The recent price trend shows minimal fluctuation with no significant movement recorded. Market data indicates stable trading conditions as of February 2026.
What risks should I pay attention to when investing in CTP for price prediction trading?
CTP price prediction trading involves market volatility risk, liquidity risk, and regulatory uncertainty. Price fluctuations can be significant, and market conditions change rapidly. Conduct thorough research before trading and manage your position size carefully.
How is CTP's price volatility compared to similar assets?
CTP exhibits higher volatility than traditional assets due to its leverage trading characteristics. During significant market fluctuations, CTP can deliver substantial gains or losses, making it more volatile than comparable crypto assets.
What price predictions or outlooks do professional institutions have for CTP in the future?
Professional institutions project the global CTP battery tray market will reach approximately 14.04 billion USD by 2030. With rapid growth in new energy vehicles, CTP demand is expected to maintain strong upward trajectory, with sustained market expansion anticipated in coming years.
Share
Content
Introduction: CTP's Market Position and Investment Value
I. CTP Price History Review and Market Status
II. Core Factors Influencing CTP's Future Price
III. 2026-2031 CTP Price Forecast
IV. CTP Professional Investment Strategy and Risk Management
V. CTP Potential Risks and Challenges
VI. Conclusion and Action Recommendations
FAQ
How to Buy Cryptocurrency


Trending Cryptocurrencies


How to Withdraw Money from Crypto Exchanges in 2025: A Beginner's Guide

Hedera Hashgraph (HBAR): Founders, Technology, and Price Outlook to 2030
Jasmy Coin: A Japanese Crypto Tale of Ambition, Hype, and Hope

IOTA (MIOTA) – From Tangle Origins to 2025 Price Outlook

Bitcoin Price in 2025: Analysis and Market Trends

How to Trade Bitcoin in 2025: A Beginner's Guide

HELLO vs DOGE: Which Meme Coin Will Dominate the Crypto Market in 2024?

LIKE vs LRC: Understanding the Key Differences Between Two Popular Lyric Formats

FIR vs FIL: Understanding the Key Differences Between Finite Impulse Response and Finite Impulse Length Filters

SMURFCAT vs LINK: Which Token Will Dominate the DeFi Market in 2024?
Non-verification cryptocurrency exchanges: up-to-date alternatives