This comprehensive article analyzes KYO Finance's price trajectory from 2026 to 2031, combining historical performance, market dynamics, and ecosystem development. Starting from its December 2025 launch on Gate at $0.4552 peak before correction to current $0.02531, the analysis forecasts KYO reaching $0.03466-$0.04967 by 2031, representing 85% cumulative growth. The article examines core influencing factors including supply mechanisms, institutional dynamics, macroeconomic conditions, and technical development, while providing actionable investment strategies ranging from long-term holding to active trading approaches. Risk management frameworks and portfolio allocation guidelines are tailored for conservative, aggressive, and professional investors, emphasizing position sizing and secure storage solutions. Despite significant challenges including high volatility, liquidity constraints, and regulatory uncertainties inherent to emerging DeFi projects, KYO presents a speculative opportunity for investors comfor
Introduction: KYO's Market Position and Investment Value
Kyo Finance (KYO), as a comprehensive liquidity technology platform connecting multi-chain ecosystems through cross-chain solver technology, has been making strides in the DeFi landscape since its launch in 2025. As of 2026, KYO maintains a market capitalization of approximately $928,877, with a circulating supply of around 36.7 million tokens, and the price hovering at $0.02531. This asset, recognized as an innovative liquidity aggregation solution, is playing an increasingly vital role in enhancing decentralized exchange experiences and cross-chain liquidity provision.
This article will comprehensively analyze KYO's price trajectory from 2026 to 2031, combining historical patterns, market supply and demand dynamics, ecosystem development, and macroeconomic conditions to provide investors with professional price forecasts and practical investment strategies.
I. KYO Price Historical Review and Market Status
KYO Historical Price Evolution Trajectory
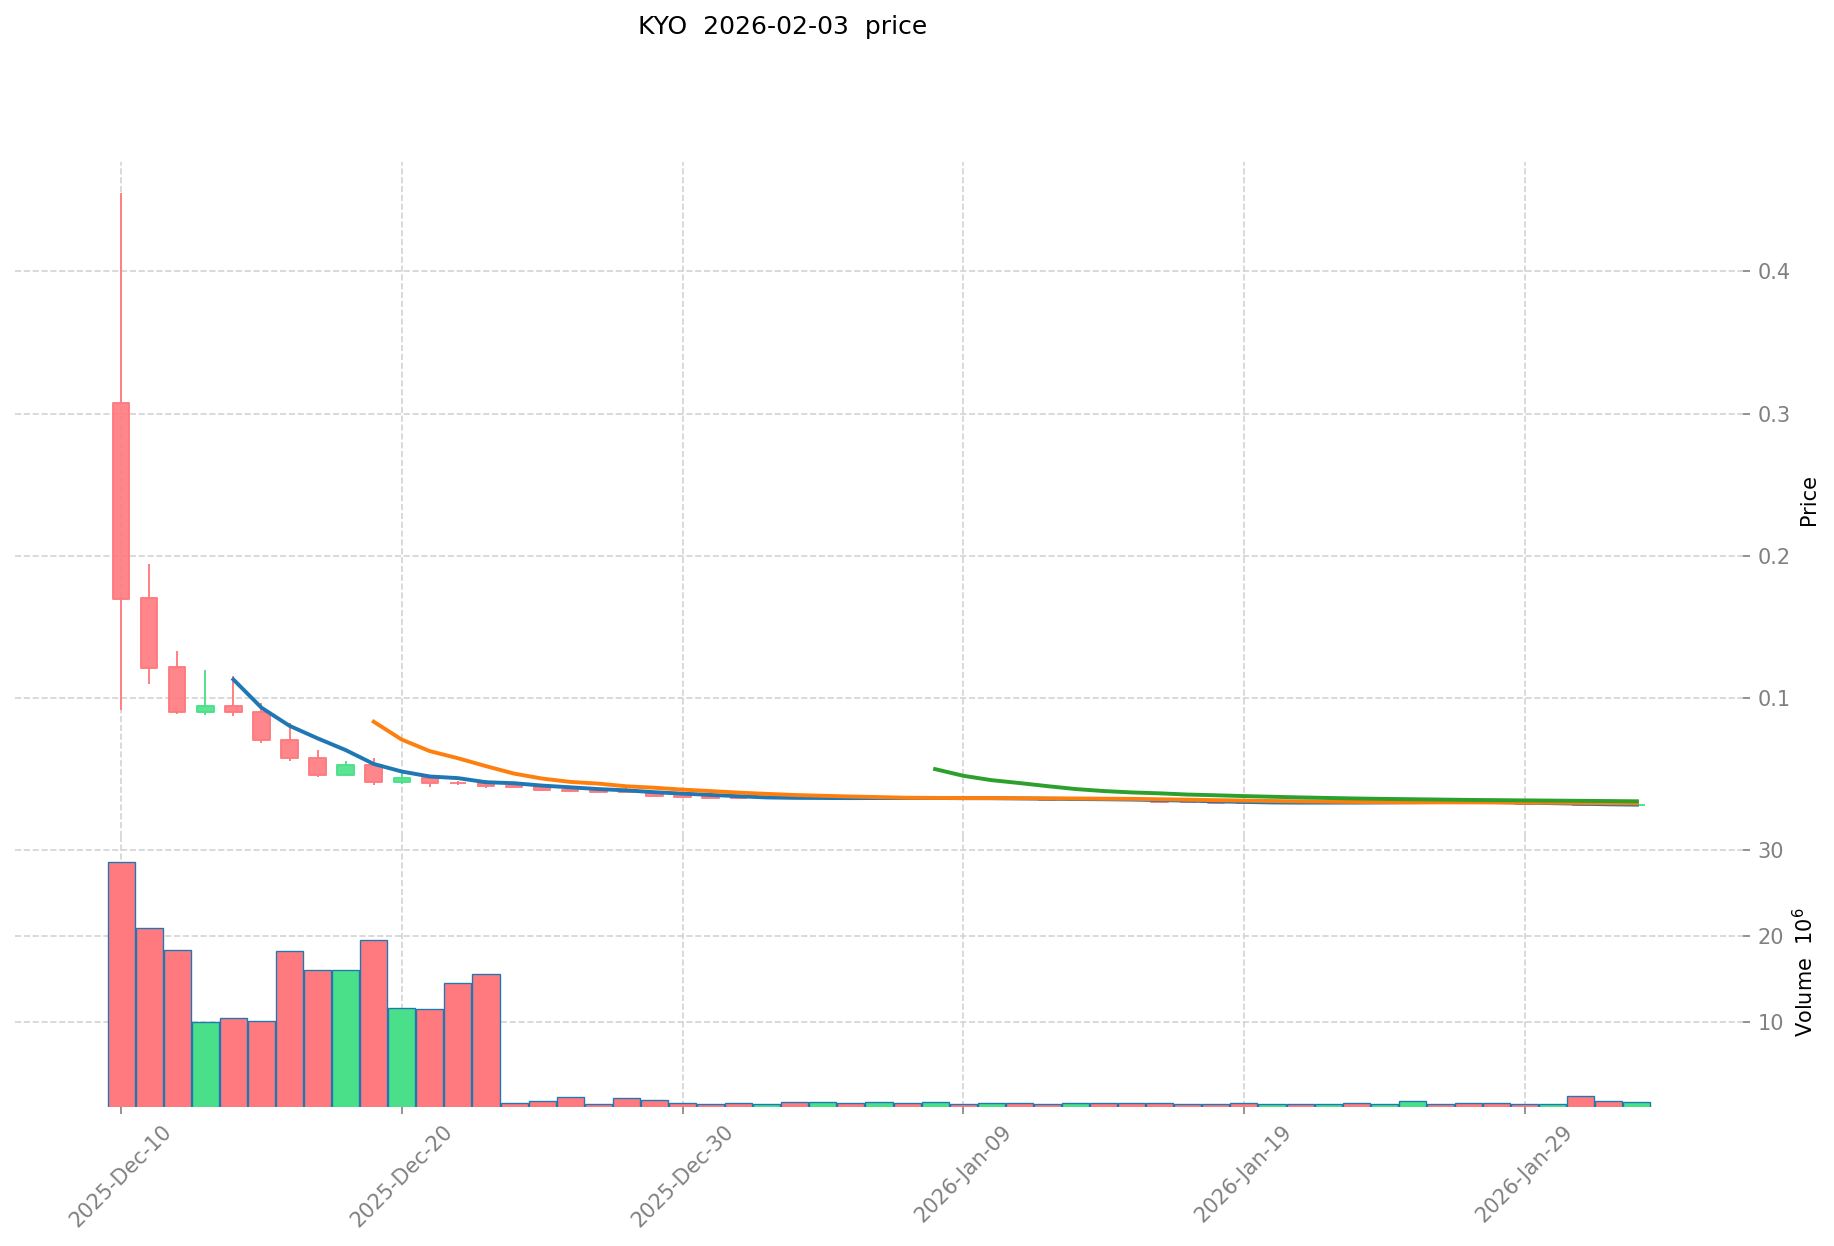
- December 2025: Token launched on Gate.com with initial trading, reaching a peak of $0.4552 on December 10, 2025, marking the all-time high since inception
- January 2026: Price experienced significant correction, declining approximately 47% from the December peak
- February 2026: Continued downward pressure, with price touching $0.0242 on February 1, 2026, establishing the all-time low
KYO Current Market Landscape
As of February 4, 2026, KYO is trading at $0.02531, showing a modest 24-hour increase of 1.19% despite recent volatility. The token has demonstrated mixed short-term performance, with a slight hourly decline of 0.35%, while facing more substantial pressure over longer timeframes with a 7-day decrease of 7.48% and a 30-day drop of 16.3%.
The trading range over the past 24 hours spans from $0.02451 to $0.02561, indicating relatively contained price movement. Daily trading volume stands at approximately $19,049, reflecting moderate market activity for this liquidity technology platform token.
With 36.7 million KYO tokens in circulation out of a maximum supply of 200 million tokens, the current circulating supply represents 18.35% of the total token allocation. The market capitalization reaches approximately $928,877, while the fully diluted valuation stands at around $5.062 million. The token maintains a market dominance of 0.00018% and ranks #2,559 in the broader cryptocurrency market.
KYO employs the ERC-20 token standard and has attracted a community of 1,962 holders. The token is currently available for trading on 6 exchanges, with Gate.com serving as one of the primary trading venues. The project has secured backing from notable investors including Startale, Soneium Spark Fund, TBV, BuzzBridge Capital, and Castrum Capital.
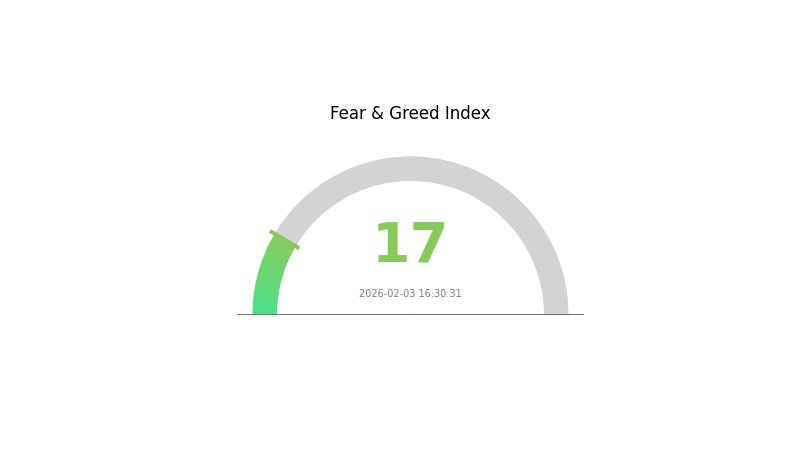
The broader market sentiment indicator shows extreme fear at a level of 17, which may be contributing to the downward pressure observed across the cryptocurrency sector, including KYO's recent price performance.
Click to view current KYO market price
KYO Market Sentiment Index
2026-02-03 Fear and Greed Index: 17 (Extreme Fear)
Click to view current Fear & Greed Index
The cryptocurrency market is currently experiencing extreme fear, with the Fear and Greed Index dropping to 17. This reading suggests strong negative sentiment among investors, indicating potential capitulation and heightened risk aversion. During such periods of extreme fear, contrarian investors often view this as a potential accumulation opportunity, while risk-averse traders may prefer to stay on the sidelines. Market volatility is likely to remain elevated, and traders should exercise caution and maintain strict risk management protocols when navigating these turbulent conditions.
KYO Holding Distribution
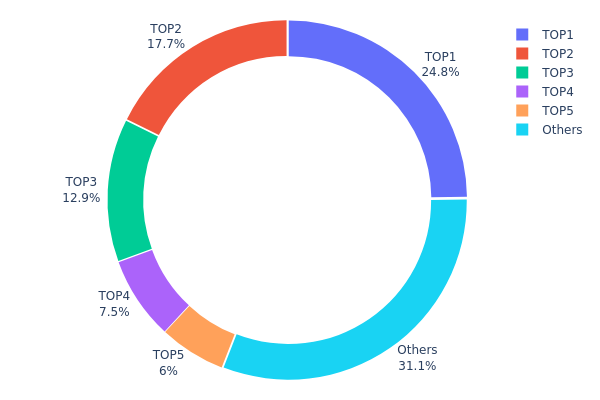
The holding distribution chart illustrates the concentration of token ownership across different wallet addresses, serving as a critical indicator of market decentralization and potential price manipulation risks. By analyzing the distribution pattern, investors can assess whether a cryptocurrency's supply is broadly dispersed among numerous holders or concentrated within a limited number of whale addresses.
Based on the current data, KYO exhibits a moderate to high concentration level. The top five addresses collectively control approximately 68.87% of the total supply, with the largest single holder possessing 24.82% (19,230.77K KYO). The second and third largest addresses hold 17.67% and 12.90% respectively, while the remaining addresses in the top five maintain holdings between 5.99% and 7.49%. Only 31.13% of the supply is distributed among other addresses, indicating a relatively centralized ownership structure.
This concentration pattern presents several implications for market dynamics. The significant holdings by top addresses create potential vulnerabilities to large-scale selling pressure, as any major holder's decision to liquidate could trigger substantial price volatility. Additionally, the current distribution suggests limited decentralization, which may concern investors seeking projects with broader community participation. However, it's worth noting that some concentrated addresses might belong to project treasury wallets, exchange cold storage, or liquidity pools rather than individual whales, which could partially mitigate manipulation concerns if properly verified through on-chain analysis.
Click to view current KYO Holding Distribution
| Top |
Address |
Holding Qty |
Holding (%) |
| 1 |
0x12bd...4f114c |
19230.77K |
24.82% |
| 2 |
0x5ee6...5a2a38 |
13689.23K |
17.67% |
| 3 |
0x91ee...09a438 |
10000.00K |
12.90% |
| 4 |
0x2fe5...56073e |
5806.67K |
7.49% |
| 5 |
0x69dd...6733cf |
4645.33K |
5.99% |
| - |
Others |
24099.40K |
31.13% |
II. Core Factors Influencing KYO's Future Price
Supply Mechanism
- Halving Events: Halving mechanisms can reduce token circulation supply, potentially creating scarcity dynamics that historically have influenced price movements in the cryptocurrency market.
- Historical Patterns: Past halving events in the broader crypto ecosystem have often been associated with notable price volatility, though outcomes vary based on market conditions and broader adoption trends.
- Current Impact: Future halving events for KYO may contribute to shifts in supply-demand balance, though their effect will depend on concurrent market sentiment and trading volume.
Institutional and Major Holder Dynamics
- Whale Activity: Large-scale capital movements by major holders can significantly impact KYO's price trajectory, as substantial buy or sell orders may influence market liquidity and investor sentiment.
- Regulatory Developments: Potential approval of cryptocurrency-related financial products, such as spot ETFs, could affect institutional participation and trading patterns across the digital asset space.
- Exchange Listings: Listing on additional trading platforms may enhance accessibility and liquidity for KYO, potentially influencing price discovery mechanisms.
Macroeconomic Environment
- Global Economic Events: The cryptocurrency market often responds to international economic developments, including shifts in monetary policy, inflation trends, and geopolitical situations.
- Market Liquidity: Overall liquidity conditions in digital asset markets can affect trading depth and price stability for tokens like KYO.
- Competitive Landscape: The presence of competing projects and evolving market narratives may influence investor allocation decisions and relative positioning.
Technical Development and Ecosystem Building
- Ethereum Network Updates: As certain tokens operate within the Ethereum ecosystem, upgrades to Ethereum's infrastructure may have indirect effects on associated projects.
- Market Competition: The cryptocurrency space features ongoing innovation and competition, with various projects vying for market share and user adoption.
- Trading Depth: Early-stage exchange listings may initially feature limited trading depth, which can contribute to price volatility during periods of lower investor confidence.
III. 2026-2031 KYO Price Forecast
2026 Outlook
- Conservative forecast: $0.01442 - $0.0253
- Neutral forecast: Around $0.0253
- Optimistic forecast: Up to $0.03466 (requires favorable market conditions and increased adoption)
2027-2029 Outlook
- Market stage expectation: Gradual growth phase with progressive price appreciation
- Price range forecast:
- 2027: $0.02279 - $0.03268 (18% year-over-year change)
- 2028: $0.02412 - $0.0376 (23% year-over-year change)
- 2029: $0.01758 - $0.04997 (36% year-over-year change)
- Key catalysts: Sustained ecosystem development, expanding user base, and broader market recovery trends
2030-2031 Long-term Outlook
- Baseline scenario: $0.0342 - $0.04222 (assuming steady market growth and project maturation)
- Optimistic scenario: $0.04222 - $0.0515 (with enhanced platform utility and favorable regulatory environment)
- Growth trajectory: 2030 projected at $0.0342 - $0.0515 (66% cumulative change from 2026), while 2031 estimates range from $0.04077 to $0.04967 (85% cumulative change from 2026)
- February 4, 2026: KYO baseline price approximately $0.0253 (early-stage valuation)
| Year |
Predicted High Price |
Predicted Average Price |
Predicted Low Price |
Price Change |
| 2026 |
0.03466 |
0.0253 |
0.01442 |
0 |
| 2027 |
0.03268 |
0.02998 |
0.02279 |
18 |
| 2028 |
0.0376 |
0.03133 |
0.02412 |
23 |
| 2029 |
0.04997 |
0.03446 |
0.01758 |
36 |
| 2030 |
0.0515 |
0.04222 |
0.0342 |
66 |
| 2031 |
0.04967 |
0.04686 |
0.04077 |
85 |
IV. KYO Professional Investment Strategies and Risk Management
KYO Investment Methodology
(I) Long-Term Holding Strategy
- Suitable for: Long-term crypto investors seeking exposure to cross-chain liquidity infrastructure
- Operational Recommendations:
- Consider dollar-cost averaging to mitigate entry timing risk
- Monitor development milestones and partnership announcements from backers like Startale and Soneium Spark Fund
- Utilize Gate Web3 Wallet for secure long-term storage with multi-signature protection
(II) Active Trading Strategy
- Technical Analysis Tools:
- Moving Averages: Track the 50-day and 200-day moving averages to identify potential trend reversals
- Volume Analysis: Monitor 24-hour trading volume (currently $19,049) relative to historical averages to gauge market interest
- Key Points for Swing Trading:
- Watch the recent 24-hour range of $0.02451-$0.02561 for breakout opportunities
- Set stop-loss orders below recent support levels to manage downside risk
KYO Risk Management Framework
(I) Asset Allocation Principles
- Conservative Investors: 1-3% of total crypto portfolio
- Aggressive Investors: 5-8% of total crypto portfolio
- Professional Investors: Up to 10% with active hedging strategies
(II) Risk Hedging Solutions
- Position Sizing: Limit single-position exposure to minimize impact from adverse price movements
- Portfolio Diversification: Balance KYO holdings with established assets and stablecoins
(III) Secure Storage Solutions
- Hot Wallet Recommendation: Gate Web3 Wallet for convenient trading and staking access
- Cold Storage Solution: Hardware wallet storage for long-term holdings exceeding short-term trading needs
- Security Precautions: Enable two-factor authentication, verify contract address (0xb8f28c60dd8240141185a192fa4156a23e189305), and never share private keys
V. KYO Potential Risks and Challenges
KYO Market Risks
- High Volatility: Recent 30-day decline of 16.3% reflects typical volatility in emerging DeFi projects
- Low Liquidity: With a market cap of approximately $928,877 and only 18.35% of tokens circulating, liquidity constraints may amplify price swings
- Competitive Landscape: Cross-chain liquidity solutions face intense competition from established protocols
KYO Regulatory Risks
- DeFi Regulatory Uncertainty: Evolving global regulations on decentralized finance may impact platform operations
- Cross-Chain Compliance: Multi-chain operations may face varying regulatory requirements across different jurisdictions
- Token Classification: Potential regulatory scrutiny regarding token utility and securities classification
KYO Technical Risks
- Smart Contract Vulnerabilities: As an ERC-20 token on Ethereum, exposure to potential contract exploits or bugs
- Cross-Chain Bridge Risks: Solver technology connecting multiple chains introduces additional technical complexity and attack vectors
- Integration Dependencies: Platform functionality relies on successful integration with partner ecosystems
VI. Conclusion and Action Recommendations
KYO Investment Value Assessment
KYO presents a speculative opportunity in the cross-chain liquidity infrastructure space, backed by notable investors including Startale and Soneium Spark Fund. The platform's white-label DEX solutions and cross-chain solver technology address genuine market needs. However, the token faces significant short-term headwinds, including a 16.3% decline over 30 days and limited liquidity with only 18.35% of supply circulating. The project's long-term value depends on successful execution of its technology roadmap and adoption of its white-label solutions.
KYO Investment Recommendations
✅ Beginners: Consider waiting for increased market stability and liquidity before establishing positions; if participating, limit exposure to less than 2% of total portfolio
✅ Experienced Investors: Evaluate technical developments and partnership progress; consider small speculative positions with strict risk management protocols
✅ Institutional Investors: Conduct comprehensive due diligence on cross-chain technology and competitive positioning; assess liquidity requirements against current trading volumes
KYO Trading Participation Methods
- Spot Trading: Purchase KYO directly on Gate.com with fiat or cryptocurrency
- Gradual Accumulation: Implement dollar-cost averaging strategy to smooth out entry prices
- Active Monitoring: Track platform developments and trading volume trends on Gate.com analytics tools
Cryptocurrency investments carry extremely high risks, and this article does not constitute investment advice. Investors should make cautious decisions based on their own risk tolerance and are advised to consult professional financial advisors. Never invest more than you can afford to lose.
FAQ
What is KYO token? What are its uses and value?
KYO is the native token of Kiyo Network, used for ecosystem governance and user incentives. It rewards network participants and drives community engagement. KYO has deflationary tokenomics and offers airdrop opportunities for early supporters.
How to predict KYO price trends? What are the analysis methods?
Predict KYO price using technical analysis like moving averages and RSI indicators, combined with fundamental analysis monitoring market performance, trading volume, and industry news developments.
What are the main factors affecting KYO price?
KYO price is primarily influenced by market sentiment, investor confidence, and adoption trends. Technical developments, trading volume, and broader cryptocurrency market conditions also play significant roles in price fluctuations.
What are the risks and limitations of KYO price predictions?
KYO price predictions face market volatility, policy changes, and sentiment fluctuations. Predictions rely on historical data which may not reflect future trends, and sudden market events can cause significant deviations from forecasts.
What is the price prediction for KYO in 2024-2025?
Based on 2026 data, KYO's average price prediction for 2024-2025 is ¥0.1786, with potential fluctuations between ¥0.1178 and ¥0.1857.
What are the advantages and disadvantages of KYO compared to other tokens?
KYO offers real-world rewards through its decentralized economy and unique player engagement focus. However, its niche market positioning may limit broader adoption compared to more mainstream tokens with wider use cases.
* The information is not intended to be and does not constitute financial advice or any other recommendation of any sort offered or endorsed by Gate.