This comprehensive analysis compares BitcoinOS (BOS) and Tezos (XTZ), two distinct blockchain platforms with different technological foundations and market positions. BOS, launched in 2024, enables Bitcoin programmability through zero-knowledge proofs, while XTZ, operational since 2017, offers a self-evolving smart contract platform with formal verification capabilities. The article examines historical price trends, current market status (BOS at $0.002007 vs XTZ at $0.4667), tokenomics, institutional adoption, and technical ecosystems. It provides detailed price predictions through 2031 and outlines tailored investment strategies for conservative, aggressive, and institutional investors. Risk analysis highlights BOS's higher volatility and limited liquidity against XTZ's market maturity and stability. The guide concludes that XTZ suits conservative investors seeking established platforms with strong liquidity on Gate, while experienced investors may balance both assets based on risk tolerance and investment h
Introduction: Investment Comparison Between BOS and XTZ
In the cryptocurrency market, the comparison between BOS vs XTZ has become a topic of interest for investors. These two assets differ significantly in market cap ranking, application scenarios, and price performance, representing distinct positions within the crypto asset landscape.
BitcoinOS (BOS): Launched in 2024, this platform has gained market attention by enabling programmability on Bitcoin without modifying its base protocol through zero-knowledge proof technology.
Tezos (XTZ): Since its inception in 2017, it has been recognized as a self-evolving decentralized blockchain, positioning itself as one of the established smart contract platforms with formal verification capabilities.
This article will provide a comprehensive analysis of BOS vs XTZ investment value comparison, covering historical price trends, supply mechanisms, institutional adoption, technical ecosystem, and future projections, attempting to address the question most investors care about:
"Which is the better buy right now?"
I. Historical Price Comparison and Current Market Status
BitcoinOS (BOS) and Tezos (XTZ) Historical Price Trends
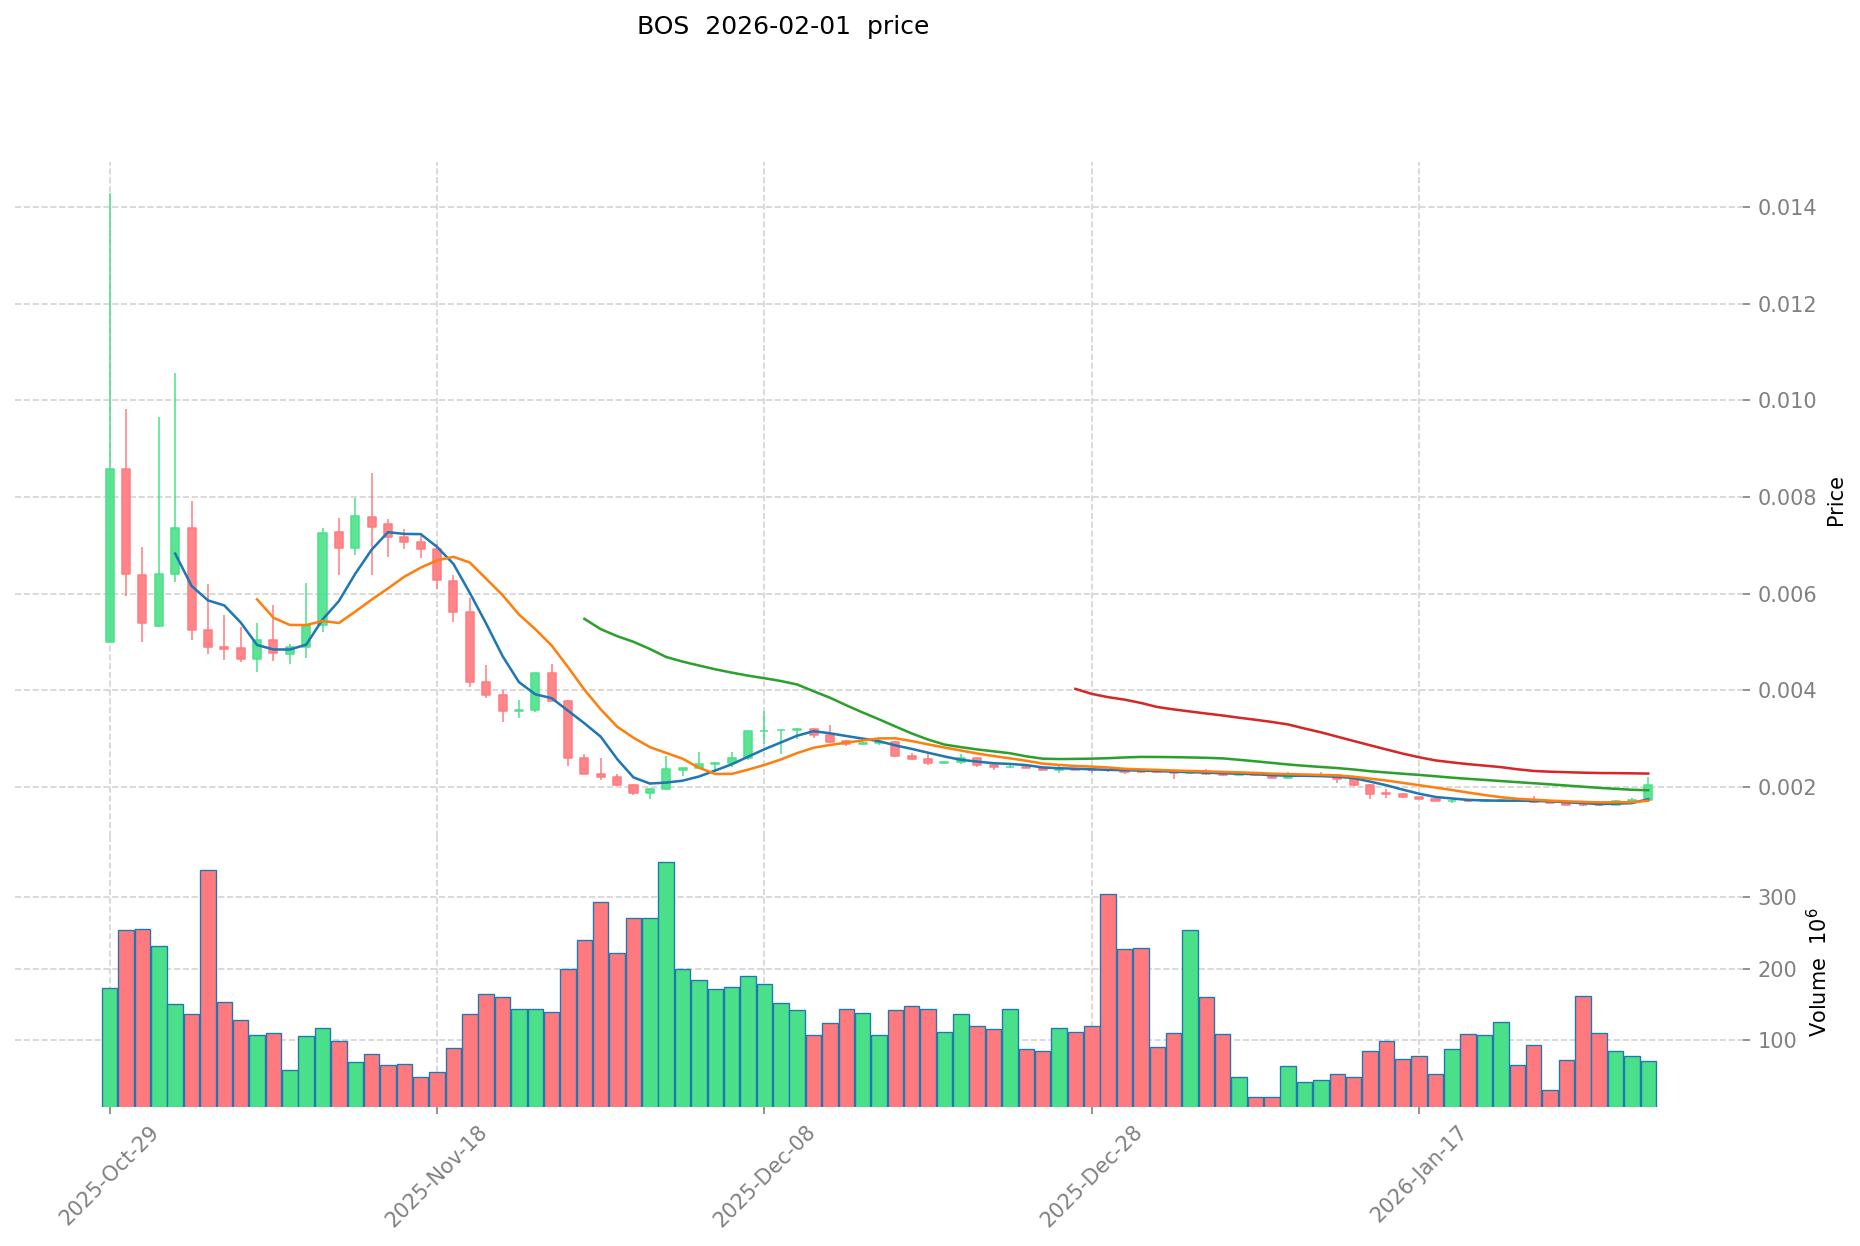
- 2025: BitcoinOS (BOS) reached an all-time high of $0.0143 on October 29, 2025, following its initial launch on Cardano and subsequent subscription of nearly $1 billion in BTC Total Value Locked (TVL).
- 2021: Tezos (XTZ) achieved its all-time high of $9.12 on October 4, 2021, during a period of broader market expansion and increased institutional interest in smart contract platforms.
- 2018: Tezos (XTZ) recorded its all-time low of $0.350476 on December 7, 2018, coinciding with a challenging market cycle affecting numerous blockchain projects.
- 2026: BitcoinOS (BOS) marked its all-time low of $0.001596 on January 28, 2026, reflecting recent market adjustments.
- Comparative Analysis: During the current market cycle, BitcoinOS (BOS) has experienced a decline from its peak of $0.0143 to its current trading level, while Tezos (XTZ) has similarly adjusted from its 2021 high, currently trading at levels substantially below its historical peak.
Current Market Status (February 1, 2026)
- BitcoinOS (BOS) current price: $0.002007
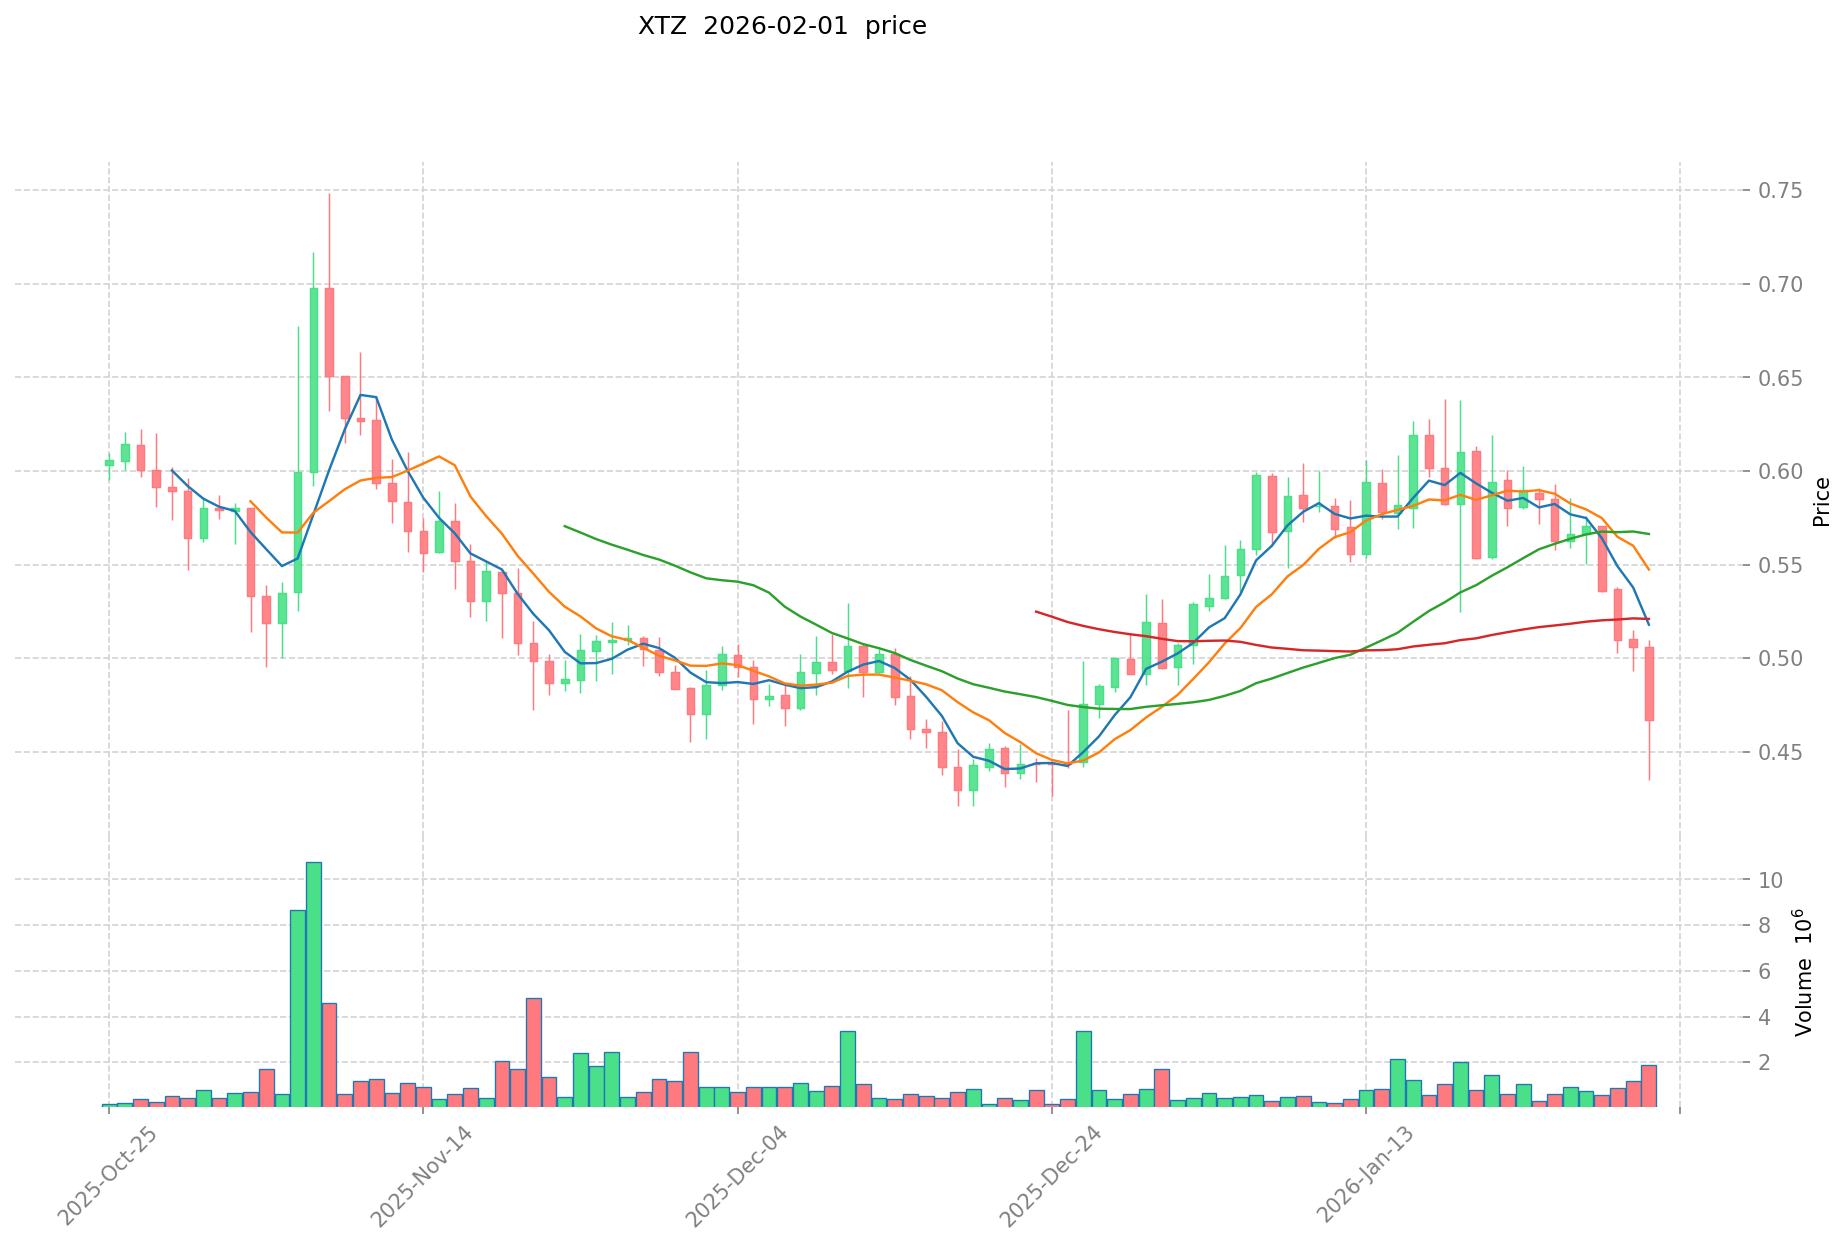
- Tezos (XTZ) current price: $0.4667
- 24-hour trading volume: BOS recorded $81,597.14 compared to XTZ's $823,730.59
- Market Sentiment Index (Fear & Greed Index): 14 (Extreme Fear)
- Price performance over past 24 hours: BOS declined by 1.57%, while XTZ decreased by 3.98%
- Seven-day performance: BOS increased by 19.48%, whereas XTZ decreased by 19.01%
- Market capitalization: BOS holds $1.79M with a fully diluted valuation of $42.15M; XTZ maintains $501.22M with a fully diluted valuation of $510.58M
- Circulating supply ratio: BOS at 4.24% (890.4M tokens of 21B total supply); XTZ at 98.17% (1,074M tokens of 1,094M total supply)
View real-time prices:
II. Core Factors Influencing BOS vs XTZ Investment Value
Tokenomics Comparison
- BOS: Information regarding the supply mechanism is not available in the provided materials.
- XTZ: Information regarding the supply mechanism is not available in the provided materials.
- 📌 Historical Pattern: The relationship between supply mechanisms and price cycle dynamics requires specific tokenomics data for accurate analysis.
Institutional Adoption and Market Application
- Institutional Holdings: The reference materials suggest that investment value depends on technological innovation, market demand, and community support, though specific institutional preference data between BOS and XTZ is not available.
- Enterprise Adoption: Specific applications of BOS and XTZ in cross-border payments, settlements, and investment portfolios are not detailed in the provided materials.
- National Policies: Regulatory attitudes toward these assets across different jurisdictions are not covered in the available references.
Technical Development and Ecosystem Building
- BOS Technical Progress: The materials mention that BOS features robust decentralized applications, though specific technical upgrade details are not provided.
- XTZ Technical Development: Reference materials indicate that XTZ employs Scalable Blockchain technology that attracts investors, though specific development roadmaps are not detailed.
- Ecosystem Comparison: Specific implementation status in DeFi, NFT, payments, and smart contracts for both projects is not available in the provided materials.
Macroeconomic Environment and Market Cycles
- Performance in Inflationary Environments: Comparative anti-inflation properties between BOS and XTZ are not addressed in the available materials.
- Macroeconomic Monetary Policy: The specific impacts of interest rates and dollar index movements on these assets are not detailed in the references.
- Geopolitical Factors: Cross-border transaction demand and international dynamics related to these assets are not covered in the provided materials.
III. 2026-2031 Price Prediction: BOS vs XTZ
Short-term Forecast (2026)
- BOS: Conservative $0.00139 - $0.00201 | Optimistic $0.00201 - $0.00261
- XTZ: Conservative $0.248 - $0.467 | Optimistic $0.467 - $0.640
Mid-term Forecast (2028-2029)
- BOS may enter a gradual appreciation phase, with estimated price range of $0.00151 - $0.00342 in 2028 and $0.00271 - $0.00401 in 2029
- XTZ may enter a consolidation and growth phase, with estimated price range of $0.405 - $0.844 in 2028 and $0.501 - $0.836 in 2029
- Key drivers: institutional capital flows, ETF developments, ecosystem expansion
Long-term Forecast (2030-2031)
- BOS: Baseline scenario $0.00293 - $0.00345 | Optimistic scenario $0.00417 - $0.00622
- XTZ: Baseline scenario $0.557 - $0.798 | Optimistic scenario $0.858 - $0.917
View detailed price predictions for BOS and XTZ
Disclaimer
BOS:
| Year |
Predicted High Price |
Predicted Average Price |
Predicted Low Price |
Price Change |
| 2026 |
0.0026104 |
0.002008 |
0.00138552 |
0 |
| 2027 |
0.002401568 |
0.0023092 |
0.002147556 |
15 |
| 2028 |
0.0034153068 |
0.002355384 |
0.00150744576 |
17 |
| 2029 |
0.004010630106 |
0.0028853454 |
0.002712224676 |
43 |
| 2030 |
0.00489614260926 |
0.003447987753 |
0.00293078959005 |
71 |
| 2031 |
0.006216377119883 |
0.00417206518113 |
0.002837004323168 |
107 |
XTZ:
| Year |
Predicted High Price |
Predicted Average Price |
Predicted Low Price |
Price Change |
| 2026 |
0.639927 |
0.4671 |
0.247563 |
0 |
| 2027 |
0.79705944 |
0.5535135 |
0.39852972 |
18 |
| 2028 |
0.8441080875 |
0.67528647 |
0.405171882 |
44 |
| 2029 |
0.835667006625 |
0.75969727875 |
0.501400203975 |
62 |
| 2030 |
0.917334464090625 |
0.7976821426875 |
0.701960285565 |
71 |
| 2031 |
0.908958801592406 |
0.857508303389062 |
0.55738039720289 |
83 |
IV. Investment Strategy Comparison: BOS vs XTZ
Long-term vs Short-term Investment Strategies
- BOS: May suit investors focused on emerging Bitcoin programmability ecosystems and early-stage technological innovation, with attention to liquidity constraints given its lower trading volume of $81,597.14 in 24 hours
- XTZ: May suit investors seeking exposure to established smart contract platforms with formal verification capabilities and higher liquidity, reflected in its 24-hour trading volume of $823,730.59
Risk Management and Asset Allocation
- Conservative Investors: BOS 10-20% allocation vs XTZ 80-90% allocation, considering XTZ's larger market capitalization of $501.22M and higher circulating supply ratio of 98.17%
- Aggressive Investors: BOS 40-50% allocation vs XTZ 50-60% allocation, balancing BOS's potential appreciation from its lower fully diluted valuation of $42.15M against XTZ's $510.58M
- Hedging Tools: stablecoin reserves, options strategies, cross-asset portfolio diversification
V. Potential Risk Comparison
Market Risks
- BOS: High volatility with recent price fluctuation from all-time high of $0.0143 to all-time low of $0.001596 within a 15-month period; limited liquidity with market cap of $1.79M; extreme circulating supply concentration at 4.24%
- XTZ: Price declined from 2021 peak of $9.12 to current level of $0.4667, representing substantial correction; experienced 19.01% decline over seven days; trading under current market sentiment of Extreme Fear (index: 14)
Technical Risks
- BOS: Scalability considerations for zero-knowledge proof implementation; network stability for newly launched platform since 2024; limited operational track record
- XTZ: Platform maturity challenges since 2017 launch; ongoing ecosystem development requirements; competitive positioning among smart contract platforms
Regulatory Risks
- Both assets face evolving global regulatory frameworks affecting cryptocurrency markets, with potential differential impacts based on their technological architectures and use cases
VI. Conclusion: Which Is the Better Buy?
📌 Investment Value Summary:
- BOS Advantages: Early-stage positioning in Bitcoin programmability sector; lower entry valuation with fully diluted market cap of $42.15M; demonstrated 19.48% seven-day growth recovery; innovative zero-knowledge proof technology application
- XTZ Advantages: Established platform since 2017 with operational track record; larger market capitalization of $501.22M providing relative stability; higher liquidity with 10x greater trading volume; near-complete circulating supply at 98.17% reducing inflation pressure
✅ Investment Recommendations:
- Novice Investors: Consider XTZ for exposure to established smart contract platforms with higher liquidity and market presence; limit initial allocation to 5-10% of total portfolio given current Extreme Fear market sentiment
- Experienced Investors: Evaluate diversified allocation combining XTZ's stability (60-70%) with BOS's growth potential (30-40%); monitor technical development milestones and ecosystem expansion metrics
- Institutional Investors: Assess BOS for strategic positioning in Bitcoin-layer innovation; prioritize XTZ for core smart contract platform exposure; implement risk management through staggered entry positions and hedging instruments
⚠️ Risk Disclosure: Cryptocurrency markets exhibit extreme volatility. This content does not constitute investment advice.
VII. FAQ
Q1: What is the main difference between BOS and XTZ in terms of technology architecture?
BOS focuses on enabling programmability on Bitcoin through zero-knowledge proof technology without modifying Bitcoin's base protocol, while XTZ operates as a self-evolving decentralized blockchain with formal verification capabilities for smart contracts. BOS represents an emerging Bitcoin-layer innovation launched in 2024, whereas XTZ has been operational since 2017 as an established smart contract platform with a self-amendment governance mechanism that allows protocol upgrades without hard forks.
Q2: Which asset offers better liquidity for active trading?
XTZ provides significantly better liquidity with a 24-hour trading volume of $823,730.59 compared to BOS's $81,597.14, representing approximately 10x greater trading activity. Additionally, XTZ maintains a larger market capitalization of $501.22M versus BOS's $1.79M, and has a substantially higher circulating supply ratio of 98.17% compared to BOS's 4.24%, which collectively indicates more established market depth and easier entry/exit positions for traders.
Q3: How do the risk profiles differ between BOS and XTZ investments?
BOS presents higher volatility risk with its price fluctuating from an all-time high of $0.0143 to an all-time low of $0.001596 within 15 months, combined with limited liquidity and extreme supply concentration at 4.24% circulation. XTZ, while experiencing a substantial correction from its 2021 peak of $9.12 to the current $0.4667, offers relatively lower risk through its established operational track record since 2017, larger market capitalization, and near-complete circulating supply that reduces inflation pressure.
Q4: What are the projected price ranges for BOS and XTZ by 2030?
According to baseline forecasts, BOS is projected to reach $0.00293 - $0.00345 by 2030, while optimistic scenarios suggest $0.00417 - $0.00622. For XTZ, baseline projections indicate $0.557 - $0.798 by 2030, with optimistic scenarios ranging from $0.858 - $0.917. These projections depend on factors including institutional capital flows, ETF developments, and ecosystem expansion, though cryptocurrency markets remain highly volatile and unpredictable.
Q5: Which asset is more suitable for conservative investors?
XTZ is generally more appropriate for conservative investors due to its established market presence, higher liquidity, larger market capitalization of $501.22M, and near-complete circulating supply of 98.17% that reduces future dilution concerns. A recommended conservative allocation would be 80-90% XTZ versus 10-20% BOS, though given the current Extreme Fear market sentiment (index: 14), even conservative investors should limit total cryptocurrency exposure to 5-10% of their overall portfolio and implement proper risk management strategies.
Q6: What is the significance of the circulating supply difference between BOS and XTZ?
The circulating supply ratio reveals fundamental differences in token distribution and potential price pressure: BOS has only 4.24% of its total 21 billion tokens in circulation (890.4M tokens), indicating substantial future supply that could create downward price pressure as tokens unlock, while XTZ has 98.17% circulating (1,074M of 1,094M tokens), meaning minimal remaining supply to enter the market. This difference significantly impacts investment risk, with BOS facing potential dilution concerns and XTZ offering more supply predictability for long-term holders.
Q7: How should investors approach portfolio allocation between BOS and XTZ based on risk tolerance?
Conservative investors should consider an 80-90% XTZ allocation versus 10-20% BOS, prioritizing XTZ's established platform stability and higher liquidity. Aggressive investors might pursue a 50-60% XTZ and 40-50% BOS allocation, balancing XTZ's market maturity against BOS's growth potential from its lower fully diluted valuation of $42.15M compared to XTZ's $510.58M. Both strategies should incorporate hedging tools such as stablecoin reserves, options strategies, and cross-asset diversification, while monitoring technical development milestones and ecosystem expansion metrics for both projects.
Q8: What catalysts could drive price appreciation for BOS and XTZ in the coming years?
For BOS, key catalysts include successful implementation of zero-knowledge proof technology on Bitcoin, expansion of Bitcoin programmability use cases, and increased Total Value Locked (TVL) following its initial subscription of nearly $1 billion in BTC. For XTZ, potential drivers encompass institutional adoption of its formal verification capabilities, enterprise integration of its self-amending blockchain technology, and growth in decentralized applications leveraging its smart contract platform. Both assets could benefit from broader cryptocurrency market recovery, favorable regulatory developments, and increased institutional capital flows into the sector.
* The information is not intended to be and does not constitute financial advice or any other recommendation of any sort offered or endorsed by Gate.