CROSS vs LTC: A Comprehensive Comparison of Two Leading Blockchain Solutions in the Cryptocurrency Market
Introduction: CROSS vs LTC Investment Comparison
In the cryptocurrency market, CROSS vs LTC comparison has always been an unavoidable topic for investors. The two not only show significant differences in market cap ranking, application scenarios, and price performance, but also represent different positioning of crypto assets. CROSS (CROSS): Since its launch, it has gained market recognition by positioning itself as a gaming-optimized Layer 1 blockchain with modular infrastructure for on-chain games. LTC (LTC): Since its debut in 2011, it has been recognized for faster transaction confirmation times compared to Bitcoin, with a maximum supply of 84 million coins. This article will comprehensively analyze the investment value comparison between CROSS vs LTC from multiple dimensions including historical price trends, supply mechanisms, exchange listing coverage, and technical ecosystems, attempting to answer the question investors care most about:
"Which is the better buy right now?"
Comparative Analysis Report: CROSS and Litecoin (LTC)
I. Historical Price Comparison and Current Market Status
CROSS and LTC Historical Price Trends
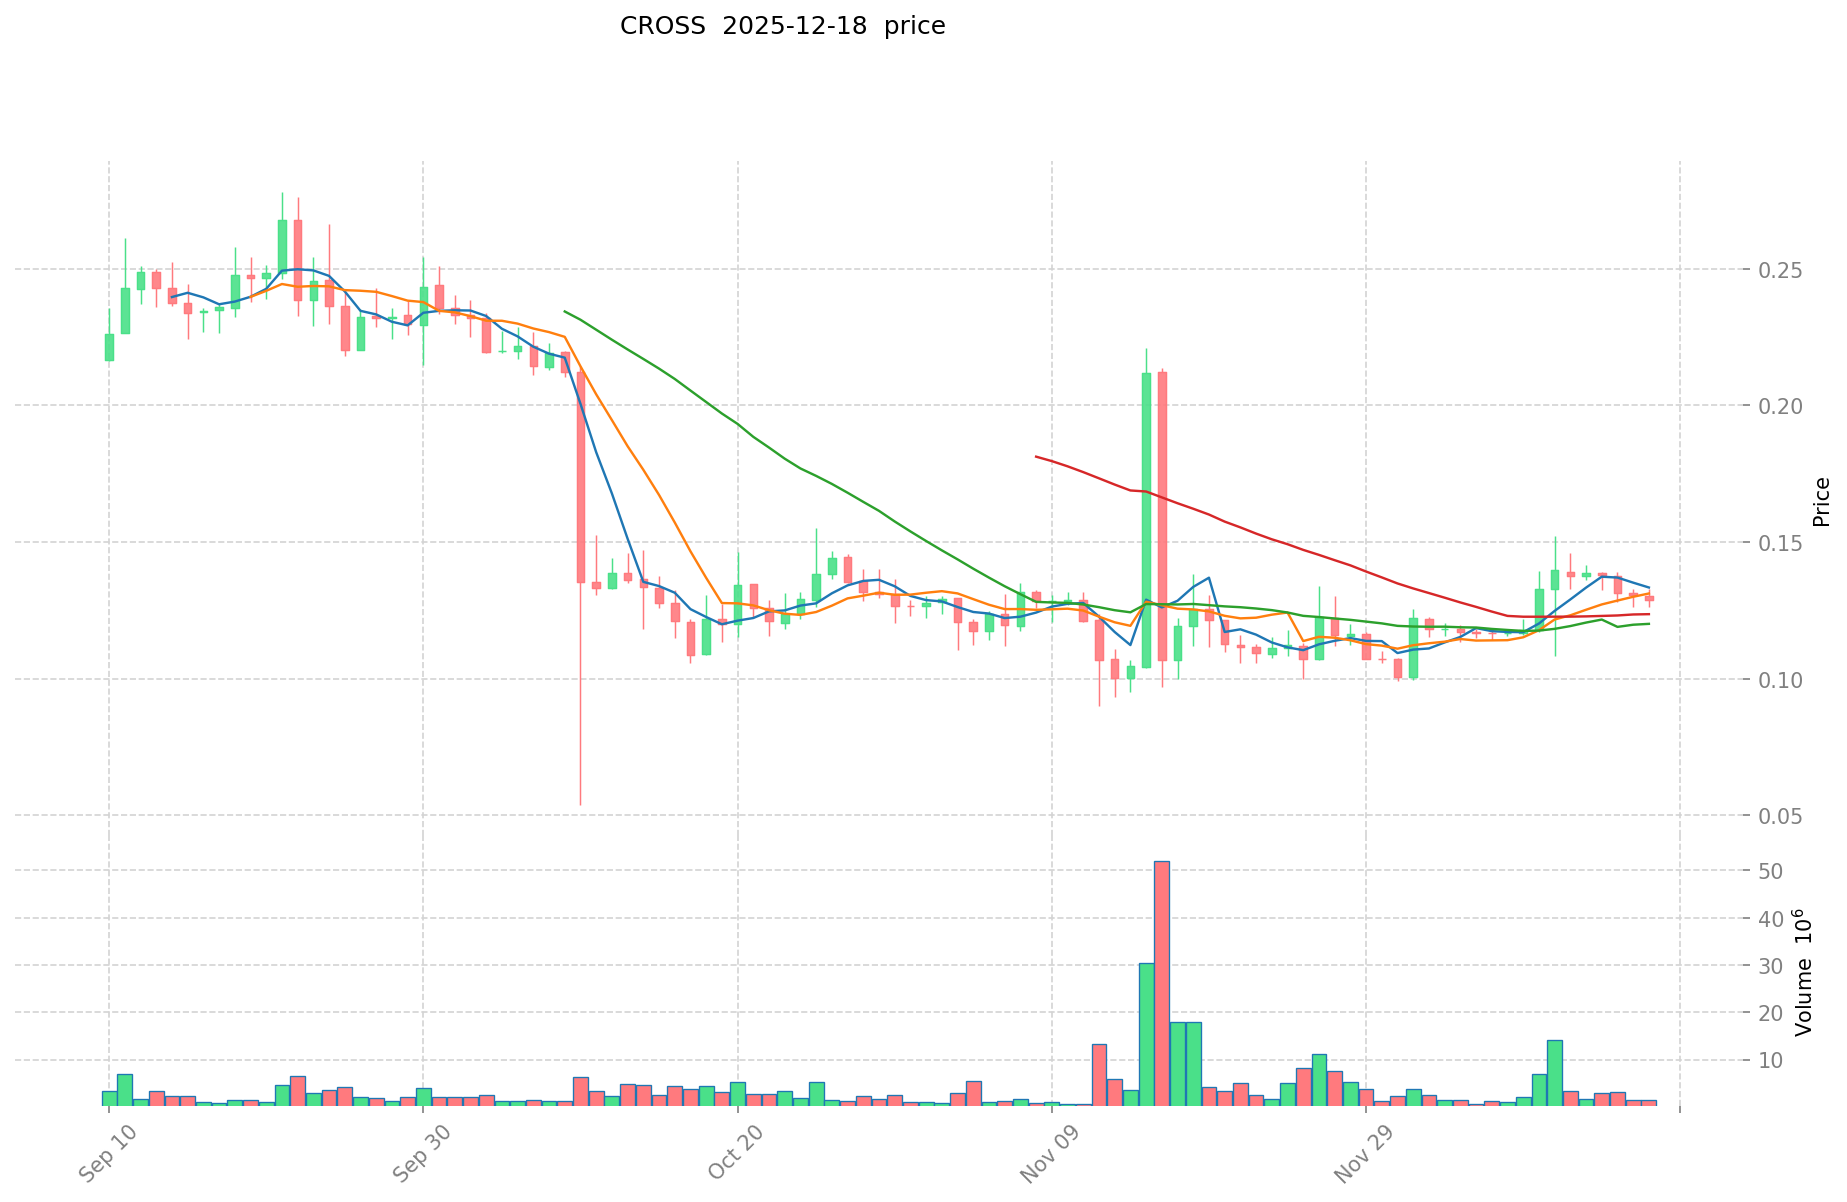
CROSS Performance:
- All-Time High (ATH): $0.448, reached on July 18, 2025
- All-Time Low (ATL): $0.0458, reached on July 4, 2025
- Historical Range: The asset experienced a decline of approximately 89.7% from its peak to trough within a compressed timeframe
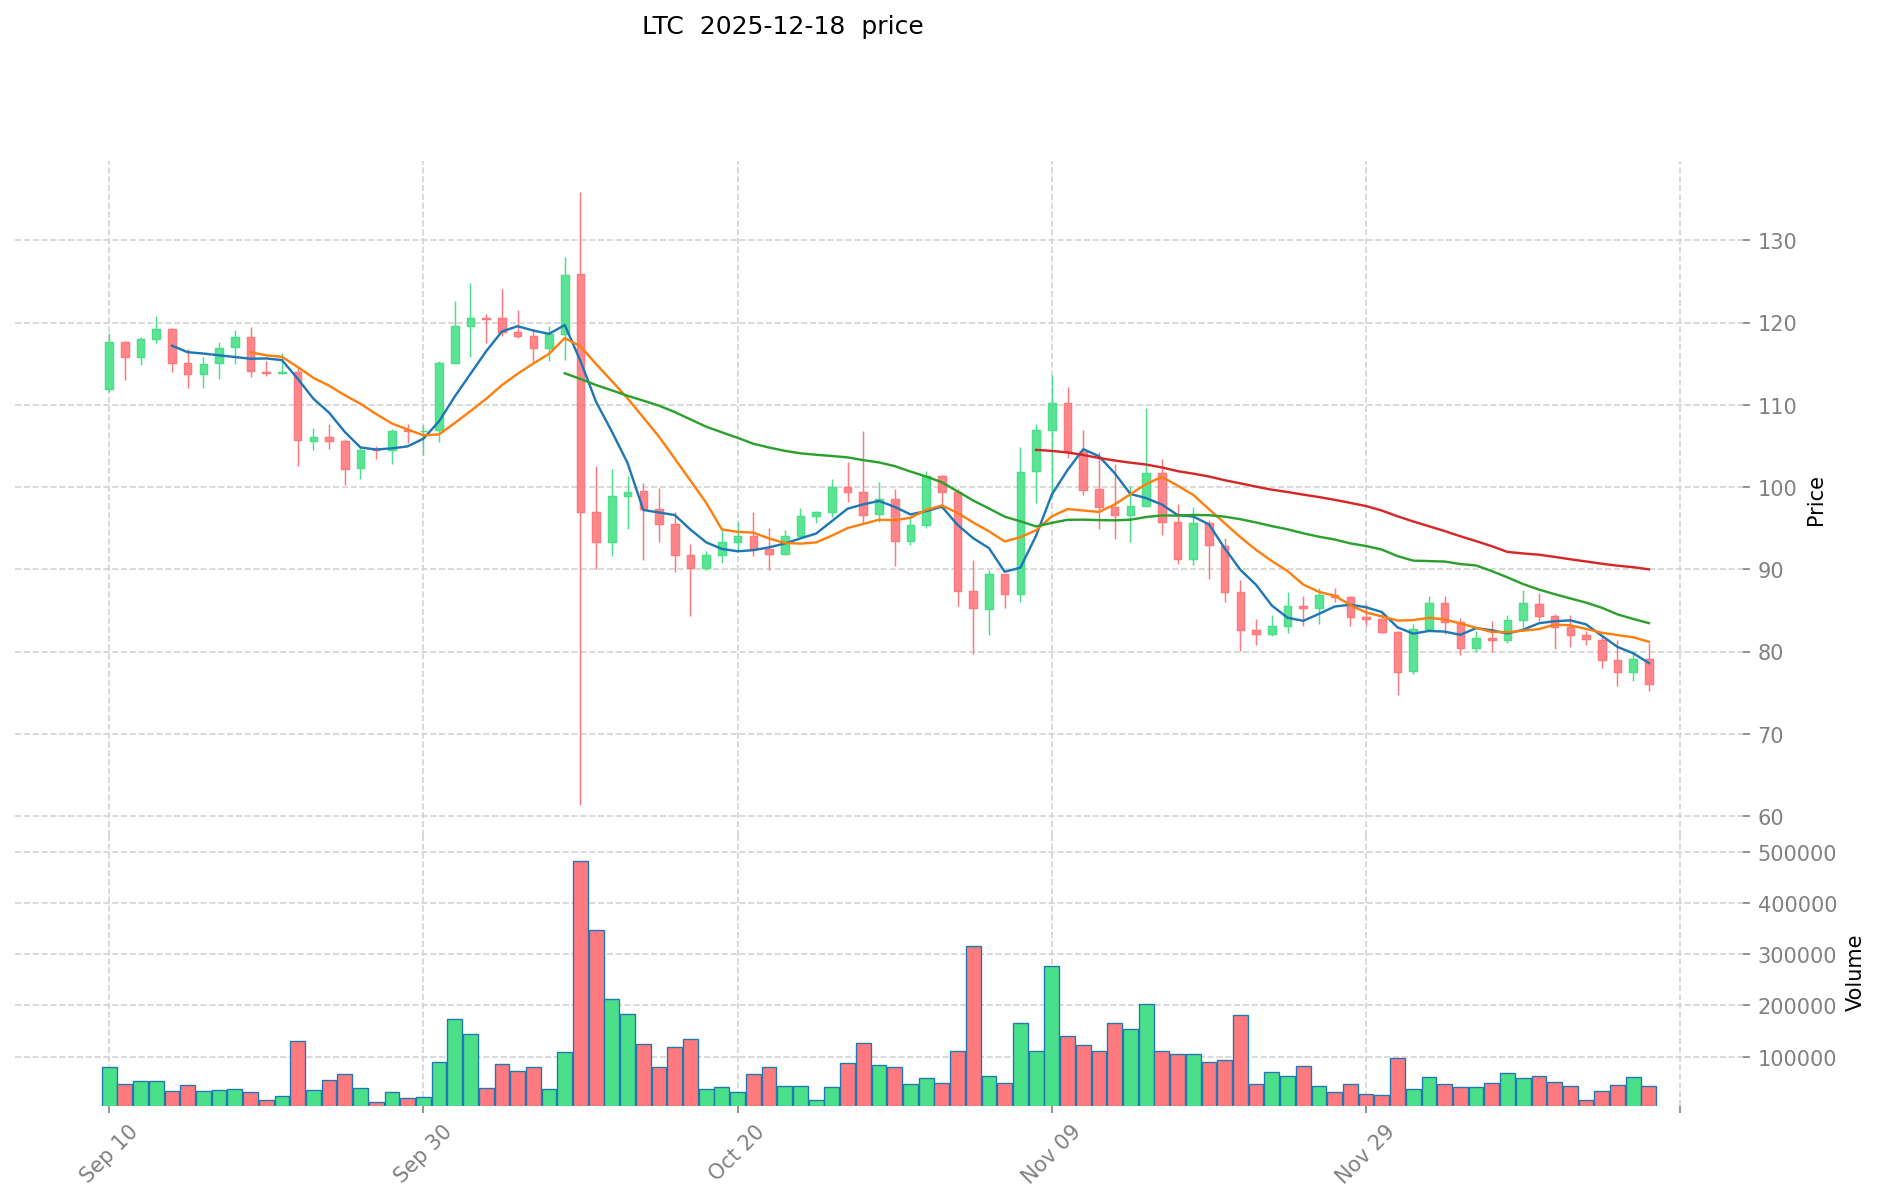
LTC Performance:
- All-Time High (ATH): $410.26, reached on May 10, 2021
- All-Time Low (ATL): $1.15, reached on January 14, 2015
- Historical Range: Litecoin demonstrates a mature market with significant price movements across multiple market cycles since its 2011 inception
Comparative Analysis: CROSS exhibits characteristics typical of newly launched assets with rapid price volatility and significant drawdowns. In contrast, LTC reflects the stability of an established Layer 1 blockchain that has weathered multiple market cycles over 14 years of operation.
Current Market Status (December 19, 2025)
CROSS Metrics:
- Current Price: $0.12003
- 24-Hour Change: -6.23%
- 24-Hour Trading Volume: $318,216.67
- Market Capitalization: $42,010,500
- Fully Diluted Valuation (FDV): $118,256,303.49
- Market Ranking: #558
- Circulating Supply: 350,000,000 / Total Supply: 985,222,890
- Max Supply: 1,000,000,000
LTC Metrics:
- Current Price: $77.45
- 24-Hour Change: +0.29%
- 24-Hour Trading Volume: $3,330,979.47
- Market Capitalization: $5,935,748,307.06
- Fully Diluted Valuation (FDV): $5,935,767,669.56
- Market Ranking: #27
- Circulating Supply: 76,639,745.73 / Total Supply: 76,639,995.73
- Max Supply: 84,000,000
Market Sentiment Index (Fear & Greed Index):
- Current Reading: 17 (Extreme Fear)
- Status: Market sentiment indicates heightened risk aversion among participants
View Real-Time Prices:
II. Price Momentum Analysis
Short-Term Price Movements (Multi-Timeframe)
CROSS Price Trends:
| Time Period | Change Percentage | Change Amount |
|---|---|---|
| 1 Hour | +0.61% | +$0.0007 |
| 24 Hours | -6.23% | -$0.0080 |
| 7 Days | -6.88% | -$0.0089 |
| 30 Days | -6.02% | -$0.0077 |
| 1 Year | +32.64% | +$0.0295 |
LTC Price Trends:
| Time Period | Change Percentage | Change Amount |
|---|---|---|
| 1 Hour | -0.64% | -$0.4989 |
| 24 Hours | +0.29% | +$0.2240 |
| 7 Days | -5.09% | -$4.1536 |
| 30 Days | -20.16% | -$19.5565 |
| 1 Year | -38.5% | -$48.4850 |
Key Observations:
- CROSS demonstrates positive performance over a one-year horizon (+32.64%), contrasting sharply with recent weakness
- LTC shows negative annual returns (-38.5%), indicating sustained pressure despite recent price stability
- Both assets exhibit bearish momentum across 7-day and 30-day timeframes
- CROSS 24-hour price action shows downward pressure; LTC maintains marginal gains
III. Project Fundamentals
CROSS Ecosystem Overview
Project Description: CROSS is a gaming-optimized Layer 1 blockchain with full EVM (Ethereum Virtual Machine) compatibility. The protocol provides modular infrastructure specifically designed for on-chain gaming applications.
Core Infrastructure Components:
- Software Development Kits (SDKs)
- Decentralized Exchange (DEX)
- Cross-chain Bridge Functionality
- Integrated Wallet Solutions
Token Economics:
- Ticker: CROSS
- Blockchain: BEP-20 (Binance Smart Chain deployed)
- Token Utility: Gas fees, governance, and staking
- Supply Structure: Fixed supply with no future token minting
- Current Holders: 36,065
Network Status:
- Mainnet: Live
- wallet Infrastructure: Operational
- Active Game Onboarding: In progress
- Listed Exchanges: 19
Litecoin Fundamentals
Project Description: Litecoin is a peer-to-peer cryptocurrency created in 2011 as a fork of the Bitcoin blockchain. It was developed by Charlie Lee, a former Google software engineer, with the objective of providing an alternative digital currency focused on payment functionality.
Technical Specifications:
- Consensus Mechanism: Proof of Work
- Mining Algorithm: Scrypt
- Block Time: 2.5 minutes (versus Bitcoin's 10 minutes)
- Halving Schedule: Occurs every four years (similar to Bitcoin)
- Historical Halving: August 2023 (most recent)
Network Characteristics:
- Established: 2011 (14 years operational history)
- Developer Community: Open-source with active GitHub repository
- Exchange Listings: 79 major exchanges
- Active Holders: 8,603,784
IV. Market Dynamics and Comparative Metrics
Market Dominance and Scale
CROSS Market Position:
- Market Dominance: 0.0037%
- Market Cap to FDV Ratio: 35.52%
- Status: Nascent asset with concentrated price discovery phase
LTC Market Position:
- Market Dominance: 0.18%
- Market Cap to FDV Ratio: 91.24%
- Status: Mature asset with fully-realized market capitalization near maximum supply circulation
Liquidity Assessment
CROSS Liquidity:
- 24-Hour Volume: $318,216.67
- Volume to Market Cap Ratio: 0.76% (relatively low liquidity depth)
- Exchange Coverage: Limited to 19 platforms
LTC Liquidity:
- 24-Hour Volume: $3,330,979.47
- Volume to Market Cap Ratio: 0.06% (deeper liquidity infrastructure)
- Exchange Coverage: 79 major platforms
- Institutional Access: Higher via traditional exchange networks
V. Risk Assessment and Key Considerations
CROSS Risk Factors
- Early-Stage Volatility: Significant price swings (89.7% decline from ATH) within short timeframe indicate nascent market risk
- Supply Inflation: 35.52% circulating ratio to fully diluted valuation suggests potential future dilution pressure as supply enters circulation
- Limited Liquidity: Lower trading volumes relative to market cap may amplify price movements
- Execution Risk: Game onboarding success is critical to long-term adoption and value accrual
LTC Risk Factors
- Performance Lag: Negative one-year returns (-38.5%) and 30-day decline (-20.16%) indicate relative underperformance versus broader market
- Technology Stagnation: Limited recent ecosystem upgrades or significant development announcements
- Adoption Limitations: Payment-focused utility dependent on merchant acceptance and consumer adoption
- Regulatory Exposure: Proof-of-Work mining subject to evolving regulatory frameworks globally
VI. Conclusion
CROSS and LTC represent fundamentally different asset categories within the cryptocurrency ecosystem. CROSS functions as an early-stage application-layer blockchain targeting the Web3 gaming vertical, while LTC operates as an established payment-focused cryptocurrency with a 14-year operational history.
Key Distinctions:
- CROSS offers growth potential through ecosystem development but carries elevated early-stage risks
- LTC provides regulatory clarity and institutional accessibility, offset by limited recent innovation and negative annual performance
- Market sentiment remains cautious (Extreme Fear), suggesting heightened risk awareness across both assets
- Liquidity and trading volume favor LTC substantially, reducing execution risks for institutional participants
Both assets warrant continued monitoring within broader cryptocurrency market conditions and individual risk tolerance frameworks.
Data as of: December 19, 2025, 01:08:27 UTC
Investment Value Analysis Report: CROSS vs LTC
I. Executive Summary
Based on available research materials, this report examines the core investment factors influencing CROSS and Litecoin (LTC). The analysis reveals distinct use cases and market positioning for each asset, with LTC established as a legacy payment-focused cryptocurrency and CROSS emerging as a Web3 gaming protocol token.
II. Core Factors Affecting CROSS vs LTC Investment Value
Tokenomics and Supply Mechanisms
LTC (Litecoin):
- Fixed maximum supply of 84 million coins (approximately 4x Bitcoin's supply)
- Halving mechanism occurring approximately every 4 years, which reduces block rewards and mining incentives
- Established since October 2011, with predictable long-term supply dynamics
CROSS:
- Core utility token within a Web3 gaming protocol platform
- Supply mechanism not specified in available materials
- Token functions include payment for network transaction fees, participation in game interactions, and smart contract deployment by developers
📌 Historical Patterns: LTC's halving events have historically coincided with market volatility and price discovery phases. Key validation signals identified for LTC include maintaining support at $100 and potential ETF approvals.
Institutional Adoption and Market Applications
Institution Holdings:
- LTC demonstrates established institutional familiarity through futures trading infrastructure on platforms including Kraken Pro and CME-listed derivatives
- CROSS adoption levels among institutions remain unspecified in available materials
Enterprise Adoption:
- LTC: Positioned as a global decentralized digital currency based on blockchain technology; historically considered for cross-border payments and store-of-value applications, though unsuitable for investors prioritizing asset preservation due to high volatility
- CROSS: Designed specifically for Web3 gaming ecosystems, enabling game asset ownership redefinition; player benefits include airdrops, whitelist access, and NFT lottery participation
Regulatory Considerations:
- LTC: Subject to regional futures trading regulations with varying collateral requirements (CME-listed contracts in US markets with USD-only collateral; multi-asset collateral permitted in EU and most regions)
- CROSS: No specific regulatory framework details provided in materials
Technical Development and Ecosystem Construction
LTC Ecosystem:
- Established payment infrastructure with futures trading capabilities
- Key metrics for ecosystem assessment include on-chain activity levels and adoption rates
- Potential ETF approval identified as significant catalyst for long-cycle trend validation
CROSS Ecosystem:
- Web3 protocol specifically focused on gaming asset ownership
- Integrated incentive mechanisms through exclusive holder benefits
- Specialized in NFT and gaming interaction scenarios
Comparative Analysis: Materials provided do not contain sufficient information regarding specific DeFi, smart contract deployment, or broader payment infrastructure developments for direct comparison.
Macroeconomic Environment and Market Cycles
Inflation Resistance Characteristics:
- LTC characterized by high volatility and uncertain future outlook, making it unsuitable as a value-preservation asset in inflationary environments
- Asset diversification recommended with primary allocation to assets possessing clear store-of-value functionality (such as Bitcoin)
- CROSS inflation-resistance properties not addressed in available materials
Monetary Policy Impact:
- LTC futures settlements quoted in USD; price leverage based on collateral USD value
- Materials do not provide specific analysis of interest rate or US Dollar Index effects on either asset
Geopolitical Factors:
- Cross-border transaction demand considerations not detailed in provided materials
III. Risk Considerations
LTC-Specific Risks:
- High price volatility unsuitable for capital preservation objectives
- Dependency on validation signals (support level maintenance, regulatory approvals, on-chain activity) for long-term trend sustainability
General Market Risks:
- Leverage trading mechanisms amplify both potential gains and losses in derivatives markets
- Regulatory framework evolution remains subject to jurisdictional changes
IV. Data Limitations
This analysis is constrained by incomplete information regarding: CROSS tokenomics and supply mechanisms, specific institutional adoption metrics for both assets, comparative regulatory treatment across jurisdictions, and detailed macroeconomic correlation analysis. Readers should supplement this report with additional primary source research before making investment decisions.
III. 2025-2030 Price Forecast: CROSS vs LTC
Short-term Forecast (2025)
- CROSS: Conservative $0.0852 - $0.1200 | Optimistic $0.1380
- LTC: Conservative $71.80 - $75.58 | Optimistic $92.96
Mid-term Forecast (2026-2028)
- CROSS may enter accumulation phase, with projected price range of $0.1161 - $0.2508
- LTC may enter early appreciation phase, with projected price range of $48.03 - $119.28
- Key drivers: Institutional capital inflows, ETF approvals, ecosystem development initiatives
Long-term Forecast (2029-2030)
- CROSS: Base case $0.1817 - $0.2162 | Optimistic scenario $0.2379 - $0.3179
- LTC: Base case $92.46 - $115.93 | Optimistic scenario $125.99 - $172.73
Disclaimer
The above price forecasts are based on historical data analysis and market modeling. Cryptocurrency markets are highly volatile and subject to regulatory changes, macroeconomic factors, and technological developments. These projections should not be considered investment advice. Past performance does not guarantee future results. Investors should conduct their own research and consult with financial advisors before making investment decisions.
CROSS:
| 年份 | 预测最高价 | 预测平均价格 | 预测最低价 | 涨跌幅 |
|---|---|---|---|---|
| 2025 | 0.137954 | 0.11996 | 0.0851716 | 0 |
| 2026 | 0.18440851 | 0.128957 | 0.1160613 | 7 |
| 2027 | 0.2068212366 | 0.156682755 | 0.1441481346 | 30 |
| 2028 | 0.250817754204 | 0.1817519958 | 0.114503757354 | 51 |
| 2029 | 0.2379133625022 | 0.216284875002 | 0.20330778250188 | 80 |
| 2030 | 0.31793876625294 | 0.2270991187521 | 0.190763259751764 | 89 |
LTC:
| 年份 | 预测最高价 | 预测平均价格 | 预测最低价 | 涨跌幅 |
|---|---|---|---|---|
| 2025 | 92.9634 | 75.58 | 71.801 | -2 |
| 2026 | 91.013436 | 84.2717 | 48.034869 | 8 |
| 2027 | 97.28325048 | 87.642568 | 79.75473688 | 13 |
| 2028 | 119.2771529196 | 92.46290924 | 48.0807128048 | 19 |
| 2029 | 125.985336984962 | 105.8700310798 | 74.10902175586 | 36 |
| 2030 | 172.73224920824769 | 115.927684032381 | 100.85708510817147 | 49 |
Comparative Investment Strategy Report: CROSS vs LTC
IV. Investment Strategy Comparison: CROSS vs LTC
Long-term vs Short-term Investment Strategies
CROSS:
- Suitable for investors focusing on emerging Web3 gaming ecosystems and application-layer blockchain development
- Short-term: High-risk trading environment requiring active management due to 89.7% ATH-to-ATL volatility
- Long-term: Positioned for growth through game onboarding success and ecosystem expansion, with projected price appreciation trajectory (2025-2030 forecast range: $0.0852–$0.3179)
LTC:
- Suitable for investors seeking established payment infrastructure and regulatory clarity within cryptocurrency markets
- Short-term: Defensive positioning amid negative annual returns (-38.5%) and 30-day weakness (-20.16%)
- Long-term: Stable value proposition dependent on halving cycles and potential ETF approvals, with projected appreciation (2025-2030 forecast range: $71.80–$172.73)
Risk Management and Asset Allocation
Conservative Investors:
- CROSS: 5–10% allocation (early-stage diversification)
- LTC: 15–25% allocation (established cryptocurrency foundation)
- Stablecoin allocation: 60–75% (capital preservation in extreme fear market conditions)
Aggressive Investors:
- CROSS: 25–35% allocation (high-growth targeting)
- LTC: 10–15% allocation (volatility hedge within crypto exposure)
- Leverage/derivatives: Restricted to 5–10% via CME futures for LTC; not recommended for CROSS given liquidity constraints
Hedging Instruments:
- Stablecoin configuration: USD-pegged assets for dry powder deployment during market dislocations
- Options strategies: LTC futures options available via CME for downside protection
- Cross-asset diversification: Bitcoin allocation to reduce correlation risk within payment-focused cryptocurrency segment
V. Potential Risk Comparison
Market Risk
CROSS:
- Early-stage volatility with 89.7% drawdown from ATH within compressed timeframe indicates significant downside exposure
- Low trading volume ($318,216.67 daily) relative to market cap creates execution risk for substantial position sizing
- Limited exchange coverage (19 platforms) may restrict liquidity access during market stress events
LTC:
- Sustained negative annual performance (-38.5%) suggests potential trend deterioration and trend-following liquidations
- 30-day weakness (-20.16%) indicates recent momentum breakdown despite 14-year operational history
- Institutional accessibility paradoxically increases selling pressure during risk-off market conditions due to automatic rebalancing algorithms
Technical Risk
CROSS:
- Nascent blockchain infrastructure requires validation of mainnet stability and smart contract security audits
- Gaming ecosystem dependency creates single-use-case concentration risk
- Network upgrade execution risks remain unspecified in available materials
LTC:
- Established Scrypt mining algorithm demonstrates proven security track record over 14 years
- Mining concentration risk subject to evolution; operational since 2011 with 8,603,784 active holders indicating distributed participation
- Limited recent innovation relative to competing Layer 1 platforms may indicate technical stagnation
Regulatory Risk
Global Regulatory Environment:
- LTC: Established regulatory recognition through CME futures listings (USD-only collateral in US markets; multi-asset collateral permitted in EU jurisdictions); Payment-focused cryptocurrency classification provides clarity but exposes to evolving anti-money-laundering frameworks
- CROSS: Web3 gaming protocol positioning creates regulatory ambiguity regarding NFT classification, gaming asset ownership, and securities regulation applicability across jurisdictions
- Both assets subject to potential jurisdiction-specific restrictions on cryptocurrency trading, mining activity, and institutional custody arrangements
VI. Conclusion: Which Is the Better Buy?
📌 Investment Value Summary
CROSS Advantages:
- Application-layer blockchain targeting high-growth Web3 gaming vertical with exclusive holder incentive mechanisms (airdrops, whitelist access, NFT lottery participation)
- Early-stage positioning offers asymmetric upside potential through ecosystem development, particularly if game onboarding gains market traction
- Fixed token supply structure provides theoretical scarcity narrative absent inflationary pressure from future minting
LTC Advantages:
- Fourteen-year operational history with established institutional infrastructure via CME futures, Kraken Pro, and 79 major exchange listings
- Predictable halving schedule (4-year cycle) provides transparent long-term supply dynamics versus nascent projects with uncertain tokenomics
- Regulatory clarity through payment-focused cryptocurrency classification reduces execution risk for institutional capital deployment
- Proven Proof-of-Work consensus mechanism with distributed mining network across 8.6+ million active holders
✅ Investment Recommendations
Beginner Investors:
- Prioritize LTC allocation due to regulatory clarity, institutional accessibility, and 14-year proven track record
- Limit CROSS exposure to small speculative positions (5–10% of crypto allocation) only after fundamental research into game partnerships and mainnet stability
- Maintain 60–75% stablecoin reserve given current market sentiment (Extreme Fear Index: 17) for opportunistic deployment during broader market dislocations
Experienced Investors:
- Consider tactical CROSS accumulation during oversold conditions (current drawdown: 73.2% from ATH presents mean-reversion opportunity if game ecosystem validates)
- Deploy LTC as defensive hedge within Web3 cryptocurrency exposure; monitor halving cycle dynamics and ETF approval catalyst for long-term positioning
- Utilize LTC CME futures for leverage-based strategies; avoid derivatives for CROSS pending improved liquidity infrastructure
Institutional Investors:
- LTC suitable for large-scale allocation through established custody infrastructure, futures markets, and regulatory compliance frameworks
- CROSS restricted to emerging-market-focused portfolios with explicit high-risk tolerance and game ecosystem validation mandates
- Recommend position-sizing constraints: LTC maximum 2–3% portfolio weight; CROSS maximum 0.5–1% given liquidity depth limitations
⚠️ Risk Disclaimer: Cryptocurrency markets exhibit extreme volatility and remain subject to regulatory framework changes, macroeconomic cycles, and technological disruptions. Neither CROSS nor LTC price forecasts constitute investment advice. Historical performance does not guarantee future results. All investors should conduct independent due diligence and consult qualified financial advisors before deploying capital.
Data as of: December 19, 2025 None
Frequently Asked Questions: CROSS vs LTC Investment Comparison
I. FAQ
Q1: What are the key differences between CROSS and LTC in terms of project positioning?
A: CROSS is a gaming-optimized Layer 1 blockchain with modular infrastructure designed specifically for on-chain gaming applications, launched recently with a focus on Web3 gaming ecosystems. In contrast, LTC (Litecoin) is an established payment-focused cryptocurrency created in 2011, designed as a faster alternative to Bitcoin with 2.5-minute block times. CROSS targets application-layer adoption through game onboarding, while LTC operates as a peer-to-peer digital currency focusing on payment utility and store-of-value characteristics.
Q2: How do the price volatility profiles of CROSS and LTC compare?
A: CROSS demonstrates significantly higher volatility typical of early-stage assets, with a 89.7% decline from its all-time high ($0.448 on July 18, 2025) to its all-time low ($0.0458 on July 4, 2025) within a compressed timeframe. LTC exhibits more moderate volatility reflecting its 14-year operational maturity, with an all-time high of $410.26 (May 10, 2021) and all-time low of $1.15 (January 14, 2015) across multiple market cycles. Current performance shows CROSS with -6.23% 24-hour change and LTC with +0.29%, indicating CROSS carries substantially higher short-term price risk.
Q3: Which asset offers better liquidity for trading purposes?
A: LTC provides superior liquidity infrastructure with a 24-hour trading volume of $3,330,979.47 across 79 major exchange listings and established institutional infrastructure via CME futures and Kraken Pro. CROSS exhibits relatively constrained liquidity with 24-hour volume of only $318,216.67 across 19 exchange platforms, resulting in a volume-to-market-cap ratio of 0.76% compared to LTC's 0.06%. For institutional investors requiring large position execution, LTC remains the substantially more practical choice due to deeper order book depth and broader exchange coverage.
Q4: What are the supply mechanisms and potential inflation risks for each asset?
A: LTC maintains a fixed maximum supply of 84 million coins with a predictable halving mechanism occurring approximately every four years, creating transparent long-term supply dynamics established since 2011. The most recent halving occurred in August 2023. CROSS operates with a maximum supply of 1,000,000,000 tokens, with current circulating supply representing only 35.52% of fully diluted valuation, indicating substantial future dilution potential as additional tokens enter circulation. This supply structure exposes CROSS investors to greater inflation risk compared to LTC's established scarcity framework.
Q5: Which asset is more suitable for conservative investors in the current market environment?
A: LTC represents the more conservative choice given the current market sentiment (Fear & Greed Index: 17, indicating Extreme Fear). LTC's 14-year operational history, institutional accessibility through CME futures and major exchanges, regulatory clarity as a payment-focused cryptocurrency, and proven Proof-of-Work consensus mechanism provide substantially lower execution risk. CROSS is better suited for aggressive investors with explicit high-risk tolerance seeking growth exposure to Web3 gaming ecosystems. Conservative allocation recommendations suggest 60-75% stablecoin positioning, 15-25% LTC allocation, and 5-10% CROSS speculative exposure during current market conditions.
Q6: What are the critical success factors for each asset's long-term appreciation potential?
A: CROSS success depends primarily on: game onboarding acceleration and developer ecosystem growth, successful smart contract deployment and security validation, and market adoption of exclusive holder incentives (airdrops, whitelist access, NFT lottery participation). Long-term price forecasts project CROSS reaching $0.3179 by 2030 under optimistic scenarios. LTC appreciation prospects center on: institutional capital inflows through potential ETF approvals, sustaining price support at $100 levels, halving cycle dynamics (next halving approximately 2027), and on-chain activity validation. LTC projections suggest $172.73 maximum price target by 2030 under optimistic scenarios.
Q7: How do regulatory frameworks currently treat CROSS versus LTC differently?
A: LTC benefits from established regulatory recognition through CME futures listings with USD-only collateral requirements in US markets and multi-asset collateral permissions in EU jurisdictions. LTC's payment-cryptocurrency classification provides regulatory clarity but creates exposure to evolving anti-money-laundering compliance frameworks. CROSS operates within regulatory ambiguity as a Web3 gaming protocol token, with uncertain classification regarding NFT assets, gaming-asset ownership structures, and potential securities regulation applicability across different jurisdictions. This regulatory uncertainty creates elevated compliance risk for CROSS but potentially greater upside if classification frameworks become favorable to gaming protocols.
Q8: What investment strategies are recommended for different risk tolerance profiles?
A: Conservative investors should allocate 60-75% to stablecoins for capital preservation during extreme fear conditions, 15-25% to LTC as established cryptocurrency foundation, and 5-10% maximum CROSS exposure. Aggressive investors may increase CROSS allocation to 25-35% for high-growth targeting while reducing LTC to 10-15% as a volatility hedge. Experienced investors should consider tactical CROSS accumulation during oversold conditions (current 73.2% drawdown presents potential mean-reversion opportunity) while deploying LTC CME futures for leverage-based strategies. Institutional investors should restrict LTC to maximum 2-3% portfolio weight and CROSS to 0.5-1% given liquidity constraints, reserving CROSS exclusively for high-risk-tolerance emerging-market portfolios with validated game ecosystem partnerships.
Share
Content
Introduction: CROSS vs LTC Investment Comparison
I. Historical Price Comparison and Current Market Status
II. Price Momentum Analysis
III. Project Fundamentals
IV. Market Dynamics and Comparative Metrics
V. Risk Assessment and Key Considerations
VI. Conclusion
I. Executive Summary
II. Core Factors Affecting CROSS vs LTC Investment Value
III. Risk Considerations
IV. Data Limitations
III. 2025-2030 Price Forecast: CROSS vs LTC
IV. Investment Strategy Comparison: CROSS vs LTC
V. Potential Risk Comparison
VI. Conclusion: Which Is the Better Buy?
I. FAQ
How to Buy Cryptocurrency


Trending Cryptocurrencies


Is Vanar (VANRY) a good investment?: A Comprehensive Analysis of Risk and Potential Returns

UOS vs ICP: A Comparative Analysis of Operating Systems for Enterprise Security and Compliance

PIXEL vs ZIL: The Battle of Emerging Digital Asset Protocols

Is Gunz (GUN) a good investment?: Analyzing Market Potential and Risk Factors for Crypto Investors
2025 GUNPrice Prediction: Market Analysis and Investment Outlook for Firearms Industry
2025 UOS Price Prediction: Analyzing Growth Potential and Market Dynamics in the Evolving Blockchain Ecosystem
Unlocking Trustless External Data with Blockchain Oracles
2025 FLIP Price Prediction: Expert Analysis and Market Forecast for the Upcoming Year

2025 ERA Price Prediction: Expert Analysis and Market Forecasts for the Coming Year

2025 TNSR Price Prediction: Expert Analysis and Market Forecast for Tensar International Holdings

2025 PHA Price Prediction: Expert Analysis and Future Outlook for Phala Network Token