FRAX vs MANA: A Comprehensive Comparison of Two Leading Crypto Tokens in the DeFi and Metaverse Ecosystems


Introduction: FRAX vs MANA Investment Comparison
In the cryptocurrency market, comparing FRAX vs MANA has become an inevitable topic for investors. The two assets demonstrate distinct differences in market capitalization ranking, application scenarios, and price performance, representing different positioning within the crypto asset landscape.
FRAX (FRAX): As the native gas token of Fraxtal, a modular Layer 2 rollup blockchain, FRAX powers an ecosystem designed with blockspace incentives (Flox) that reward users and developers for network participation. The platform leverages EVM equivalence and the OP Stack to deliver comparable speed, security, and cost efficiency to leading Ethereum rollups.
MANA (MANA): Launched as the governance and utility token of Decentraland, a blockchain-based virtual world platform, MANA enables users to permanently own virtual property rights and content creators to capture value without intermediary fees. The project addresses the traditional platform economics problem by implementing decentralized, open-source infrastructure.
This article will conduct a comprehensive analysis of FRAX vs MANA across historical price performance, supply mechanisms, market adoption, technical ecosystems, and future outlook to examine the comparative investment value proposition and address the key question investors face:
"Which is the better buy right now?"
Comparative Analysis of Frax (FRAX) and Decentraland (MANA): Market Performance and Technical Overview
I. Historical Price Comparison and Current Market Status
Historical Price Trajectories of FRAX and MANA
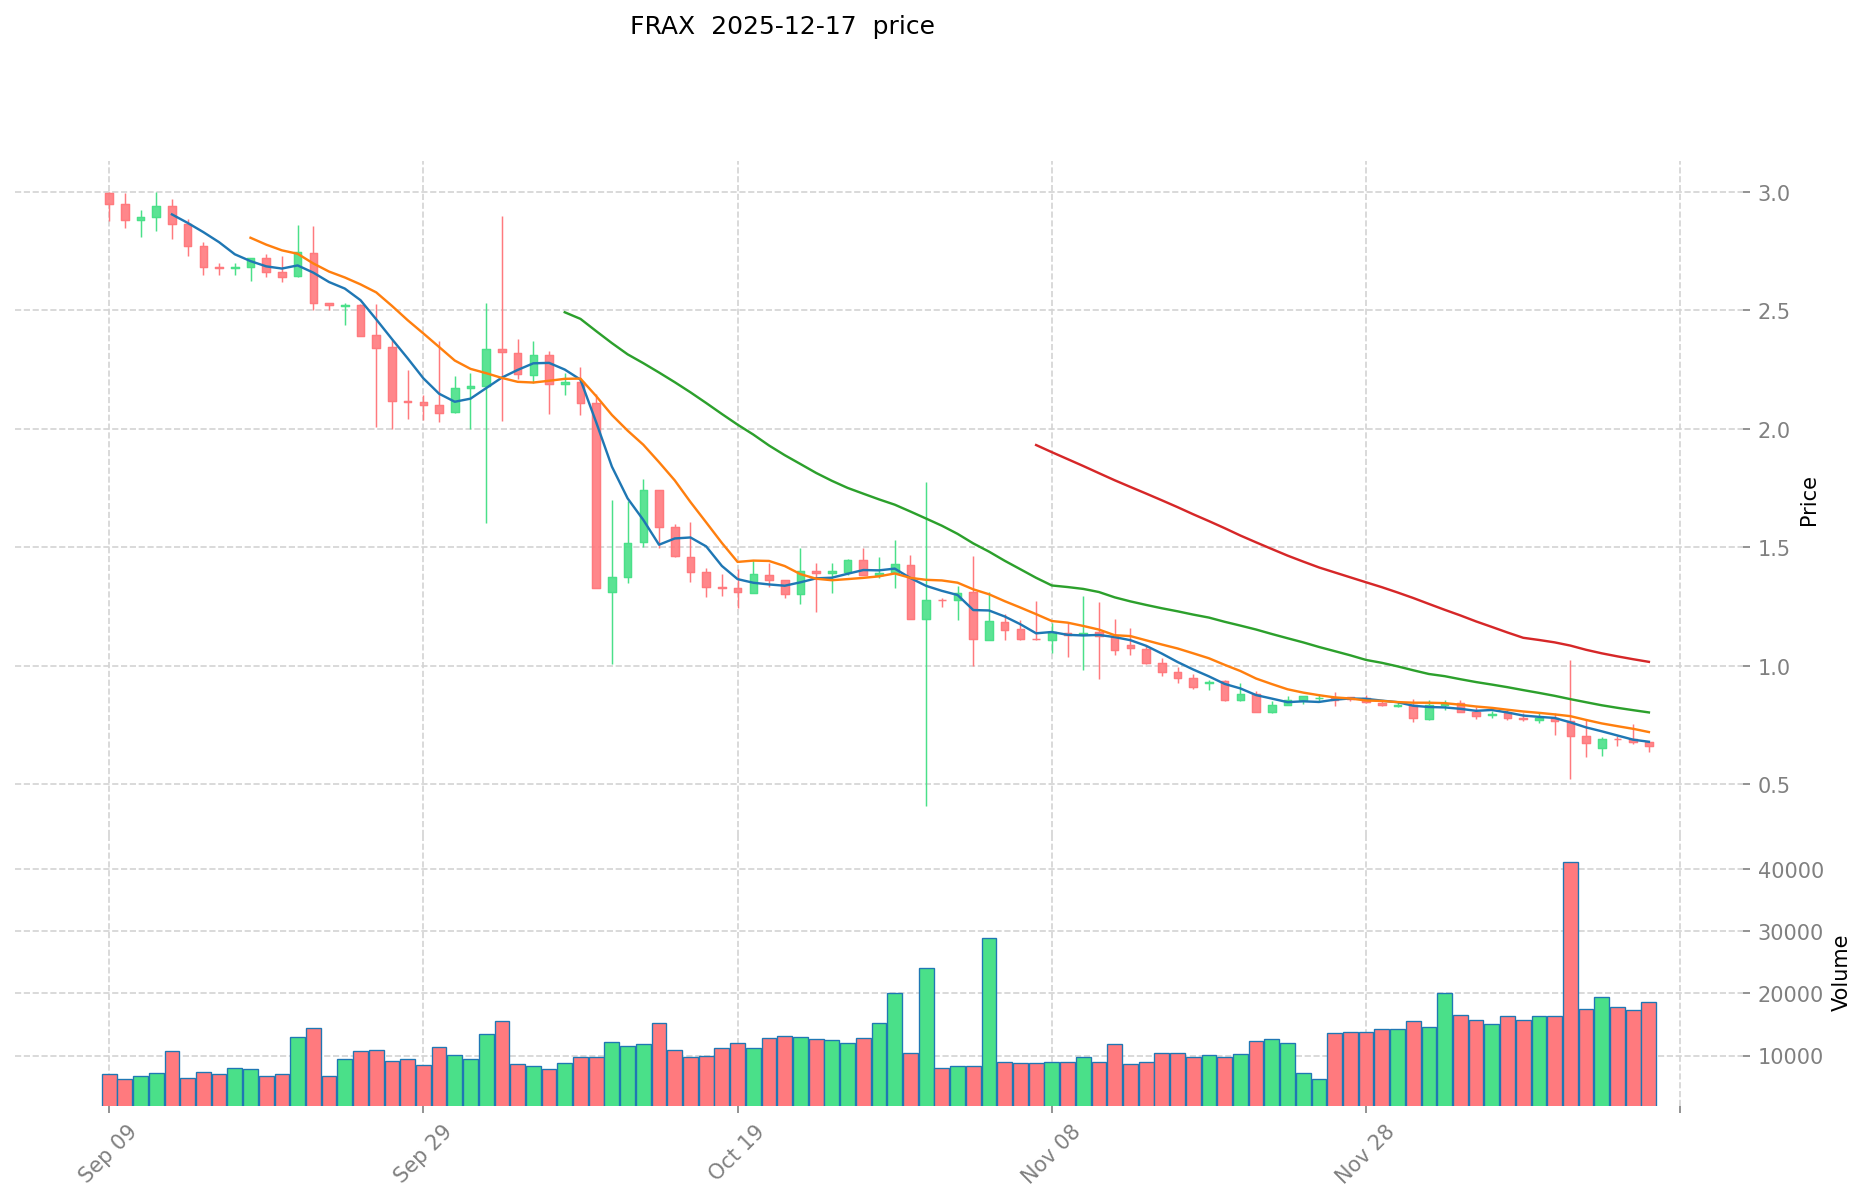
FRAX Price History:
- All-time high: $1.14 (February 7, 2021)
- All-time low: $0.874536 (March 11, 2023)
- Year-over-year change: -77.86%
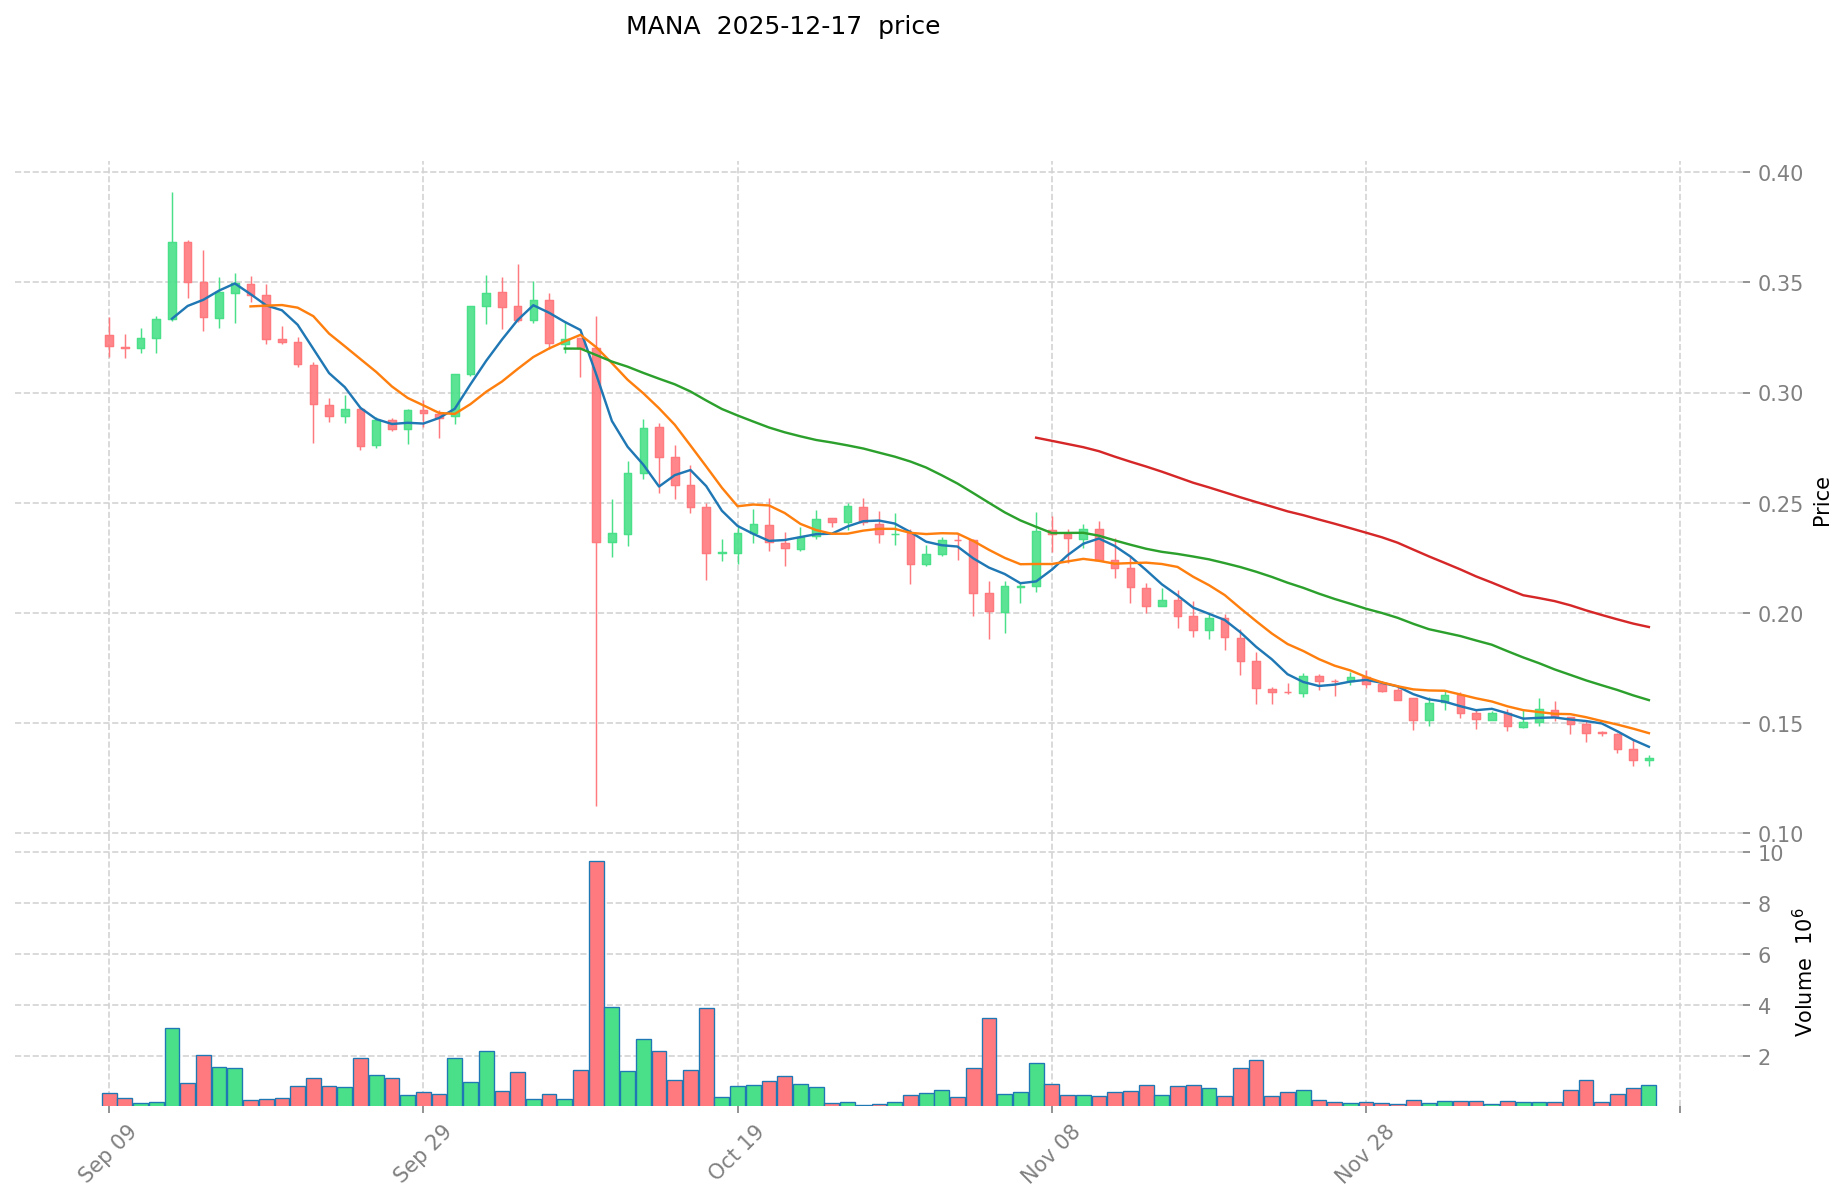
MANA Price History:
- All-time high: $5.85 (November 25, 2021)
- All-time low: $0.00923681 (October 31, 2017)
- Year-over-year change: -78.9%
Comparative Analysis: Both assets have experienced significant depreciation over the past year, with MANA declining 78.9% and FRAX declining 77.86%. MANA shows a more dramatic historical price range, having appreciated from its 2017 low to its 2021 peak. FRAX, as a more recently launched asset, demonstrates a steeper decline from its 2021 high. Both tokens reflect broader market cycles affecting Layer 2 solutions and metaverse-related assets.
Current Market Status (December 18, 2025)
FRAX Market Data:
- Current price: $0.751
- 24-hour change: +13.13%
- 1-hour change: +16.25%
- 7-day change: -3.85%
- 30-day change: -16.91%
- Market capitalization: $106,573,792.68
- Circulating supply: 90,892,245 FRAX
- 24-hour trading volume: $13,279.31
MANA Market Data:
- Current price: $0.1271
- 24-hour change: -5.36%
- 1-hour change: +0.16%
- 7-day change: -18.42%
- 30-day change: -33.58%
- Market capitalization: $278,753,092.50
- Circulating supply: 1,919,118,227.29 MANA
- 24-hour trading volume: $53,036.69
Market Sentiment: Crypto Fear & Greed Index: 16 (Extreme Fear)
Current Price Links:
II. Technical Architecture and Blockchain Infrastructure
FRAX: Layer 2 Rollup Solution
Fraxtal operates as a modular Layer 2 (L2) rollup blockchain with the following technical specifications:
Core Features:
- EVM-equivalent rollup utilizing OP Stack as its smart contract platform
- Deployment speed, security, and transaction costs comparable to leading Ethereum rollups (Optimism, Base)
- Modular architecture with components and middleware for cross-chain integration
- Capacity for deploying Layer 3 (L3) networks on top of Fraxtal
- Custom data availability module developed by the Frax Core Team
Economic Incentives:
- Blockspace incentive mechanism called "Flox"
- Users earn FXTL points for consuming gas and interacting with smart contracts
- Developers earn FXTL points when their deployed contracts consume gas
- Users can earn rewards exceeding their actual gas expenditure
- Native gas token: FRAX (issued by Frax Finance)
MANA: Decentralized Virtual World Platform
Decentraland operates as a blockchain-based virtual world platform with distinct technical characteristics:
Core Features:
- Ethereum blockchain-based infrastructure
- Two-layer consensus architecture:
- Consensus Layer: Maintains LAND token ownership records on the blockchain
- Content Layer: Decentralized storage system controlling virtual plot interactions
- Non-fungible token (NFT) representation of virtual land parcels
- Users retain permanent ownership and operational control of virtual assets
- Elimination of intermediary fees through decentralized architecture
Economic Model:
- Native token: MANA (ERC-20 standard)
- Used for purchasing LAND NFTs and virtual goods/services
- Deflationary mechanism: 2.5% transaction fee on LAND marketplace trades
- Over 600 million MANA tokens burned to date through this mechanism
III. Market Position and Competitive Positioning
Market Capitalization Comparison:
- MANA market cap ($278.75M) exceeds FRAX market cap ($106.57M) by approximately 2.6x
- MANA ranks #199 in global cryptocurrency rankings
- FRAX ranks #421 in global cryptocurrency rankings
Liquidity and Trading Activity:
- MANA demonstrates higher absolute trading volume ($53,036.69 vs $13,279.31)
- MANA shows broader exchange coverage (57 exchanges) compared to FRAX (1 exchange)
- MANA holder count significantly exceeds FRAX (287,884 vs 3,249 holders)
Market Sentiment Divergence:
- FRAX shows positive momentum: +13.13% in 24 hours, +16.25% in 1 hour
- MANA shows negative momentum: -5.36% in 24 hours, -18.42% in 7 days
- Macro sentiment indicator reveals extreme fear conditions across the broader cryptocurrency market
IV. Key Operational Differences
FRAX (Infrastructure-Focused):
- Positions itself as scalability infrastructure for Ethereum
- Emphasizes developer incentives and modular design
- Focus on performance metrics comparable to established rollups
- Gas token serves dual purpose as native currency
MANA (Application-Focused):
- Targets user participation in virtual world economy
- Emphasis on asset ownership and persistent digital property rights
- Deflationary tokenomics through transaction fee burning
- Established marketplace with demonstrated partner collaborations
V. Risk Considerations
Market-Wide Risks: Both assets currently operate within an environment of extreme fear (Fear & Greed Index: 16), indicating elevated market volatility and risk sentiment.
Asset-Specific Observations:
- FRAX: Limited exchange listing and holder base may impact liquidity
- MANA: Sustained downward price pressure over extended periods reflects challenges in virtual world platform adoption and monetization
VI. Resource Links
-
FRAX Official Website: https://frax.com/
-
FRAX Block Explorer: https://fraxscan.com
-
FRAX Social: https://x.com/fraxfinance
-
Decentraland Official Website: https://decentraland.org/
-
Decentraland Blockchain Explorer: https://etherscan.io/token/0x0F5D2fB29fb7d3CFeE444a200298f468908cC942
-
Decentraland Social: https://twitter.com/decentraland
Data current as of December 18, 2025, 05:18 UTC
Comparative Analysis of FRAX and MANA Investment Value
I. Executive Summary
This report examines the core investment value factors for FRAX and MANA tokens based on available reference materials. FRAX's value proposition centers on stablecoin stability and liquidity mechanisms, while MANA's investment thesis relies on its utility within the Ethereum ecosystem and staking reward structures.
II. Core Factors Influencing Investment Value of FRAX vs MANA
Supply Mechanism and Tokenomics
FRAX: FRAX operates as a fractional-reserve stablecoin requiring collateralization of 0.85 USD in USDC combined with 0.15 USD in FXS tokens. As the collateralization ratio increases, FXS liquidity relative to FRAX supply increases proportionally, enabling redemption of greater quantities of FRAX. This mechanism creates a dynamic relationship between the stablecoin supply and governance token utility.
MANA: MANA functions across three primary roles as currency, consumption asset, or yield-bearing asset. These multiple use cases form the foundation for MANA valuation assessment.
Application Scenarios and Ecosystem Utility
MANA Ecosystem Development: Application scenarios drive MANA's value as a medium of exchange within the Ethereum network while simultaneously accelerating MANA adoption for staking purposes, creating multiple incentive layers for token holders.
Macroeconomic Considerations
Algorithmic Stablecoin Framework: FRAX represents an important evolution in pursuing native stablecoins within the crypto ecosystem. Unlike traditional collateralized models, algorithmic stablecoins operate through market-driven mechanisms and algorithmic controls without requiring fiat currency anchoring or traditional collateral backing.
Token Economy Dynamics: From the perspective of broad token economics, imbalances in credit issuance can create systemic vulnerabilities when physical-backed tokens or lower-tier virtual tokens experience significant redemption pressure, potentially triggering financial stress.
III. Risk Considerations
The comparative investment value analysis requires consideration of stablecoin stability and liquidity for FRAX, alongside ecosystem utility and staking reward structures for MANA. Both tokens operate within distinct value capture mechanisms requiring ongoing monitoring of their respective operational parameters.
IV. Limitations of Available Data
The reference materials provide foundational insights into valuation frameworks for both tokens but do not contain comprehensive data regarding current market metrics, institutional adoption levels, specific technical upgrades, or detailed regulatory positioning across different jurisdictions. Investors should conduct additional due diligence with current market data before making investment decisions.
III. 2025-2030 Price Forecast: FRAX vs MANA
Short-term Forecast (2025)
- FRAX: Conservative $0.6008-$0.751 | Optimistic $0.751-$1.02136
- MANA: Conservative $0.108035-$0.1271 | Optimistic $0.1271-$0.166501
Mid-term Forecast (2027-2028)
- FRAX may enter growth consolidation phase, with anticipated price range of $0.836-$1.319 (2027) and $0.817-$1.519 (2028)
- MANA may enter expansion phase, with anticipated price range of $0.123-$0.213 (2027) and $0.114-$0.229 (2028)
- Key drivers: Institutional capital inflows, ETF approvals, ecosystem development acceleration
Long-term Forecast (2030)
- FRAX: Base scenario $1.273-$1.368 | Optimistic scenario $1.368-$1.861
- MANA: Base scenario $0.164-$0.253 | Optimistic scenario $0.253-$0.354
Disclaimer: This analysis is based on historical data extrapolation and market modeling. Cryptocurrency markets are highly volatile and subject to unforeseen regulatory, technological, and macroeconomic factors. Past performance does not guarantee future results. This forecast should not be construed as investment advice. Investors should conduct their own due diligence and consult financial advisors before making investment decisions.
FRAX:
| 年份 | 预测最高价 | 预测平均价格 | 预测最低价 | 涨跌幅 |
|---|---|---|---|---|
| 2025 | 1.02136 | 0.751 | 0.6008 | 0 |
| 2026 | 1.0811396 | 0.88618 | 0.4962608 | 17 |
| 2027 | 1.318104132 | 0.9836598 | 0.83611083 | 30 |
| 2028 | 1.51916419512 | 1.150881966 | 0.81712619586 | 52 |
| 2029 | 1.401774234588 | 1.33502308056 | 0.9211659255864 | 77 |
| 2030 | 1.86102217430064 | 1.368398657574 | 1.27261075154382 | 81 |
MANA:
| 年份 | 预测最高价 | 预测平均价格 | 预测最低价 | 涨跌幅 |
|---|---|---|---|---|
| 2025 | 0.166501 | 0.1271 | 0.108035 | 0 |
| 2026 | 0.19084065 | 0.1468005 | 0.077804265 | 15 |
| 2027 | 0.2127139245 | 0.168820575 | 0.12323901975 | 32 |
| 2028 | 0.2289206997 | 0.19076724975 | 0.11446034985 | 50 |
| 2029 | 0.29588000436225 | 0.209843974725 | 0.125906384835 | 65 |
| 2030 | 0.354006785361075 | 0.252861989543625 | 0.164360293203356 | 98 |
Comparative Analysis Report: FRAX vs MANA Investment Comparison
I. Historical Price Performance and Current Market Status
Price Trajectory Overview
FRAX Price History:
- All-time high: $1.14 (February 7, 2021)
- All-time low: $0.874536 (March 11, 2023)
- Year-over-year change: -77.86%
MANA Price History:
- All-time high: $5.85 (November 25, 2021)
- All-time low: $0.00923681 (October 31, 2017)
- Year-over-year change: -78.9%
Both assets have experienced significant depreciation over the past year, with MANA declining 78.9% and FRAX declining 77.86%. MANA demonstrates a more dramatic historical price range with steeper appreciation from 2017 lows. FRAX, as a more recently launched asset, shows a steeper decline from its 2021 peak. Both tokens reflect broader market cycles affecting Layer 2 solutions and metaverse-related assets.
Current Market Status (December 18, 2025)
| Metric | FRAX | MANA |
|---|---|---|
| Current Price | $0.751 | $0.1271 |
| 24-hour Change | +13.13% | -5.36% |
| Market Capitalization | $106,573,792.68 | $278,753,092.50 |
| Circulating Supply | 90,892,245 | 1,919,118,227.29 |
| 24-hour Trading Volume | $13,279.31 | $53,036.69 |
| Holder Count | 3,249 | 287,884 |
| Exchange Listings | 1 | 57 |
Market Sentiment: Crypto Fear & Greed Index: 16 (Extreme Fear)
II. Technical Architecture and Infrastructure Comparison
FRAX: Layer 2 Rollup Infrastructure
Core Technical Features:
- EVM-equivalent rollup utilizing OP Stack as its smart contract platform
- Deployment speed, security, and transaction costs comparable to leading Ethereum rollups (Optimism, Base)
- Modular architecture with components for cross-chain integration
- Custom data availability module developed by the Frax Core Team
- Capacity for deploying Layer 3 (L3) networks on top of Fraxtal
Economic Incentive Model (Flox):
- Blockspace incentive mechanism rewarding network participation
- Users earn FXTL points for consuming gas and interacting with smart contracts
- Developers earn FXTL points when deployed contracts consume gas
- Users can earn rewards exceeding actual gas expenditure
- Native gas token: FRAX
MANA: Decentralized Virtual World Platform
Core Technical Features:
- Ethereum blockchain-based infrastructure
- Two-layer consensus architecture:
- Consensus Layer: Maintains LAND token ownership records on-chain
- Content Layer: Decentralized storage system controlling virtual plot interactions
- Non-fungible token (NFT) representation of virtual land parcels
- Permanent user ownership and operational control of virtual assets
- Elimination of intermediary fees through decentralized architecture
Economic Model:
- Native token: MANA (ERC-20 standard)
- Used for purchasing LAND NFTs and virtual goods/services
- Deflationary mechanism: 2.5% transaction fee on LAND marketplace trades
- Over 600 million MANA tokens burned to date
III. Market Position and Competitive Analysis
Market Capitalization and Ranking
- MANA market cap ($278.75M) exceeds FRAX market cap ($106.57M) by approximately 2.6x
- MANA ranks #199 in global cryptocurrency rankings
- FRAX ranks #421 in global cryptocurrency rankings
Liquidity and Market Accessibility
FRAX Limitations:
- Listed on only 1 exchange
- Minimal trading volume ($13,279.31 daily)
- Limited holder base (3,249 addresses)
- Concentrated liquidity presentation risk
MANA Strengths:
- Broad exchange coverage (57 exchanges)
- Higher trading volume ($53,036.69 daily)
- Significantly larger holder community (287,884 addresses)
- Established market infrastructure
Current Price Momentum
- FRAX shows positive momentum: +13.13% in 24 hours, +16.25% in 1 hour
- MANA shows negative momentum: -5.36% in 24 hours, -18.42% in 7 days
IV. Investment Strategy Comparison: FRAX vs MANA
Long-term vs Short-term Investment Strategy
FRAX: Best Suited For
- Infrastructure-focused investors seeking exposure to Layer 2 scaling solutions
- Developers and participants in modular blockchain ecosystems
- Investors betting on Ethereum scalability narrative
- Shorter-term traders capitalizing on immediate momentum (+13.13% 24-hour performance)
MANA: Best Suited For
- Long-term believers in decentralized virtual world economy development
- Investors seeking established platform with active community (287,884+ holders)
- Risk-tolerant investors willing to endure sustained downward pressure
- Portfolio diversification through metaverse sector exposure
Risk Management and Asset Allocation
| Investor Profile | FRAX Allocation | MANA Allocation | Hedge Position |
|---|---|---|---|
| Conservative | 15% | 20% | 65% Stablecoins |
| Moderate | 25% | 35% | 40% Stablecoins/BTC |
| Aggressive | 40% | 50% | 10% Stablecoins/Other Alts |
Hedging Recommendations:
- Stablecoin allocation for downside protection in extreme fear environments (current Fear & Greed: 16)
- Options strategies (protective puts) for positions exceeding $50,000 USD
- Cross-asset diversification with bitcoin and ethereum as market stabilizers
V. Potential Risk Comparison
Market Risks
FRAX:
- Extreme liquidity concentration (single exchange listing)
- Limited holder base (3,249 addresses) creates vulnerability to whale movements
- Nascent market adoption may result in sudden price volatility
- Gas token utility dependent on Fraxtal ecosystem development
MANA:
- Sustained 78.9% year-over-year decline indicates market skepticism regarding virtual world monetization
- Extended bearish pressure suggests platform adoption challenges
- Deflationary tokenomics may mask declining on-chain activity
- Virtual property market dependent on sustained user engagement and network effects
Technical Risks
FRAX:
- Reliance on OP Stack technology tied to Optimism ecosystem developments
- Modular architecture introduces complexity in cross-chain interactions
- Limited track record as Layer 2 infrastructure token
- Dependency on developer adoption for Flox incentive program viability
MANA:
- Content Layer decentralization presents technical scalability challenges
- NFT marketplace concentration risk if primary secondary markets fail
- Ethereum network congestion directly impacts MANA transaction efficiency
- Avatar and virtual property data storage resilience unproven under stress conditions
Regulatory Risks
- Both assets operate in evolving regulatory environment for blockchain technologies
- Stablecoin frameworks (relevant to FRAX's collateralization mechanics) face increased scrutiny globally
- Virtual world platforms (MANA) may encounter additional compliance requirements for digital property rights and user transactions
- Layer 2 solutions potentially subject to enhanced regulatory oversight as Ethereum scaling infrastructure
VI. Price Forecasts: 2025-2030
Short-term Forecast (2025)
| Asset | Conservative Range | Optimistic Range |
|---|---|---|
| FRAX | $0.6008 - $0.751 | $0.751 - $1.02136 |
| MANA | $0.108035 - $0.1271 | $0.1271 - $0.166501 |
Mid-term Forecast (2027-2028)
FRAX:
- 2027: $0.836 - $1.319 (30% potential upside)
- 2028: $0.817 - $1.519 (52% potential upside)
MANA:
- 2027: $0.123 - $0.213 (32% potential upside)
- 2028: $0.114 - $0.229 (50% potential upside)
Long-term Forecast (2030)
| Asset | Base Scenario | Optimistic Scenario |
|---|---|---|
| FRAX | $1.273 - $1.368 (81% upside) | $1.368 - $1.861 |
| MANA | $0.164 - $0.253 (98% upside) | $0.253 - $0.354 |
Forecast Disclaimer: This analysis is based on historical data extrapolation and market modeling. Cryptocurrency markets are highly volatile and subject to unforeseen regulatory, technological, and macroeconomic factors. Past performance does not guarantee future results.
VII. Conclusion: Which Is the Better Buy?
Investment Value Summary
FRAX Advantages:
- Infrastructure-backed value proposition targeting Ethereum scalability
- Positive short-term momentum (+13.13% 24-hour performance)
- Modular design enables Layer 3 deployment capabilities
- Blockspace incentive mechanisms create utility drivers beyond speculation
MANA Advantages:
- Established platform with proven track record (launched prior to 2021 peak)
- Significantly larger market capitalization ($278.75M vs $106.57M)
- Broad exchange accessibility (57 exchanges) provides liquidity
- Substantial holder community (287,884 addresses) indicates sustained interest
- Deflationary tokenomics through marketplace transaction fees
Investment Recommendations
For Beginning Investors:
- Consider MANA as entry point given broader market accessibility (57 exchanges) and established infrastructure
- Start with 5-10% of allocated cryptocurrency budget in either asset
- Prioritize stablecoin reserves (65% allocation minimum) given extreme market fear conditions (Fear & Greed: 16)
- Begin with educational positioning before committing substantial capital
For Experienced Investors:
- FRAX presents higher-risk/higher-reward infrastructure play with positive momentum catalysts
- MANA offers portfolio diversification with established market position and lower volatility relative to Layer 2 solutions
- Implement dollar-cost averaging strategy over 6-12 month period to mitigate timing risk
- Use 40% stablecoin allocation for opportunistic rebalancing
For Institutional Investors:
- FRAX ecosystem development presents infrastructure investment opportunity if Fraxtal achieves developer adoption
- MANA's larger market cap and liquidity provide institutional positioning feasibility
- Conduct due diligence on Fraxtal transaction volume and daily active user metrics before institutional allocation
- Consider both assets as longer-term (3-5 year) infrastructure exposure rather than tactical positions
VIII. Risk Disclaimer
⚠️ Critical Risk Notice: Cryptocurrency markets exhibit extreme volatility, particularly during fear-driven sentiment periods (current Fear & Greed Index: 16). FRAX and MANA both represent speculative assets without guaranteed returns. This report provides comparative analysis only and does not constitute investment advice, financial recommendations, or endorsements. Individual investors must conduct independent due diligence, assess personal risk tolerance, and consult qualified financial advisors before making investment decisions. Past performance does not guarantee future results. All forecasts carry substantial uncertainty and should not drive investment decisions independently.
Data Currency: December 18, 2025, 05:18 UTC
Reference Materials: Official FRAX and MANA documentation, blockchain explorers, market data aggregators None
FRAX vs MANA Investment Comparison: Frequently Asked Questions
FAQ Section
Q1: What are the primary technical differences between FRAX and MANA?
A: FRAX functions as a Layer 2 rollup solution built on OP Stack, designed to provide Ethereum scalability with blockspace incentive mechanisms (Flox). MANA operates as a governance and utility token for Decentraland, a decentralized virtual world platform built on Ethereum. FRAX emphasizes infrastructure and developer incentives, while MANA focuses on virtual property ownership and platform economics without intermediaries.
Q2: Which asset has better liquidity and market accessibility?
A: MANA demonstrates significantly superior liquidity with listings on 57 exchanges compared to FRAX's single exchange listing. MANA also shows higher daily trading volume ($53,036.69 vs $13,279.31) and a substantially larger holder base (287,884 vs 3,249 addresses). For retail investors prioritizing accessibility, MANA presents the more liquid option. FRAX's limited exchange presence creates concentration risk.
Q3: How have FRAX and MANA performed over the past year?
A: Both assets experienced severe depreciation: FRAX declined 77.86% year-over-year while MANA declined 78.9%. Current price points are FRAX at $0.751 and MANA at $0.1271. However, short-term momentum diverges significantly—FRAX shows positive momentum (+13.13% in 24 hours), while MANA shows negative momentum (-5.36% in 24 hours, -18.42% in 7 days). Both reflect broader market cycles affecting Layer 2 solutions and metaverse assets during an extreme fear environment.
Q4: What are the key risk differences between these two assets?
A: FRAX risks include extreme liquidity concentration from single exchange listing, limited holder base vulnerability to whale movements, and dependency on Fraxtal ecosystem developer adoption. MANA risks include sustained bearish pressure indicating virtual world monetization challenges, potential platform adoption limitations, and dependency on consistent user engagement for network effects. Both face regulatory uncertainty regarding stablecoins (FRAX framework) and virtual property rights (MANA platform).
Q5: Which asset offers better long-term investment potential based on 2030 forecasts?
A: FRAX projects base scenario range of $1.273-$1.368 by 2030 (81% upside), while MANA projects $0.164-$0.253 (98% upside). MANA shows higher percentage appreciation potential, though from a lower absolute price base. FRAX appears better positioned for infrastructure-focused investors seeking Layer 2 exposure, while MANA suits investors betting on virtual world economy expansion. Both forecasts carry substantial uncertainty and depend on ecosystem development success.
Q6: What tokenomics differences exist between FRAX and MANA?
A: FRAX operates as a fractional-reserve stablecoin requiring 0.85 USD in USDC plus 0.15 USD in FXS governance tokens, creating dynamic collateral relationships. MANA functions as multi-use token serving as currency, consumption asset, and yield-bearing asset. MANA implements deflationary mechanisms through 2.5% marketplace transaction fees, with over 600 million tokens burned to date. FRAX's fractional design creates different value dynamics compared to MANA's multifaceted utility approach.
Q7: Should beginning investors choose FRAX or MANA?
A: Beginning investors should prioritize MANA due to superior market accessibility (57 exchange listings), established track record, and significantly larger holder community (287,884 addresses). However, both assets require cautious positioning given extreme market fear conditions (Fear & Greed Index: 16). Recommended allocation: 5-10% maximum in either asset, with 65% portfolio allocation to stablecoins for capital preservation and opportunistic rebalancing. Conduct personal due diligence before investment decisions.
Q8: What macroeconomic factors currently influence both assets?
A: Both FRAX and MANA operate within an extreme fear environment (Fear & Greed Index: 16), indicating elevated market volatility and risk sentiment. Broader cryptocurrency market cycles affecting Layer 2 solutions and metaverse sectors create headwinds. FRAX development depends on Ethereum scalability narrative adoption and Fraxtal developer ecosystem growth. MANA valuations reflect broader skepticism regarding virtual world monetization and platform sustainability under current market conditions. Macroeconomic uncertainty impacts risk appetite for both speculative assets.
Data Current: December 18, 2025
Disclaimer: This FAQ section provides comparative analysis only and does not constitute investment advice. Cryptocurrency markets are highly volatile with no guaranteed returns. Investors must conduct independent due diligence and consult qualified financial advisors before making investment decisions.
Share
Content
Introduction: FRAX vs MANA Investment Comparison
I. Historical Price Comparison and Current Market Status
II. Technical Architecture and Blockchain Infrastructure
III. Market Position and Competitive Positioning
IV. Key Operational Differences
V. Risk Considerations
VI. Resource Links
I. Executive Summary
II. Core Factors Influencing Investment Value of FRAX vs MANA
III. Risk Considerations
IV. Limitations of Available Data
III. 2025-2030 Price Forecast: FRAX vs MANA
I. Historical Price Performance and Current Market Status
II. Technical Architecture and Infrastructure Comparison
III. Market Position and Competitive Analysis
IV. Investment Strategy Comparison: FRAX vs MANA
V. Potential Risk Comparison
VI. Price Forecasts: 2025-2030
VII. Conclusion: Which Is the Better Buy?
VIII. Risk Disclaimer
FAQ Section
How to Buy Cryptocurrency


Trending Cryptocurrencies


XZXX: A Comprehensive Guide to the BRC-20 Meme Token in 2025

Bitcoin Fear and Greed Index: Market Sentiment Analysis for 2025

Top Crypto ETFs to Watch in 2025: Navigating the Digital Asset Boom

5 ways to get Bitcoin for free in 2025: Newbie Guide

Bitcoin Market Cap in 2025: Analysis and Trends for Investors

2025 Bitcoin Price Prediction: Trump's Tariffs' Impact on BTC
What is CSPR: A Comprehensive Guide to Casper Network's Native Cryptocurrency
What is SOSO: A Comprehensive Guide to Understanding the Emerging Social Platform and Its Impact on Digital Communication

What is SKL: A Comprehensive Guide to Understanding the Scikit-Learn Machine Learning Library

What is ANKR: A Comprehensive Guide to Ankr Protocol and Its Role in Web3 Infrastructure

What is RECALL: Understanding the Essential Metric for Evaluating Machine Learning Model Performance