PRISM vs KAVA: A Comprehensive Comparison of Two Leading Privacy-Focused Blockchain Platforms


Introduction: Investment Comparison Between PRISM and KAVA
In the cryptocurrency market, the comparison between PRISM vs KAVA has become an important topic for investors. Both projects exhibit notable differences in market capitalization ranking, application scenarios, and price performance, representing distinct positioning within the crypto asset landscape. PRISM (PRISM): Launched in 2021, this project positions itself as a comprehensive platform integrating multi-network scalability, fundraising initiatives, and gas-free token redistribution. It provides white-label solutions for DeFi startups and multi-network launchpad services for EVM-compatible networks. KAVA (KAVA): Since its launch in 2019, KAVA has established itself as a cross-chain decentralized finance platform providing collateralized lending and stablecoin services for mainstream digital assets. It operates as a decentralized Layer 1 hub supporting cross-chain DeFi applications and services. This article will comprehensively analyze the investment value comparison between PRISM vs KAVA through examining historical price trends, supply mechanisms, institutional adoption, technological ecosystems, and future projections, attempting to address the question most investors care about:
"Which presents a more compelling investment opportunity at current market conditions?"
I. Historical Price Comparison and Current Market Status
PRISM and KAVA Historical Price Trends
- 2022: PRISM reached a notable price level of $0.04643859 on January 12, 2022, representing a significant milestone in its early trading history.
- 2021: KAVA experienced substantial price movement, reaching $9.12 on August 30, 2021, marking a period of elevated market activity for the token.
- Comparative Analysis: During the recent market cycle, PRISM declined from its peak of $0.04643859 to a lower level of $0.0000841 recorded on February 17, 2025, while KAVA showed a similar downward trajectory from $9.12 to $0.059126 on February 1, 2026.
Current Market Situation (February 3, 2026)
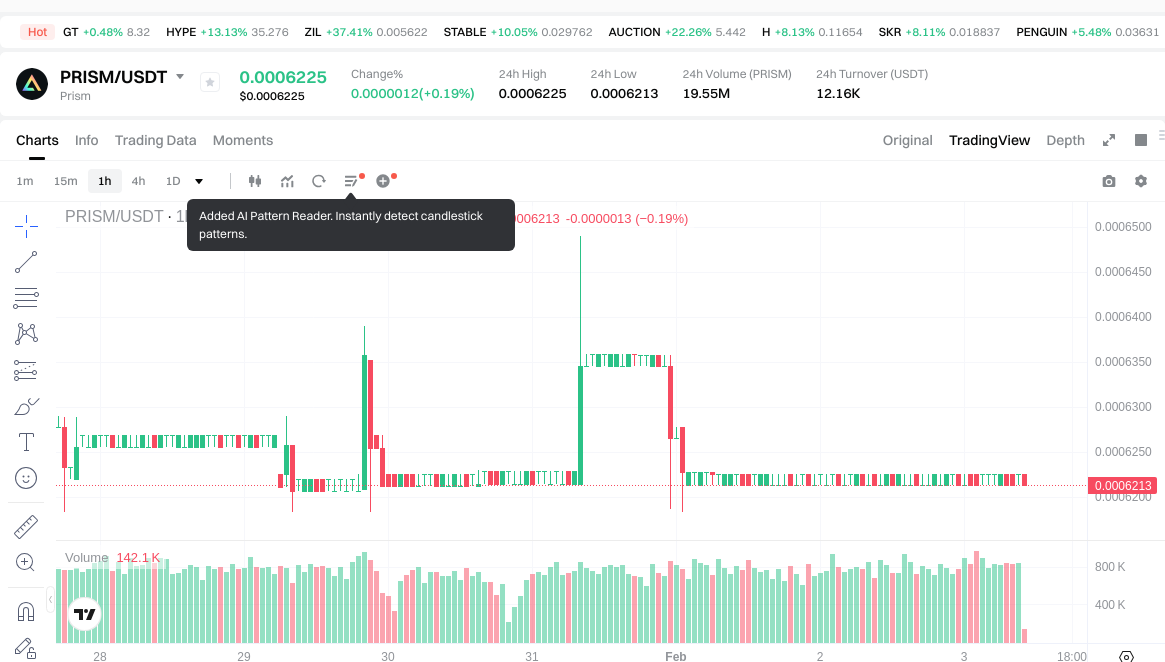
- PRISM current price: $0.0006225
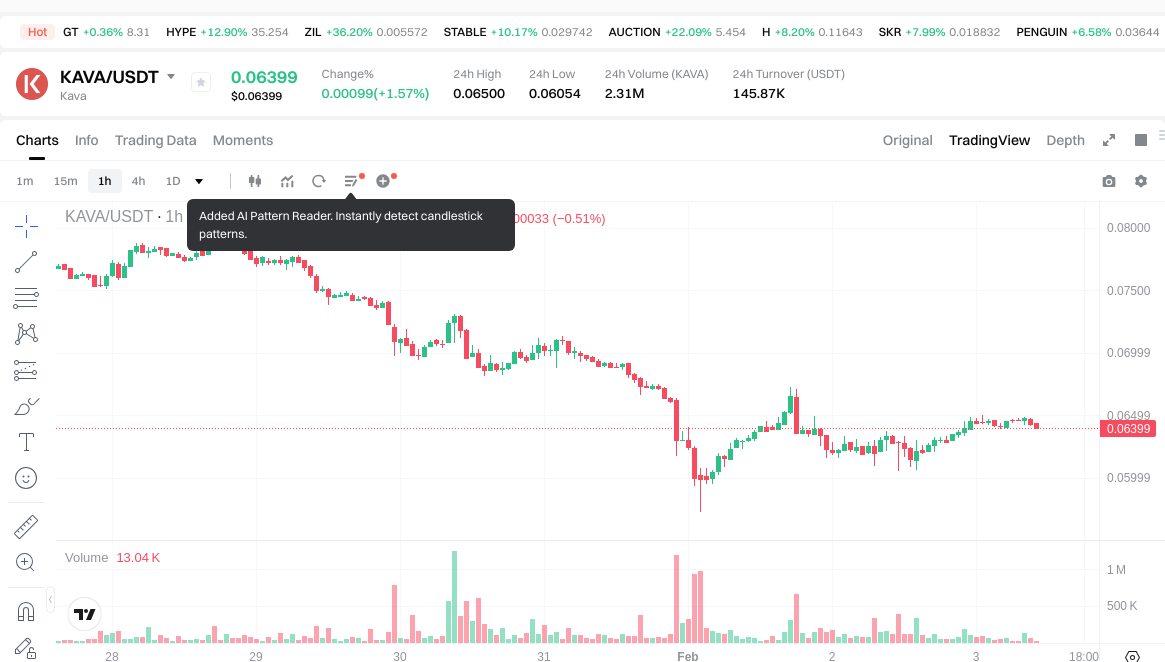
- KAVA current price: $0.06419
- 24-hour trading volume: PRISM $12,159.50 vs KAVA $145,753.68
- Market sentiment index (Fear & Greed Index): 17 (Extreme Fear)
View real-time prices:
- Check PRISM current price Market Price
- Check KAVA current price Market Price
II. Core Factors Influencing PRISM vs KAVA Investment Value
Tokenomics Comparison
- PRISM: Serves as the base asset in liquidity pools, requiring users to hold PRISM alongside other assets for liquidity provision. Users can stake PRISM to obtain xPRISM for governance participation.
- KAVA: Ecosystem growth is supported by partnerships and technology developments that influence token utility and distribution mechanisms.
- 📌 Historical Pattern: Supply mechanisms play a role in shaping price cycles, with token staking and liquidity requirements affecting circulating supply dynamics.
Institutional Adoption and Market Application
- Institutional Holdings: Both projects target different segments within the DeFi landscape, with varying degrees of institutional interest.
- Enterprise Adoption: PRISM focuses on liquidity provision and governance within decentralized protocols, while KAVA emphasizes cross-chain interoperability and lending services.
- Regulatory Environment: Both projects operate within evolving regulatory frameworks that impact their adoption across different jurisdictions.
Technology Development and Ecosystem Building
- PRISM Technology: Integrates liquidity provision mechanisms with governance features, positioning itself within the Terra ecosystem recovery and development.
- KAVA Technology: Focuses on cross-chain DeFi infrastructure, enabling lending, borrowing, and staking across multiple blockchain networks.
- Ecosystem Comparison: PRISM concentrates on liquidity and governance within specific protocols, while KAVA offers broader DeFi services including lending platforms and cross-chain bridges.
Macroeconomic Environment and Market Cycles
- Inflation Dynamics: Both assets exhibit varying sensitivity to macroeconomic conditions, with their performance influenced by broader cryptocurrency market trends.
- Monetary Policy Impact: Interest rate changes and liquidity conditions in traditional markets affect risk appetite for DeFi tokens.
- Geopolitical Considerations: Cross-border transaction needs and regulatory developments in different regions influence adoption patterns for both protocols.
III. 2026-2031 Price Prediction: PRISM vs KAVA
Short-term Forecast (2026)
- PRISM: Conservative $0.000534318 - $0.0006213 | Optimistic $0.000534318 - $0.000671004
- KAVA: Conservative $0.0326451 - $0.06401 | Optimistic $0.0326451 - $0.0665704
Medium-term Forecast (2028-2029)
- PRISM may enter a gradual accumulation phase, with projected price range of $0.0003793558392 - $0.00110878390896
- KAVA may enter a moderate growth phase, with projected price range of $0.0418590815397 - $0.0830086871211
- Key drivers: institutional capital inflows, ETF adoption, ecosystem development
Long-term Forecast (2030-2031)
- PRISM: Baseline scenario $0.000606080851412 - $0.001082287234665 | Optimistic scenario $0.00120254137185 - $0.001298744681598
- KAVA: Baseline scenario $0.048958097978449 - $0.081596829964083 | Optimistic scenario $0.086215518452616 - $0.110971688751152
Disclaimer
PRISM:
| Year | Predicted High Price | Predicted Average Price | Predicted Low Price | Price Change |
|---|---|---|---|---|
| 2026 | 0.000671004 | 0.0006213 | 0.000534318 | 0 |
| 2027 | 0.00068492112 | 0.000646152 | 0.00034892208 | 3 |
| 2028 | 0.000965028012 | 0.00066553656 | 0.0003793558392 | 6 |
| 2029 | 0.00110878390896 | 0.000815282286 | 0.0005299334859 | 30 |
| 2030 | 0.00120254137185 | 0.00096203309748 | 0.000606080851412 | 54 |
| 2031 | 0.001298744681598 | 0.001082287234665 | 0.000844184043038 | 73 |
KAVA:
| Year | Predicted High Price | Predicted Average Price | Predicted Low Price | Price Change |
|---|---|---|---|---|
| 2026 | 0.0665704 | 0.06401 | 0.0326451 | 0 |
| 2027 | 0.072472122 | 0.0652902 | 0.050926356 | 1 |
| 2028 | 0.07301403066 | 0.068881161 | 0.06268185651 | 7 |
| 2029 | 0.0830086871211 | 0.07094759583 | 0.0418590815397 | 10 |
| 2030 | 0.086215518452616 | 0.07697814147555 | 0.062352294595195 | 19 |
| 2031 | 0.110971688751152 | 0.081596829964083 | 0.048958097978449 | 26 |
IV. Investment Strategy Comparison: PRISM vs KAVA
Long-term vs Short-term Investment Strategies
- PRISM: May appeal to investors focusing on liquidity provision mechanisms and governance participation within specific DeFi protocols, particularly those interested in Terra ecosystem developments
- KAVA: May appeal to investors seeking exposure to cross-chain DeFi infrastructure, including lending and staking services across multiple blockchain networks
Risk Management and Asset Allocation
- Conservative Investors: PRISM 20-30% vs KAVA 70-80%
- Aggressive Investors: PRISM 40-50% vs KAVA 50-60%
- Hedging Tools: stablecoin allocation, options strategies, cross-asset portfolio diversification
V. Potential Risk Comparison
Market Risk
- PRISM: Price movements show sensitivity to liquidity conditions within specific protocol ecosystems, with trading volume of $12,159.50 indicating relatively lower market depth
- KAVA: Price fluctuations reflect broader DeFi market sentiment and cross-chain adoption trends, with 24-hour trading volume of $145,753.68 suggesting comparatively higher liquidity
Technical Risk
- PRISM: scalability considerations, network stability within integrated protocols
- KAVA: cross-chain bridge security, smart contract vulnerabilities across multiple networks
Regulatory Risk
- Global regulatory developments may affect both projects differently, with PRISM's liquidity-focused model and KAVA's lending services potentially subject to varying compliance requirements across jurisdictions
VI. Conclusion: Which Is the Better Buy?
📌 Investment Value Summary:
- PRISM Characteristics: liquidity provision focus, governance participation mechanisms, integration within specific protocol ecosystems
- KAVA Characteristics: cross-chain DeFi infrastructure, established lending and staking services, broader ecosystem connectivity
✅ Investment Considerations:
- New Investors: consider starting with assets demonstrating higher trading volumes and more established track records in DeFi markets
- Experienced Investors: evaluate risk-reward profiles based on individual portfolio objectives, technical understanding, and market cycle positioning
- Institutional Investors: conduct thorough due diligence on regulatory compliance, liquidity depth, and long-term ecosystem sustainability
⚠️ Risk Disclosure: Cryptocurrency markets exhibit significant volatility. This content does not constitute investment advice.
VII. FAQ
Q1: What are the main differences between PRISM and KAVA in terms of their core use cases?
PRISM focuses primarily on liquidity provision and governance within specific DeFi protocols, while KAVA operates as a cross-chain DeFi infrastructure platform offering lending, borrowing, and staking services. PRISM requires users to hold tokens alongside other assets for liquidity provision and offers xPRISM for governance participation, positioning itself within the Terra ecosystem recovery. KAVA, launched in 2019, has established itself as a decentralized Layer 1 hub supporting cross-chain DeFi applications, enabling interoperability across multiple blockchain networks through its cross-chain bridges and comprehensive DeFi service suite.
Q2: How do the current market conditions differ between PRISM and KAVA as of February 3, 2026?
KAVA demonstrates significantly stronger market activity compared to PRISM based on current metrics. KAVA's current price stands at $0.06419 with 24-hour trading volume of $145,753.68, indicating higher liquidity and market participation. In contrast, PRISM trades at $0.0006225 with substantially lower 24-hour volume of $12,159.50, suggesting more limited market depth. Both assets are operating in an "Extreme Fear" market environment with a Fear & Greed Index of 17, but KAVA's approximately 12x higher trading volume indicates comparatively greater market stability and investor accessibility.
Q3: What are the projected price ranges for PRISM and KAVA through 2031?
For 2026, PRISM's conservative forecast ranges from $0.000534318 to $0.0006213, with optimistic scenarios reaching $0.000671004, while KAVA's conservative estimate spans $0.0326451 to $0.06401, with optimistic projections up to $0.0665704. Long-term forecasts for 2030-2031 show PRISM's baseline scenario between $0.000606080851412 and $0.001298744681598, representing potential growth of 73% by 2031. KAVA's baseline projections for the same period range from $0.048958097978449 to $0.110971688751152, indicating potential growth of 26% by 2031. These projections depend heavily on institutional adoption, ecosystem development, and broader macroeconomic conditions.
Q4: Which token presents higher technical and market risks?
PRISM carries higher liquidity risk due to its significantly lower 24-hour trading volume of $12,159.50 compared to KAVA's $145,753.68, making it more susceptible to price slippage and market manipulation. PRISM's technical risks include scalability considerations and network stability within its integrated protocols, particularly given its connection to Terra ecosystem developments. KAVA faces different technical challenges, primarily related to cross-chain bridge security and smart contract vulnerabilities across multiple networks. From a regulatory perspective, KAVA's lending services may face stricter compliance requirements compared to PRISM's liquidity-focused model, though both operate in evolving regulatory environments across different jurisdictions.
Q5: What investment allocation strategies are recommended for different investor profiles?
Conservative investors may consider a 20-30% PRISM and 70-80% KAVA allocation, favoring KAVA's more established market presence and higher liquidity. Aggressive investors might adopt a 40-50% PRISM and 50-60% KAVA distribution, accepting higher risk for potential upside in PRISM's developing ecosystem. Risk management should incorporate stablecoin allocations, options strategies, and cross-asset portfolio diversification regardless of risk profile. New investors should prioritize assets with higher trading volumes and established track records, suggesting KAVA as a potentially more suitable entry point. Institutional investors require thorough due diligence on regulatory compliance, liquidity depth, and long-term ecosystem sustainability for both projects.
Q6: How have PRISM and KAVA performed historically since their respective launches?
PRISM, launched in 2021, reached its notable price peak of $0.04643859 on January 12, 2022, before declining to $0.0000841 by February 17, 2025, representing a significant correction during the broader market downturn. KAVA, with a longer operational history since 2019, experienced substantial price movement reaching $9.12 on August 30, 2021, followed by a decline to $0.059126 by February 1, 2026. Both assets have exhibited similar downward trajectories through recent market cycles, though KAVA's longer operational history and established position within the cross-chain DeFi infrastructure sector have contributed to maintaining relatively higher trading volumes and market capitalization compared to PRISM's more specialized liquidity provision focus.
Q7: What role do tokenomics play in the investment value proposition of PRISM versus KAVA?
PRISM's tokenomics center on its function as a base asset in liquidity pools, requiring holders to pair PRISM with other assets for liquidity provision, which affects circulating supply dynamics through locking mechanisms. Users can stake PRISM to obtain xPRISM for governance participation, creating additional utility and potential supply constraints. KAVA's ecosystem growth relies on partnerships and technology developments that influence token utility and distribution mechanisms across its cross-chain platform. Both projects' supply mechanisms play significant roles in shaping price cycles, with token staking requirements and liquidity provisions affecting available circulating supply. Historical patterns suggest that these tokenomics structures impact price volatility and long-term value accrual differently based on ecosystem adoption rates and user participation levels.
Q8: What macroeconomic factors most significantly impact PRISM and KAVA price performance?
Both PRISM and KAVA exhibit sensitivity to broader cryptocurrency market trends, inflation dynamics, and traditional financial market conditions, though their responses may differ based on their distinct positioning within the DeFi landscape. Monetary policy changes, particularly interest rate adjustments and liquidity conditions in traditional markets, affect risk appetite for DeFi tokens generally, with potential differential impacts based on each project's specific use cases. KAVA's cross-chain infrastructure may show greater correlation with overall blockchain interoperability adoption trends, while PRISM's performance may be more closely tied to liquidity conditions within specific protocol ecosystems. Geopolitical considerations, including regulatory developments in different jurisdictions and cross-border transaction needs, influence adoption patterns for both protocols, with KAVA's broader service offerings potentially providing more diversified exposure to global DeFi growth trends.
Share
Content
Introduction: Investment Comparison Between PRISM and KAVA
I. Historical Price Comparison and Current Market Status
II. Core Factors Influencing PRISM vs KAVA Investment Value
III. 2026-2031 Price Prediction: PRISM vs KAVA
IV. Investment Strategy Comparison: PRISM vs KAVA
V. Potential Risk Comparison
VI. Conclusion: Which Is the Better Buy?
VII. FAQ
How to Buy Cryptocurrency


Trending Cryptocurrencies


What will be the market capitalization of USDC in 2025? Analysis of the stablecoin market landscape.

How is DeFi different from Bitcoin?

What is DeFi: Understanding Decentralized Finance in 2025

USDC stablecoin 2025 Latest Analysis: Principles, Advantages, and Web3 Eco-Applications

Development of Decentralized Finance Ecosystem in 2025: Integration of Decentralized Finance Applications with Web3

2025 USDT USD Complete Guide: A Must-Read for Newbie Investors

2026 ISP Price Prediction: What to Expect as Internet Service Costs Rise Across the Globe

Is Credefi (CREDI) a good investment? A Comprehensive Analysis of Risk, Potential Returns, and Market Outlook

Is Smoking Chicken Fish (SCF) a good investment?: A Comprehensive Analysis of Market Potential, Risk Factors, and Long-Term Growth Prospects

Is StreamCoin (STRM) a good investment?: A Comprehensive Analysis of Market Potential, Risk Factors, and Long-Term Viability

Is Beercoin (BEER) a good investment?: A Comprehensive Analysis of Risk, Potential Returns, and Market Viability in 2024