This comprehensive analysis compares SWGT and UNI, two distinct cryptocurrency tokens operating in different market positions. SWGT, launched in 2024, functions as a utility token for blockchain-based transportation, logistics, and decentralized marketplace applications, currently trading at $0.01628 with limited liquidity. UNI, established since 2020, serves as the governance token for Uniswap's decentralized exchange protocol, trading at $3.859 with significantly higher trading volume. The article examines historical price trends, tokenomics, institutional adoption levels, technical ecosystems, and risk factors to help investors determine optimal allocation strategies. Through detailed investment comparisons, price scenario analysis, and personalized portfolio recommendations for conservative, aggressive, and institutional investors, this guide addresses critical decision-making factors in selecting between emerging utility tokens and established DeFi governance tokens available on Gate exchange.
Introduction: Investment Comparison Between SWGT and UNI
In the cryptocurrency market, the comparison between SWGT and UNI has always been a topic that investors cannot avoid. The two not only show significant differences in market cap ranking, application scenarios, and price performance, but also represent different positioning in the crypto asset space.
Smartworld Global Token (SWGT): Launched in 2024, it positions itself as a utility token for blockchain-based products ecosystem, focusing on transportation and logistics complexes implementation and a zero-commission decentralized work marketplace.
Uniswap (UNI): Since its launch in 2020, it has been recognized as a governance token for the first automated market-making protocol built on the Ethereum blockchain, becoming one of the widely adopted decentralized exchange tokens globally.
This article will comprehensively analyze the investment value comparison between SWGT and UNI around historical price trends, supply mechanisms, institutional adoption, technical ecosystems, and future forecasts, attempting to answer investors' most concerned question:
"Which is the better buy right now?"
I. Historical Price Comparison and Current Market Status
SWGT and UNI Historical Price Trends
- 2024: SWGT reached $0.577 on August 16, 2024, marking a notable price level during its early trading period.
- 2021: UNI was influenced by the launch of Uniswap V3 on May 5, 2021, with its price reaching $44.92 on May 3, 2021.
- Comparative Analysis: During market cycles, SWGT declined from $0.577 to $0.01601, while UNI experienced a decrease from $44.92 to $1.03 during its trading history.
Current Market Status (February 2, 2026)
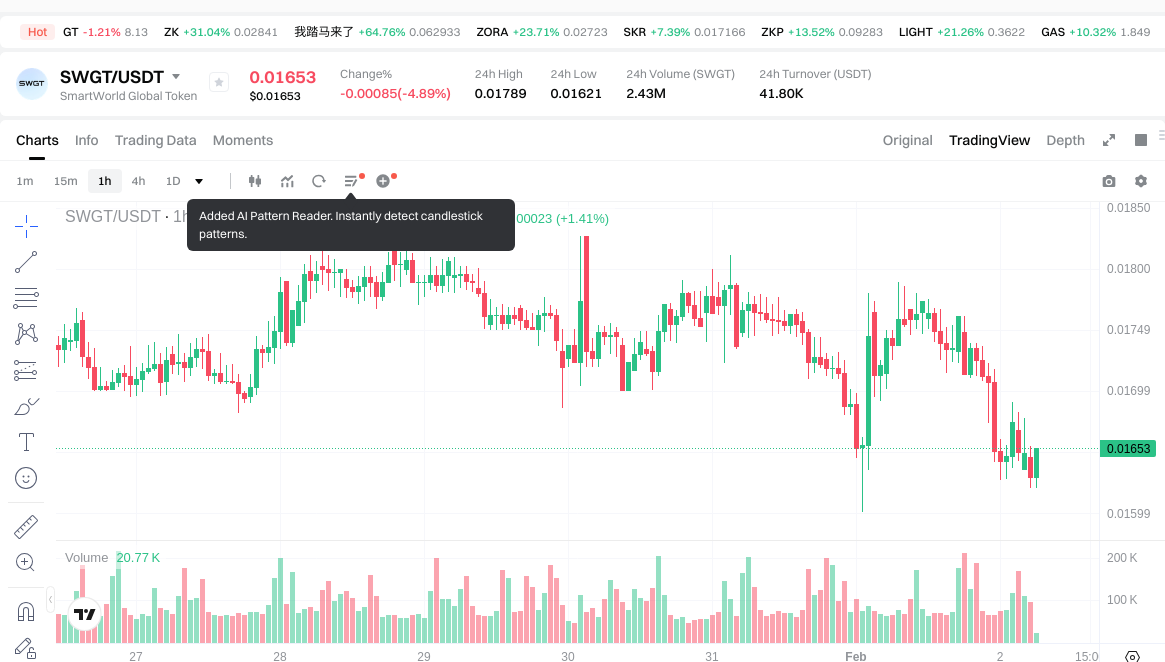
- SWGT Current Price: $0.01628
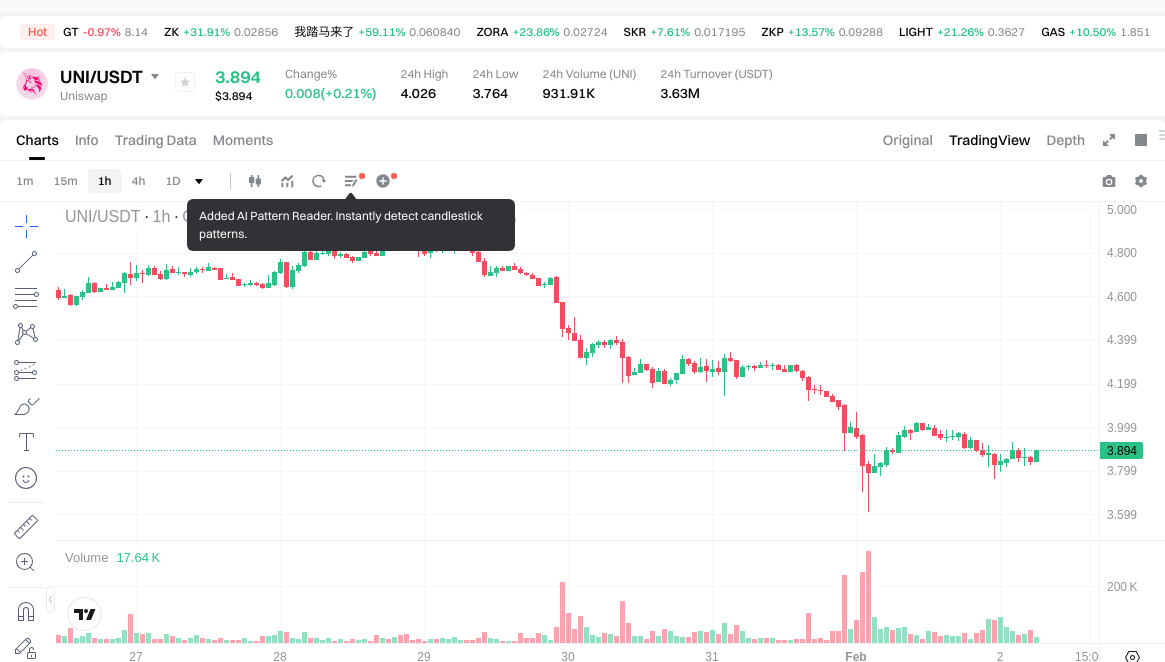
- UNI Current Price: $3.859
- 24-hour Trading Volume: SWGT $41,735.65 vs UNI $3,612,766.08
- Market Sentiment Index (Fear & Greed Index): 14 (Extreme Fear)
View real-time prices:
II. Core Factors Influencing SWGT vs UNI Investment Value
Supply Mechanism Comparison (Tokenomics)
- SWGT: The investment value is influenced by its supply mechanism and scarcity features, which play a role in determining market dynamics and potential price movements.
- UNI: The token's value is affected by its scarcity model, alongside factors such as institutional participation and broader market trends that shape its supply-demand balance.
- 📌 Historical Pattern: Supply mechanisms have historically driven cyclical price patterns, with scarcity-based models often correlating with valuation shifts during different market phases.
Institutional Adoption and Market Application
- Institutional Holdings: Both SWGT and UNI have attracted attention from institutional participants, though the degree and nature of institutional involvement may vary based on their respective market positioning and utility propositions.
- Market Trends Impact: Institutional participation levels and evolving market trends serve as significant indicators for both tokens' investment prospects, particularly in the context of broader crypto market developments.
III. 2026-2031 Price Prediction: SWGT vs UNI
Short-term Prediction (2026)
- SWGT: Conservative $0.0150 - $0.0165 | Optimistic $0.0165 - $0.0205
- UNI: Conservative $2.02 - $3.89 | Optimistic $3.89 - $4.47
Mid-term Prediction (2028-2029)
- SWGT may enter a consolidation phase with projected price range of $0.0116 - $0.0257
- UNI may enter a growth phase with projected price range of $2.85 - $5.94
- Key drivers: institutional capital inflows, ETF developments, ecosystem expansion
Long-term Prediction (2031)
- SWGT: Baseline scenario $0.0217 - $0.0255 | Optimistic scenario $0.0255 - $0.0334
- UNI: Baseline scenario $5.89 - $6.40 | Optimistic scenario $6.40 - $6.59
View detailed price predictions for SWGT and UNI
Disclaimer
SWGT:
| Year |
Predicted High Price |
Predicted Average Price |
Predicted Low Price |
Price Change |
| 2026 |
0.0204972 |
0.01653 |
0.0150423 |
1 |
| 2027 |
0.019069008 |
0.0185136 |
0.013700064 |
13 |
| 2028 |
0.02574408648 |
0.018791304 |
0.01747591272 |
15 |
| 2029 |
0.024494464764 |
0.02226769524 |
0.0115792015248 |
36 |
| 2030 |
0.02758967440236 |
0.023381080002 |
0.02127678280182 |
43 |
| 2031 |
0.033385844134855 |
0.02548537720218 |
0.021662570621853 |
56 |
UNI:
| Year |
Predicted High Price |
Predicted Average Price |
Predicted Low Price |
Price Change |
| 2026 |
4.47005 |
3.887 |
2.02124 |
0 |
| 2027 |
4.47102175 |
4.178525 |
3.844243 |
8 |
| 2028 |
5.49246218625 |
4.324773375 |
2.8543504275 |
12 |
| 2029 |
5.93942751455625 |
4.908617780625 |
4.46684218036875 |
27 |
| 2030 |
7.37667080072325 |
5.424022647590625 |
4.990100835783375 |
40 |
| 2031 |
6.592357125881645 |
6.400346724156937 |
5.888318986224382 |
65 |
IV. Investment Strategy Comparison: SWGT vs UNI
Long-term vs Short-term Investment Strategies
- SWGT: May be considered by investors exploring emerging utility tokens within blockchain-based product ecosystems, particularly those interested in transportation, logistics, and decentralized marketplace applications
- UNI: May be considered by investors seeking exposure to established decentralized exchange governance tokens with broader market recognition and institutional participation
Risk Management and Asset Allocation
- Conservative Investors: SWGT 20-30% vs UNI 70-80%
- Aggressive Investors: SWGT 40-50% vs UNI 50-60%
- Hedging Tools: Stablecoin allocation, options strategies, cross-token portfolio diversification
V. Potential Risk Comparison
Market Risks
- SWGT: Trading volume of $41,735.65 reflects lower liquidity conditions, which may result in higher price volatility and potential slippage during transactions
- UNI: Trading volume of $3,612,766.08 indicates higher liquidity, though remains subject to broader market sentiment shifts and DeFi sector volatility
Technical Risks
- SWGT: Scalability considerations related to ecosystem expansion, network stability during early-stage development phases
- UNI: Protocol upgrade implementation risks, potential smart contract vulnerabilities, dependency on Ethereum network performance
Regulatory Risks
- Global regulatory developments may impact both tokens differently based on their functional classifications—utility tokens versus governance tokens—and jurisdictional approaches to DeFi protocols and blockchain-based services
VI. Conclusion: Which Is the Better Buy?
📌 Investment Value Summary:
- SWGT Characteristics: Early-stage positioning in blockchain utility ecosystem with focus on transportation, logistics, and decentralized marketplace applications; lower current market price point at $0.01628
- UNI Characteristics: Established governance token for widely-adopted decentralized exchange protocol; higher liquidity with $3,612,766.08 in 24-hour trading volume; broader institutional recognition
✅ Investment Considerations:
- Novice Investors: May consider starting with UNI due to higher liquidity and established market presence, allowing for easier entry and exit positions
- Experienced Investors: Could evaluate portfolio allocation between both tokens based on risk tolerance, with UNI serving as core holding and SWGT as speculative position
- Institutional Investors: May prioritize UNI for governance participation in DeFi protocols and established market infrastructure, while monitoring SWGT ecosystem development
⚠️ Risk Disclaimer: The cryptocurrency market exhibits high volatility. This content does not constitute investment advice.
VII. FAQ
Q1: What is the main difference between SWGT and UNI tokens?
SWGT is a utility token focused on blockchain-based transportation, logistics, and decentralized marketplace applications, while UNI is a governance token for the Uniswap decentralized exchange protocol. SWGT launched in 2024 as part of an emerging ecosystem with a current price of $0.01628 and lower trading volume ($41,735.65), whereas UNI has been operational since 2020, trades at $3.859, and demonstrates significantly higher liquidity with $3,612,766.08 in 24-hour trading volume.
Q2: Which token offers better liquidity for trading?
UNI offers substantially better liquidity with a 24-hour trading volume of $3,612,766.08 compared to SWGT's $41,735.65. This higher liquidity means UNI traders typically experience lower slippage, faster order execution, and easier entry/exit positions. SWGT's lower trading volume may result in higher price volatility and potential difficulties when executing larger trades, making it more suitable for investors comfortable with early-stage token dynamics.
Q3: What are the price predictions for SWGT and UNI through 2031?
For 2026, SWGT is projected to range between $0.0150-$0.0205 (optimistic scenario), while UNI is forecasted at $2.02-$4.47. By 2031, SWGT's baseline scenario suggests $0.0217-$0.0255 with an optimistic range up to $0.0334, whereas UNI's baseline projects $5.89-$6.40 with potential to reach $6.59. These predictions incorporate factors such as institutional adoption, ecosystem development, and broader market cycles, though actual performance may vary significantly based on market conditions.
Q4: How should investors allocate between SWGT and UNI?
Conservative investors may consider a 20-30% SWGT and 70-80% UNI allocation, prioritizing the established protocol with higher liquidity. Aggressive investors comfortable with higher risk could allocate 40-50% to SWGT and 50-60% to UNI, capturing potential upside from SWGT's early-stage development while maintaining exposure to UNI's proven market position. Portfolio allocation should align with individual risk tolerance, investment timeline, and market outlook, with consideration for stablecoin reserves and diversification across other crypto assets.
Q5: What are the primary risks associated with investing in SWGT versus UNI?
SWGT faces higher liquidity risk due to lower trading volumes, potential scalability challenges during ecosystem expansion, and uncertainties inherent in early-stage token development. UNI's risks include protocol upgrade implementation challenges, smart contract vulnerabilities, dependency on Ethereum network performance, and broader DeFi sector volatility. Both tokens are subject to regulatory developments that may impact utility tokens and governance tokens differently based on jurisdictional approaches to blockchain-based services and decentralized protocols.
Q6: Is SWGT suitable for novice cryptocurrency investors?
SWGT may present challenges for novice investors due to its lower liquidity ($41,735.65 daily volume), higher volatility potential, and early-stage ecosystem development status. Beginners typically benefit from starting with more established tokens like UNI, which offers easier entry/exit points, broader market recognition, and more extensive educational resources. Investors new to cryptocurrency should prioritize understanding market fundamentals, risk management principles, and portfolio diversification before considering exposure to emerging tokens like SWGT.
Q7: How do institutional adoption levels differ between SWGT and UNI?
UNI has achieved broader institutional recognition and participation due to its established position as a governance token for one of the largest decentralized exchanges, with institutional investors utilizing it for DeFi protocol governance and infrastructure exposure. SWGT, launched in 2024, is in earlier stages of institutional adoption, though it has attracted attention from participants interested in blockchain-based transportation, logistics, and marketplace applications. The degree of institutional involvement serves as a significant indicator for both tokens' market stability and long-term investment prospects.
Q8: What market conditions would favor SWGT over UNI performance?
SWGT may outperform during periods of strong interest in utility tokens, successful ecosystem expansion in transportation and logistics sectors, or increased adoption of its decentralized marketplace platform. Market conditions favoring early-stage projects with specific use cases, rather than established DeFi protocols, could benefit SWGT's relative performance. Conversely, UNI typically performs well during DeFi sector growth, Ethereum network upgrades, increased decentralized exchange volume, and periods when institutional investors favor established governance tokens with proven track records.
* The information is not intended to be and does not constitute financial advice or any other recommendation of any sort offered or endorsed by Gate.