This comprehensive analysis examines TRC and RUNE tokens, two distinct blockchain assets with different market positioning and investment profiles. TRC, launched February 2025, functions as a next-generation self-custodial crypto trading terminal aggregating liquidity across CEX, DEX, and OTC markets at $0.0076. RUNE, established 2019, operates as an optimized multi-chain protocol enabling cross-chain transactions through pBFT consensus at $0.4655. The article compares historical price trends, market maturity, liquidity depth, technical architectures, and risk factors across multiple timeframes. TRC offers early-stage growth potential but faces liquidity constraints and volatility, while RUNE provides established infrastructure with superior trading volume ($706,507 vs $4,971 daily) and operational history. Detailed investment recommendations address conservative, aggressive, and institutional investor profiles, incorporating tokenomics analysis, regulatory considerations, and portfolio allocation strategies
Introduction: TRC vs RUNE Investment Comparison
In the cryptocurrency market, the comparison between TRC and RUNE remains a focal point for investors. These two assets exhibit notable differences in market cap ranking, application scenarios, and price performance, representing distinct positioning within the crypto asset landscape.
TRC (Terrace): Launched in 2025, it has gained market attention through its positioning as a next-generation self-custodial crypto trading terminal and broker, aggregating liquidity from CEX, DEX, market makers, and OTC desks.
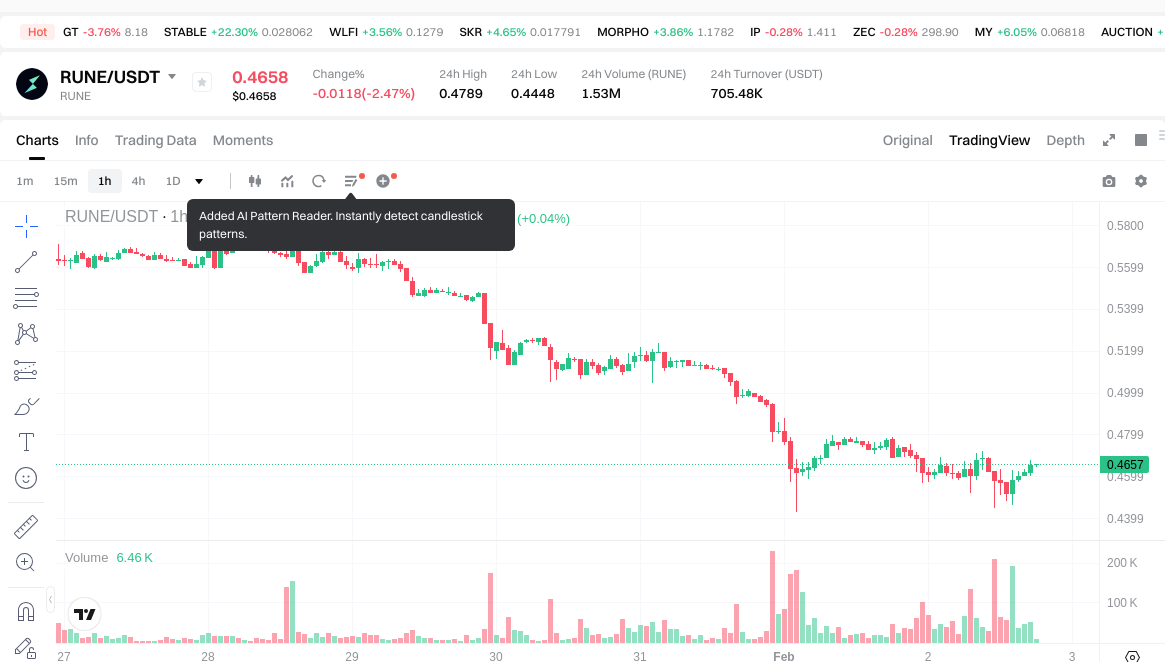
RUNE (THORChain): Since its launch in 2019, it has been recognized as a highly optimized multi-chain protocol utilizing pBFT consensus, facilitating cross-chain transactions and order matching at the protocol level.
This article will provide a comprehensive analysis of the TRC vs RUNE investment value comparison, focusing on historical price trends, supply mechanisms, institutional adoption, technical ecosystems, and future projections, while attempting to address the question investors care about most:
"Which is the better buy right now?"
I. Historical Price Comparison and Current Market Status
Historical Price Trends of TRC (Coin A) and RUNE (Coin B)
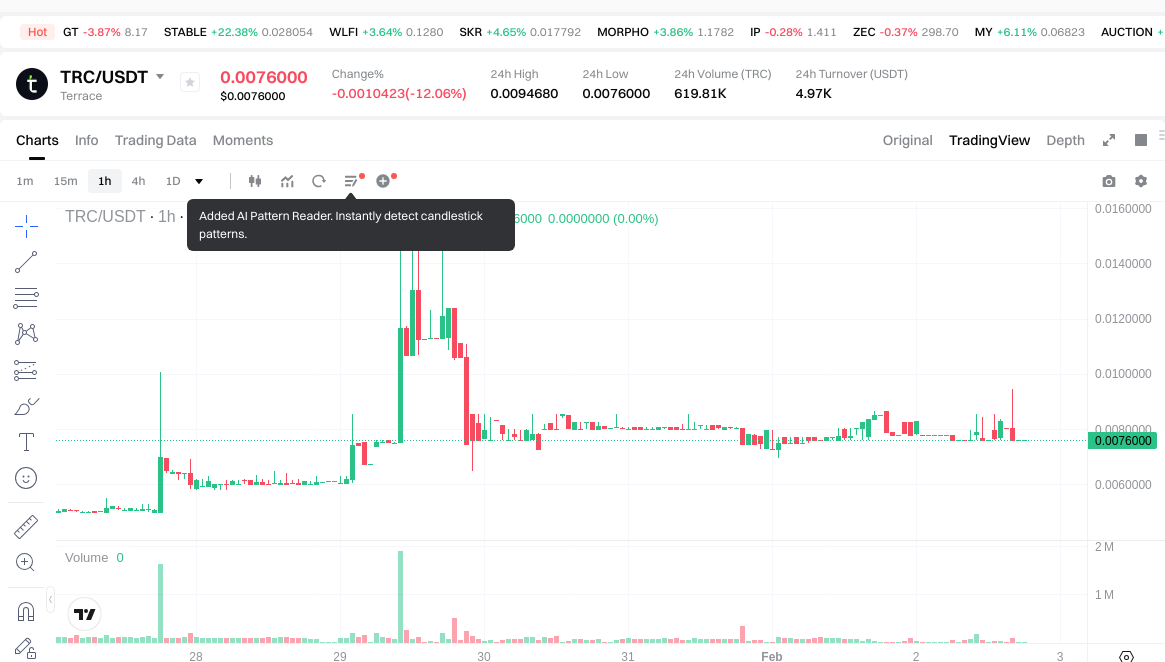
- 2025: TRC experienced significant volatility following its listing on February 9, 2025, with the price reaching an all-time high of $0.03089 on March 12, 2025, before declining substantially.
- 2021: RUNE achieved its all-time high of $20.87 on May 19, 2021, during the broader cryptocurrency market expansion, followed by a prolonged decline.
- Comparative analysis: During the recent market cycle, TRC declined from its peak of $0.03089 to a low of $0.001399 (recorded on April 11, 2025), representing a substantial correction. In contrast, RUNE has experienced an extended downtrend from its 2021 peak, with the current price showing a decline of approximately 60.09% over the past year.
Current Market Status (February 2, 2026)
- TRC current price: $0.0076
- RUNE current price: $0.4655
- 24-hour trading volume: TRC at $4,971.41 vs RUNE at $706,507.96
- Market sentiment index (Fear & Greed Index): 14 (Extreme Fear)
Check real-time prices:
II. Core Factors Influencing TRC vs RUNE Investment Value
Supply Mechanism Comparison (Tokenomics)
The provided materials do not contain specific information regarding the supply mechanisms, tokenomics models, or issuance schedules for TRC and RUNE. Without detailed data on whether these assets employ fixed supply models, deflationary mechanisms, halving events, or other supply-related features, a comparative analysis cannot be conducted.
Institutional Adoption and Market Application
The reference materials primarily discuss TRC as a consulting and engineering firm rather than a crypto asset, and do not provide information on institutional holdings, enterprise adoption patterns, or regulatory stances toward TRC or RUNE as digital assets. Data on institutional investment preferences, cross-border payment applications, settlement systems, or portfolio integration for these tokens is not available in the provided sources.
Technology Development and Ecosystem Building
No specific information regarding technology upgrades, protocol improvements, or ecosystem developments for TRC or RUNE is present in the reference materials. Comparative analysis of their respective positions in DeFi protocols, NFT marketplaces, payment systems, or smart contract implementations cannot be performed based on the available data.
Macroeconomic Conditions and Market Cycles
The provided materials do not contain data on how TRC or RUNE perform under varying macroeconomic conditions, including inflationary environments, monetary policy changes, interest rate fluctuations, or U.S. dollar index movements. Information regarding their behavior during different market cycles or their sensitivity to geopolitical factors and cross-border transaction demand is not available in the reference sources.
III. 2026-2031 Price Prediction: TRC vs RUNE
Short-term Forecast (2026)
- TRC: Conservative $0.00456 - $0.0076 | Optimistic $0.0076 - $0.007828
- RUNE: Conservative $0.284016 - $0.4656 | Optimistic $0.4656 - $0.51216
Mid-term Forecast (2028-2029)
- TRC may enter a gradual growth phase, with estimated price range of $0.004720968 - $0.0114876888 in 2028 and $0.006581029392 - $0.01306527894 in 2029
- RUNE may enter a consolidation phase, with estimated price range of $0.469251468 - $0.66622122 in 2028 and $0.4857621678 - $0.6912769311 in 2029
- Key drivers: institutional capital flows, ETF developments, ecosystem expansion
Long-term Forecast (2031)
- TRC: Baseline scenario $0.012107376239049 - $0.0133048090539 | Optimistic scenario $0.0133048090539 - $0.017562347951148
- RUNE: Baseline scenario $0.611065608835027 - $0.68659057172475 | Optimistic scenario $0.68659057172475 - $0.79644506320071
View detailed price predictions for TRC and RUNE
Disclaimer
TRC:
| Year |
Predicted High Price |
Predicted Average Price |
Predicted Low Price |
Price Change |
| 2026 |
0.007828 |
0.0076 |
0.00456 |
0 |
| 2027 |
0.00802256 |
0.007714 |
0.0057855 |
1 |
| 2028 |
0.0114876888 |
0.00786828 |
0.004720968 |
3 |
| 2029 |
0.01306527894 |
0.0096779844 |
0.006581029392 |
27 |
| 2030 |
0.0152379864378 |
0.01137163167 |
0.0095521706028 |
49 |
| 2031 |
0.017562347951148 |
0.0133048090539 |
0.012107376239049 |
75 |
RUNE:
| Year |
Predicted High Price |
Predicted Average Price |
Predicted Low Price |
Price Change |
| 2026 |
0.51216 |
0.4656 |
0.284016 |
0 |
| 2027 |
0.6697656 |
0.48888 |
0.4448808 |
5 |
| 2028 |
0.66622122 |
0.5793228 |
0.469251468 |
24 |
| 2029 |
0.6912769311 |
0.62277201 |
0.4857621678 |
33 |
| 2030 |
0.7161566728995 |
0.65702447055 |
0.3350824799805 |
41 |
| 2031 |
0.79644506320071 |
0.68659057172475 |
0.611065608835027 |
47 |
IV. Investment Strategy Comparison: TRC vs RUNE
Long-term vs Short-term Investment Strategies
- TRC: May appeal to investors focused on emerging trading infrastructure opportunities and early-stage ecosystem participation, given its recent market entry in 2025 and positioning as a next-generation self-custodial trading terminal.
- RUNE: May suit investors seeking exposure to established cross-chain protocol infrastructure, given its operational history since 2019 and role in facilitating multi-chain transactions through optimized protocol-level architecture.
Risk Management and Asset Allocation
- Conservative investors: TRC 15-20% vs RUNE 25-30%
- Aggressive investors: TRC 30-40% vs RUNE 35-45%
- Hedging instruments: stablecoin allocation, options strategies, cross-asset portfolio diversification
V. Comparative Risk Analysis
Market Risk
- TRC: Exposure to liquidity constraints, as evidenced by 24-hour trading volume of $4,971.41, combined with substantial historical volatility following its February 2025 listing, including declines from $0.03089 to $0.001399 within the initial trading period.
- RUNE: Subject to extended market cycle fluctuations, with approximately 60.09% decline over the past year and current trading at $0.4655 compared to its 2021 peak of $20.87, reflecting sensitivity to broader cryptocurrency market conditions and the current Extreme Fear sentiment environment (Fear & Greed Index: 14).
Technical Risk
- TRC: Scalability considerations and network stability factors associated with liquidity aggregation across CEX, DEX, market makers, and OTC desks platforms.
- RUNE: Protocol-level operational considerations related to cross-chain transaction processing and pBFT consensus mechanism implementation.
Regulatory Risk
- Differential regulatory treatment may affect TRC and RUNE depending on jurisdictional classification of trading infrastructure versus cross-chain protocol services, with evolving global regulatory frameworks potentially impacting operational parameters and market access for both assets.
VI. Conclusion: Which Is the Better Buy?
📌 Investment Value Summary:
- TRC advantages: Positioning within next-generation trading infrastructure aggregation, relatively recent market entry offering potential early-stage participation opportunities, and current price point of $0.0076 following substantial correction from initial trading highs.
- RUNE advantages: Established operational history since 2019 within cross-chain protocol infrastructure, optimized multi-chain transaction capabilities through pBFT consensus implementation, and higher 24-hour trading volume of $706,507.96 indicating greater market liquidity depth.
✅ Investment Recommendations:
- Novice investors: Consider balanced exposure with emphasis on established protocols demonstrating operational track records, while maintaining conservative position sizing given current Extreme Fear market sentiment and substantial historical volatility in both assets.
- Experienced investors: Evaluate differentiated allocation strategies based on individual risk tolerance, with consideration for TRC's emerging infrastructure positioning versus RUNE's established cross-chain protocol role, while implementing appropriate hedging mechanisms including stablecoin reserves and portfolio diversification.
- Institutional investors: Assess infrastructure compatibility requirements, liquidity depth considerations, and regulatory framework alignment, with potential for phased allocation strategies reflecting varying operational maturity levels and market positioning of both assets.
⚠️ Risk Disclosure: Cryptocurrency markets exhibit significant volatility characteristics. This analysis does not constitute investment advice.
VII. FAQ
Q1: What are the key differences in market maturity between TRC and RUNE?
RUNE demonstrates significantly greater market maturity with a 7-year operational history since 2019, while TRC remains in early-stage development following its February 2025 launch. RUNE's established track record is reflected in substantially higher 24-hour trading volume ($706,507.96 versus TRC's $4,971.41), indicating deeper liquidity and broader market acceptance. Additionally, RUNE's infrastructure has undergone multiple market cycles, including the 2021 peak period, providing historical performance data across varying market conditions. TRC's limited operational history presents both higher uncertainty and potential early-stage growth opportunities for investors willing to accept elevated risk profiles.
Q2: How do the price volatility patterns differ between TRC and RUNE?
TRC exhibits extreme short-term volatility, declining approximately 95.47% from its March 2025 peak of $0.03089 to its April 2025 low of $0.001399 within a two-month period. RUNE demonstrates lower relative volatility but extended downtrend characteristics, declining approximately 60.09% over the past year and approximately 97.77% from its 2021 all-time high of $20.87 to current levels of $0.4655. TRC's volatility reflects typical early-stage asset behavior with limited liquidity depth, while RUNE's volatility correlates more closely with broader cryptocurrency market cycles and the current Extreme Fear sentiment environment (Fear & Greed Index: 14).
Q3: Which asset offers better liquidity for institutional investors?
RUNE provides substantially superior liquidity conditions for institutional participants, demonstrated by 24-hour trading volume exceeding $706,000 compared to TRC's approximately $5,000. This 142-fold difference in trading volume indicates RUNE's capacity to accommodate larger order sizes with reduced slippage impact and more efficient price discovery mechanisms. Institutional investors typically require minimum liquidity thresholds to execute position sizing strategies without significant market impact—RUNE's volume profile meets these requirements while TRC's current liquidity constraints may restrict institutional participation until ecosystem development progresses and market depth increases.
Q4: How do the projected returns compare over different time horizons?
Short-term projections (2026) indicate RUNE's optimistic scenario reaching $0.51216 (9.97% potential upside from current $0.4655), while TRC's optimistic scenario projects $0.007828 (3.00% potential upside from current $0.0076). Mid-term forecasts (2028-2029) suggest TRC may deliver higher percentage returns from a lower base, with 2029 optimistic projections indicating approximately 71.93% growth potential, compared to RUNE's approximately 48.51% growth potential over the same period. Long-term projections (2031) estimate TRC baseline scenarios reaching $0.012107 (59.30% from current levels) versus RUNE's $0.6111 (31.26% from current levels), though these projections carry substantial uncertainty given cryptocurrency market volatility and limited historical data for TRC.
Q5: What portfolio allocation strategy is appropriate for conservative versus aggressive investors?
Conservative investors should consider limiting combined exposure to 40-50% of crypto portfolio allocation, with RUNE receiving higher weighting (25-30%) due to established infrastructure and superior liquidity, while TRC allocation remains constrained (15-20%) reflecting early-stage risks and liquidity limitations. Aggressive investors may increase combined exposure to 65-85% of crypto portfolios, with more balanced allocation between TRC (30-40%) and RUNE (35-45%), accepting higher volatility in exchange for potential early-stage growth capture. Both strategies require complementary hedging through stablecoin reserves (minimum 20-30% of crypto holdings), options strategies for downside protection, and cross-asset diversification to mitigate concentrated cryptocurrency market risk during the current Extreme Fear sentiment environment.
Q6: How do the technical architectures influence long-term investment value?
RUNE's technical architecture utilizing pBFT consensus and optimized multi-chain protocol infrastructure provides established cross-chain transaction capabilities, positioning it within the growing interoperability segment of blockchain infrastructure. This protocol-level functionality addresses persistent liquidity fragmentation challenges across blockchain ecosystems, creating potential long-term utility value. TRC's positioning as a liquidity aggregation terminal consolidating CEX, DEX, market maker, and OTC desk access addresses trading infrastructure efficiency but operates at the application layer rather than protocol level. The architectural distinction suggests RUNE may capture value through foundational infrastructure positioning, while TRC's value proposition depends on user adoption within the competitive trading terminal landscape—each approach presents different risk-return profiles for long-term investment consideration.
Q7: What macroeconomic factors should investors monitor when holding TRC versus RUNE?
Investors should monitor broader cryptocurrency market sentiment indicators, particularly the Fear & Greed Index (currently at 14, indicating Extreme Fear conditions), as both assets demonstrate correlation with overall market cycles. Regulatory developments affecting trading infrastructure and cross-chain protocols represent critical risk factors, with potential differential treatment based on jurisdictional classification of trading terminals versus protocol-layer services. Additionally, institutional adoption trends in DeFi infrastructure, liquidity aggregation services, and cross-chain interoperability solutions will influence long-term demand dynamics. Macroeconomic conditions including interest rate policies, inflation trends, and U.S. dollar strength affect cryptocurrency market liquidity flows—though specific sensitivity data for TRC and RUNE is limited, both assets likely exhibit typical cryptocurrency market correlations with these broader economic variables during their respective operational periods.
Q8: What are the primary risk factors that could significantly impact investment outcomes?
For TRC, primary risks include liquidity constraints (evidenced by low trading volume), early-stage operational uncertainty, extreme price volatility patterns, and competitive pressures within the trading terminal landscape. Regulatory classification uncertainty regarding liquidity aggregation services across multiple platform types presents additional risk. For RUNE, key risks encompass extended market cycle downtrends (60.09% annual decline), protocol-level technical implementation challenges, cross-chain security considerations inherent in multi-chain architectures, and sensitivity to broader DeFi adoption trends. Both assets face systemic cryptocurrency market risks including regulatory framework evolution, institutional participation trends, and macroeconomic conditions affecting digital asset valuations—the current Extreme Fear sentiment environment (Fear & Greed Index: 14) suggests elevated near-term volatility risk for both assets regardless of individual project fundamentals.
* The information is not intended to be and does not constitute financial advice or any other recommendation of any sort offered or endorsed by Gate.