


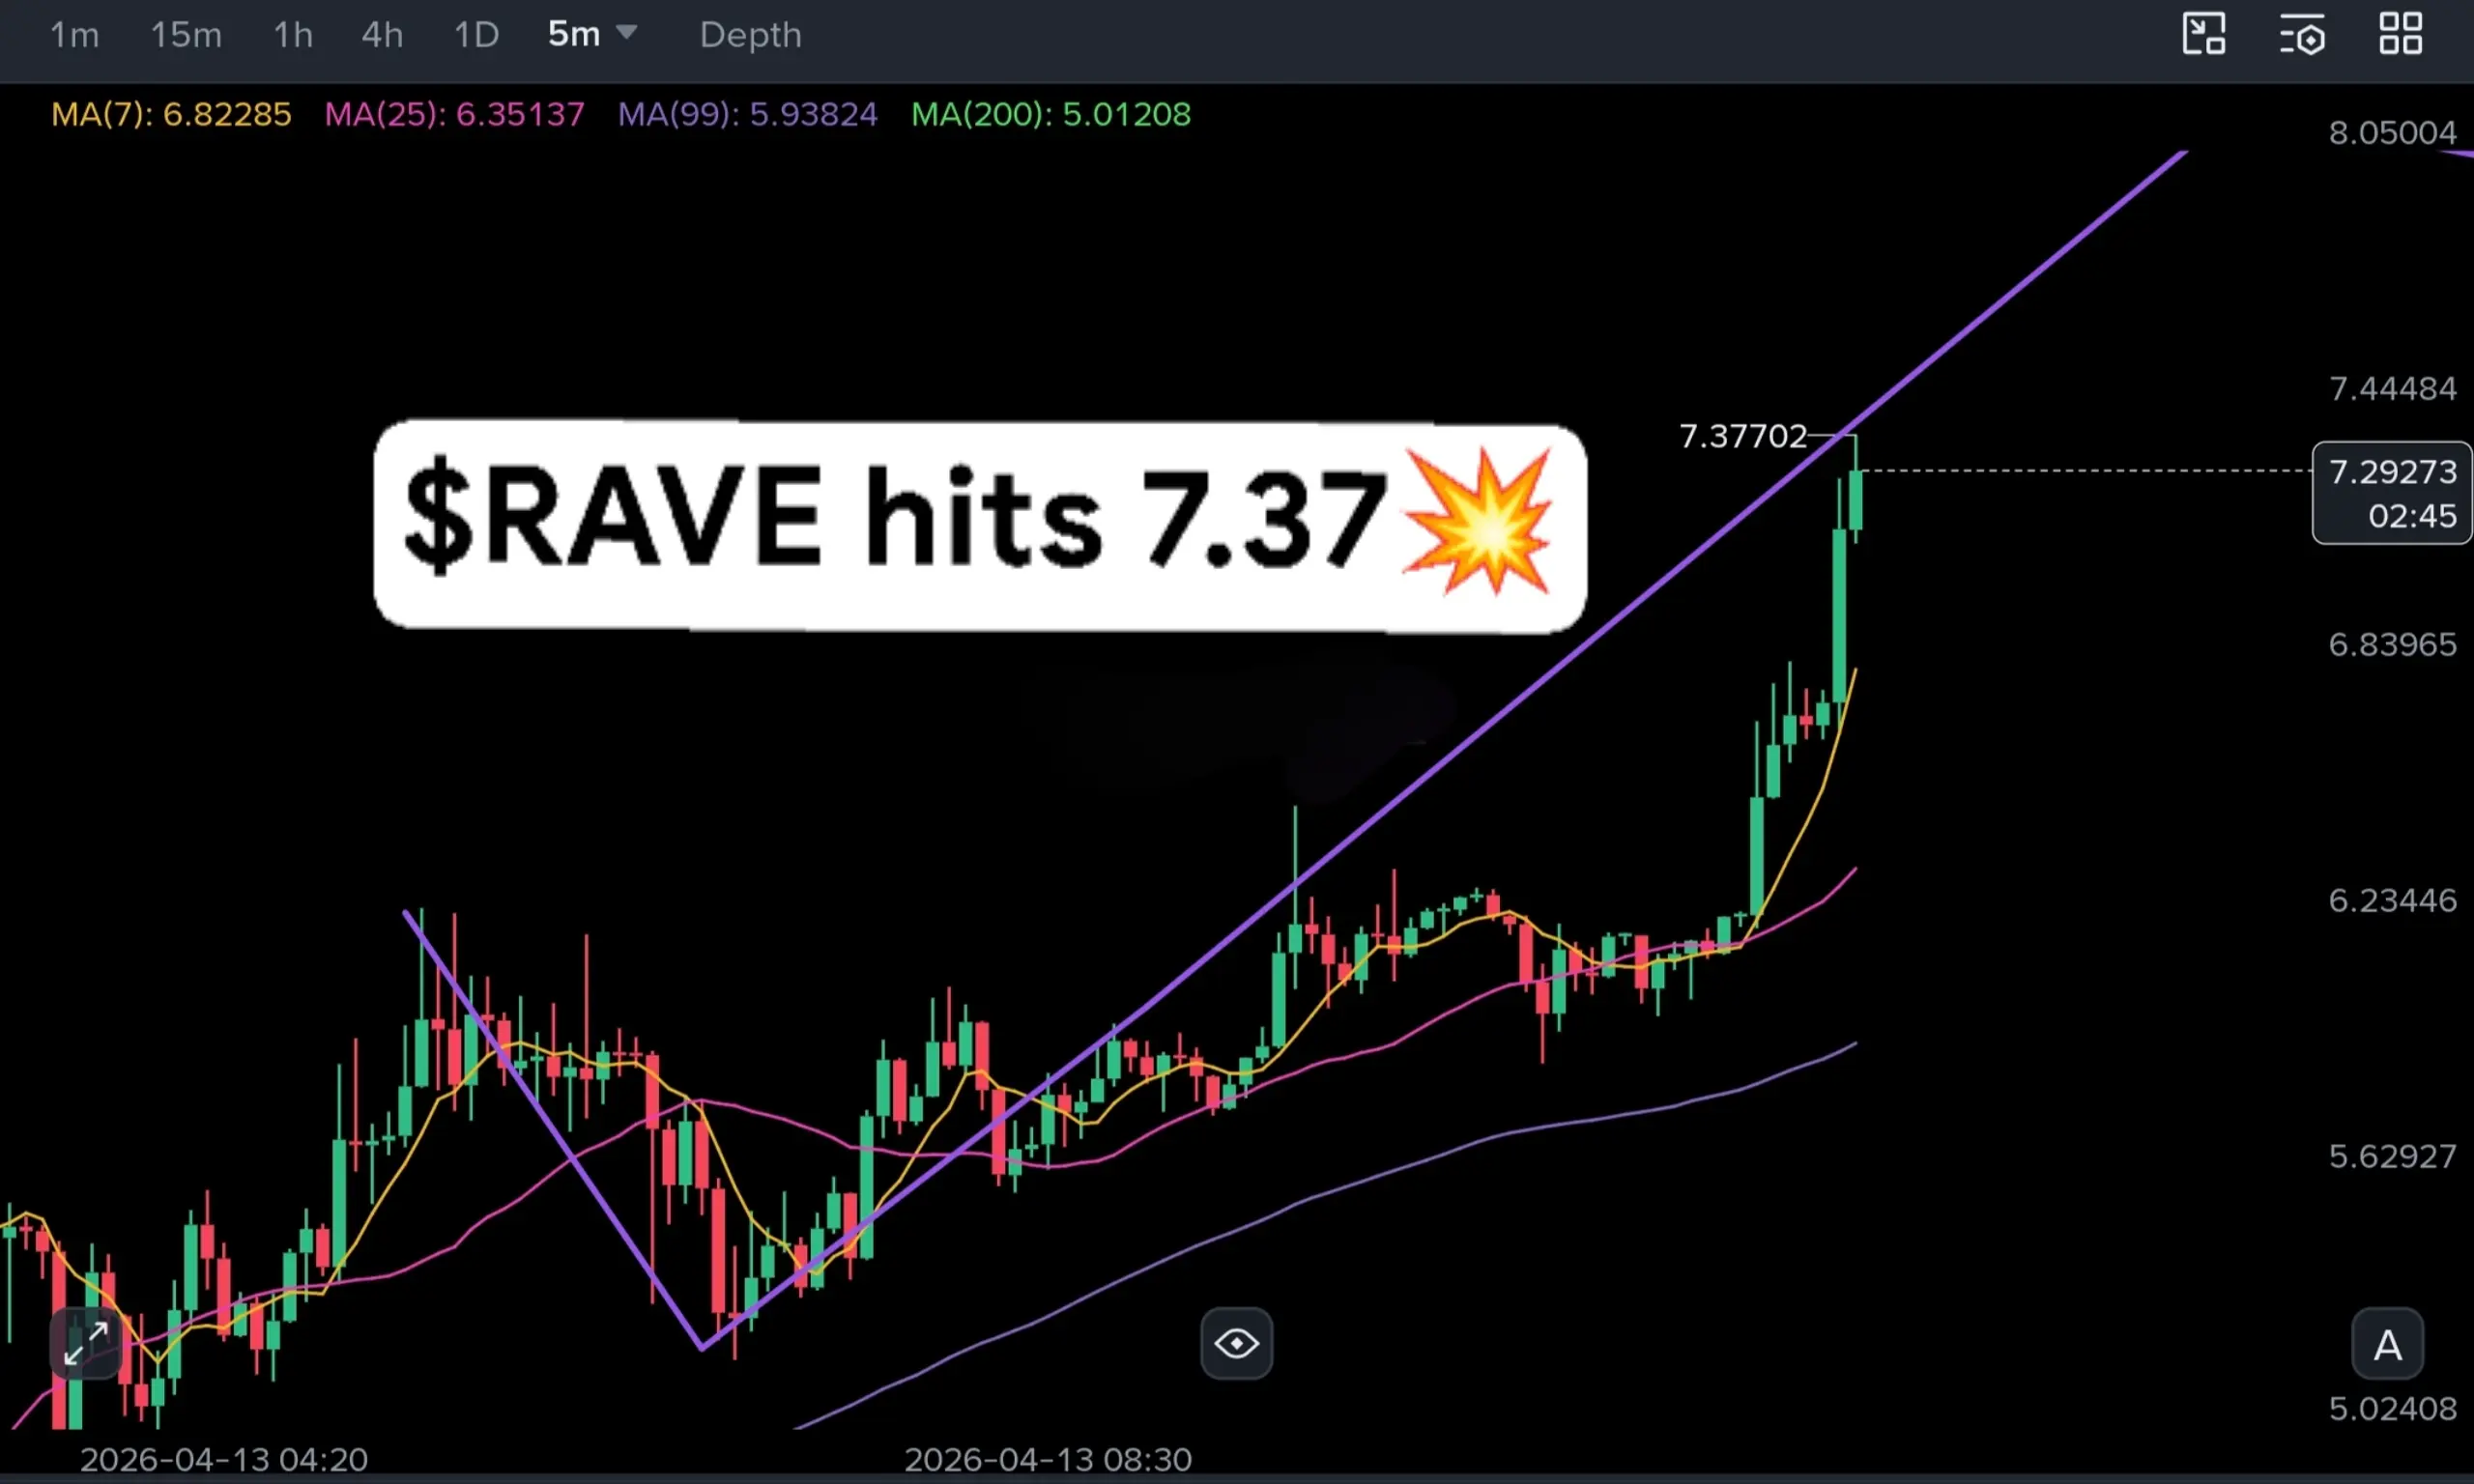
$RAVE WAVE TO $10 😱
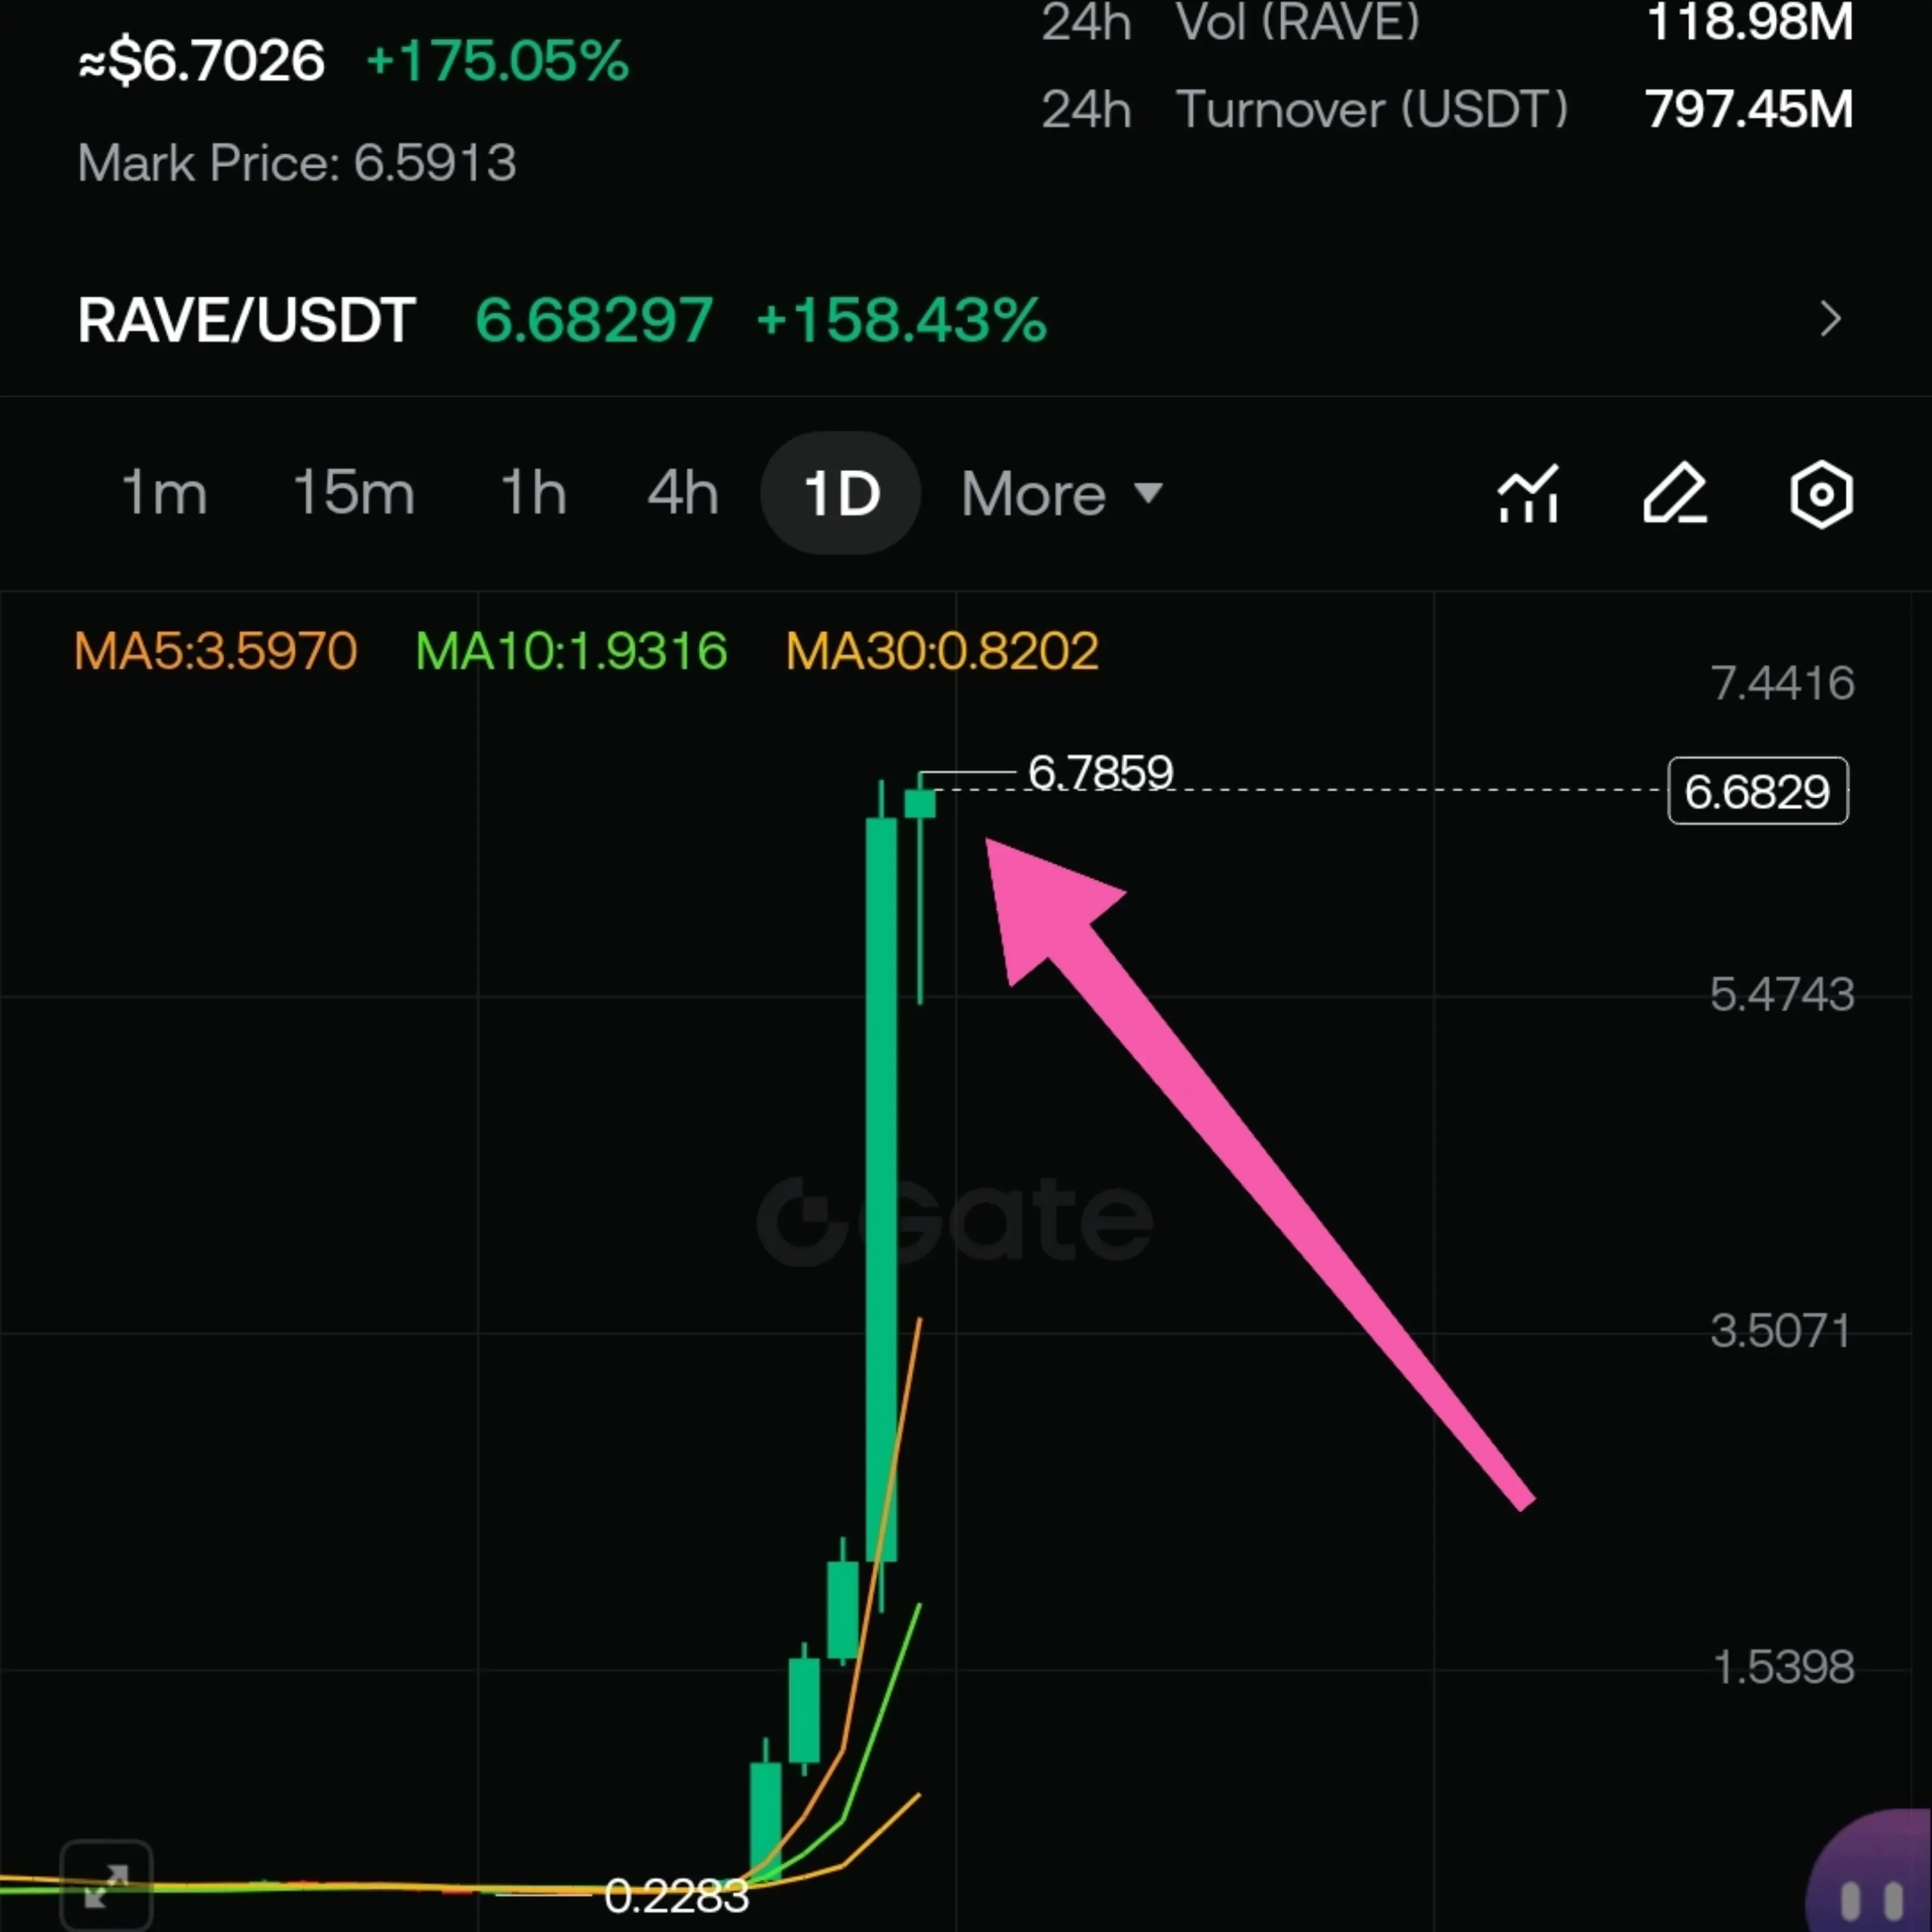
#RAVE has moved aggressively from the 1.86 zone to 6.25
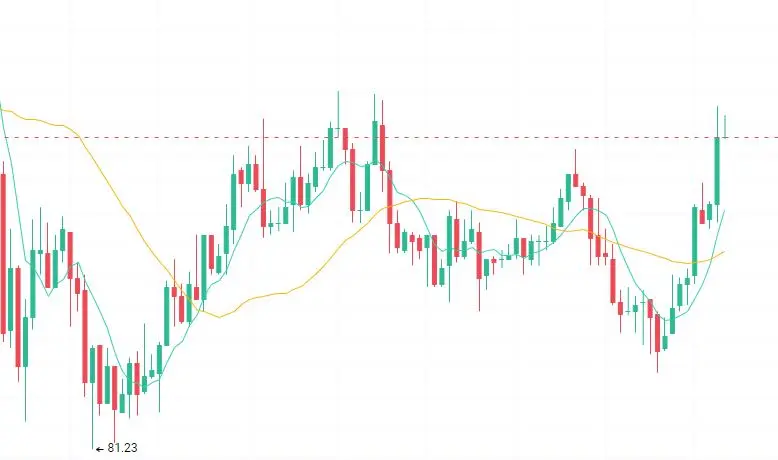
On both timeframes, the recent pullback looks controlled rather than weak.
After hitting 6.25, price corrected toward the 5.6–5.7 zone, which aligns closely with MA25 (≈5.67) and short-term structure support. Instead of breaking down, price stabilized and started forming higher lows — a typical sign of trend continuation rather than reversal.
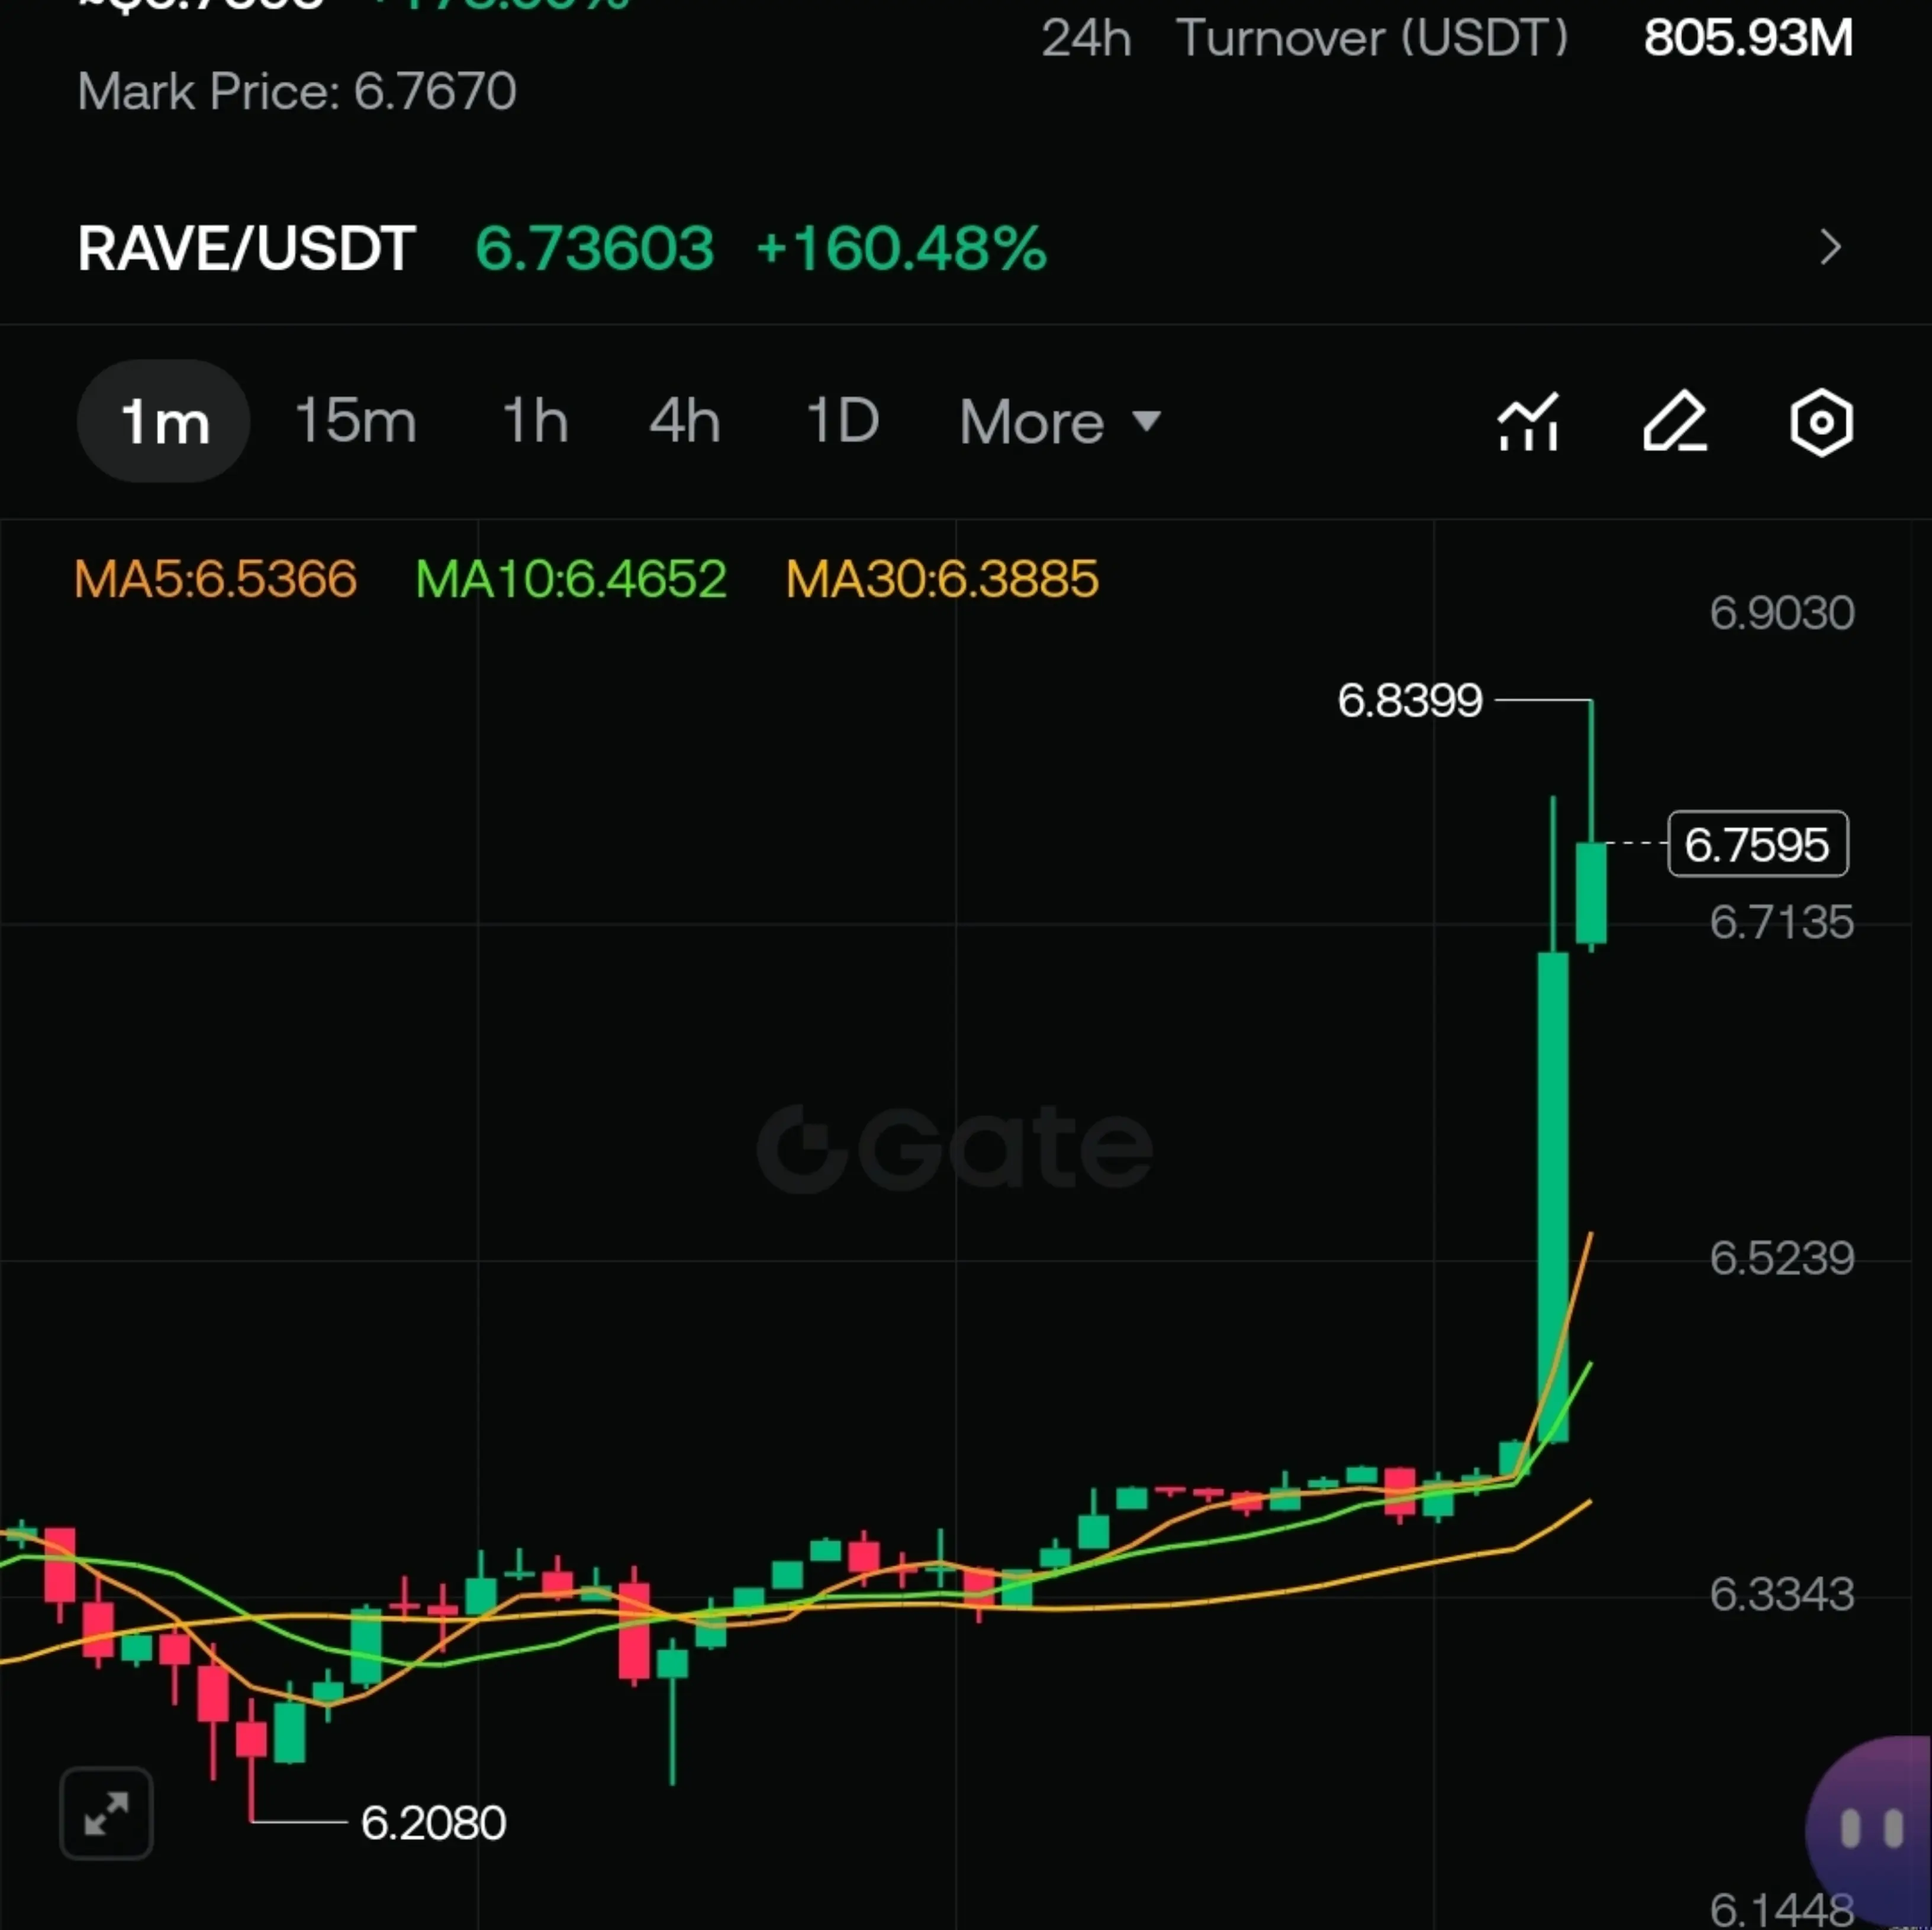
On the lower timeframe, the same structure is visible.
Price is holding above MA7 (≈5.84) and maintaining position above MA25, while the pullback didn’t reach deeper levels like MA99 (≈3.68). This tells us the correction remained shallow, meaning buyers are still in control.
Another important detail is positioning relative to higher MAs.
Price is far above MA200 (≈2.87), confirming that this is no longer an early breakout — it’s already in an established trend phase. In such conditions, pullbacks tend to be short-lived unless momentum weakens significantly.
Now coming to the key levels
• Immediate resistance remains at 6.25 — the recent high
• Holding above 5.6–5.7 keeps structure bullish
• Losing this zone opens room toward ~4.7–5.0 (deeper retrace)
If price reclaims and holds above 6.25, continuation toward the 7.5–8.5 zone becomes structurally reasonable before even thinking about higher projections.
The idea of a move toward 10 is not unrealistic — but it depends on one thing:
Sustained strength above current structure, not just momentum spikes.
Right now, the chart suggests this:
The correction looks complete in structure,
but confirmation comes only with a clean break above 6.25.
Until then, this is still a strong trend…
just transitioning between impulse and continuation.
#RAVE has moved aggressively from the 1.86 zone to 6.25
On both timeframes, the recent pullback looks controlled rather than weak.
After hitting 6.25, price corrected toward the 5.6–5.7 zone, which aligns closely with MA25 (≈5.67) and short-term structure support. Instead of breaking down, price stabilized and started forming higher lows — a typical sign of trend continuation rather than reversal.
On the lower timeframe, the same structure is visible.
Price is holding above MA7 (≈5.84) and maintaining position above MA25, while the pullback didn’t reach deeper levels like MA99 (≈3.68). This tells us the correction remained shallow, meaning buyers are still in control.
Another important detail is positioning relative to higher MAs.
Price is far above MA200 (≈2.87), confirming that this is no longer an early breakout — it’s already in an established trend phase. In such conditions, pullbacks tend to be short-lived unless momentum weakens significantly.
Now coming to the key levels
• Immediate resistance remains at 6.25 — the recent high
• Holding above 5.6–5.7 keeps structure bullish
• Losing this zone opens room toward ~4.7–5.0 (deeper retrace)
If price reclaims and holds above 6.25, continuation toward the 7.5–8.5 zone becomes structurally reasonable before even thinking about higher projections.
The idea of a move toward 10 is not unrealistic — but it depends on one thing:
Sustained strength above current structure, not just momentum spikes.
Right now, the chart suggests this:
The correction looks complete in structure,
but confirmation comes only with a clean break above 6.25.
Until then, this is still a strong trend…
just transitioning between impulse and continuation.