Solana (SOL) To Rise Higher? Key Harmonic Pattern Signals Potential Upside Move
Date: Fri, Dec 26, 2025 | 11:40 AM GMT
The broader cryptocurrency market is showing modest strength, with both Bitcoin (BTC) and Ethereum (ETH) trading in the green. This steady performance among the major assets has helped stabilize overall sentiment, allowing select altcoins — including** Solana (SOL) **— to begin showing constructive technical setups.
SOL is trading with a modest intraday gain, but more importantly, its price structure is starting to tell a much bigger story. The 4-hour chart reveals a well-defined harmonic pattern that suggests Solana may be preparing for another leg higher in the near term.
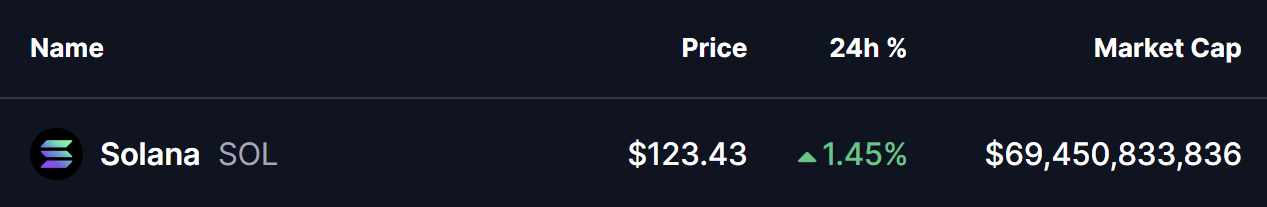
Source: Coinmarketcap
Bearish Bat Pattern in Play?
On the 4-hour timeframe, Solana appears to be forming a Bearish Bat harmonic pattern. While the name may sound negative, this structure typically allows for a bullish move toward the completion point (D) before any potential reversal takes place.
The pattern began at Point X near the $140.11 level, followed by a sharp decline toward Point A. From there, SOL rebounded to Point B before undergoing a deeper corrective move into Point C around $119.24. This zone acted as a key support area, where buyers stepped back in.
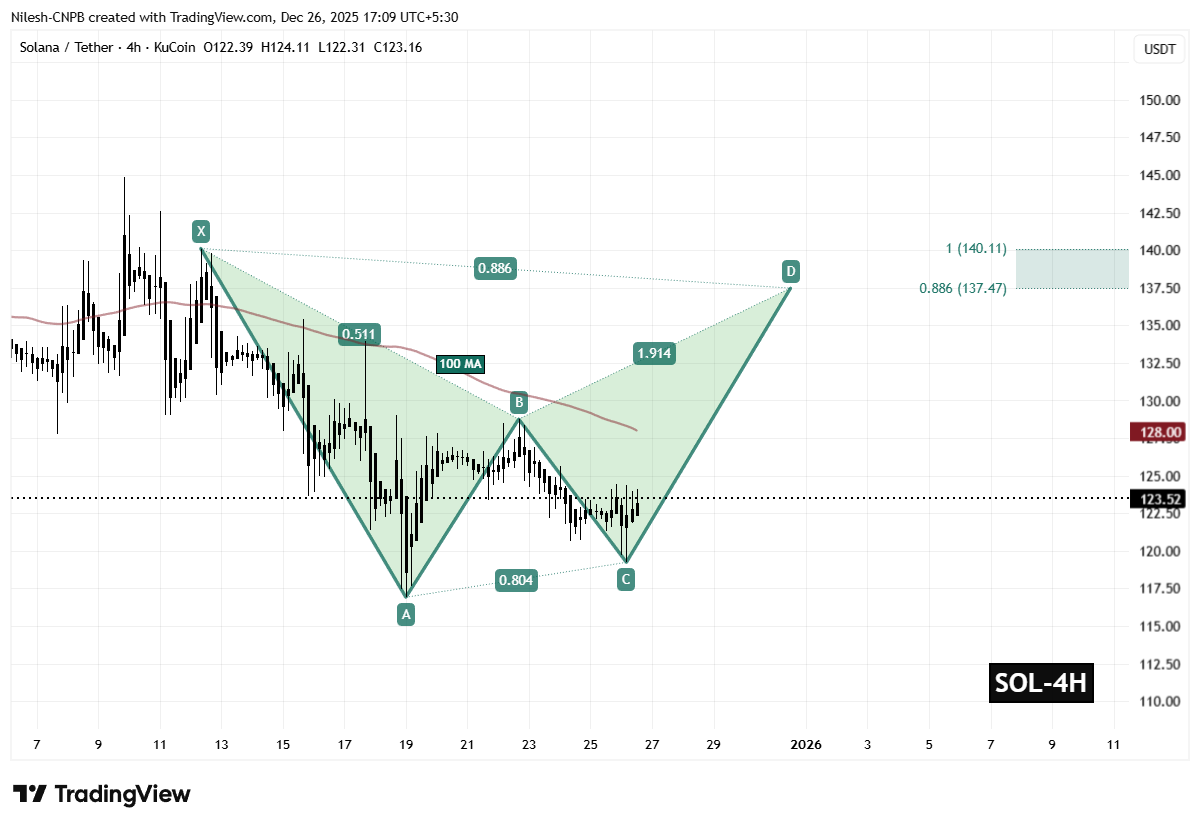
Solana (SOL) 4H Chart/Coinsprobe (Source: Tradingview)
Since printing the Point C low, SOL has started to recover steadily and is now trading near $123.52. This rebound suggests that selling pressure is weakening and that bulls are gradually regaining control.
Adding further technical significance, the 100-hour moving average is currently positioned around $128.00. A successful reclaim and hold above this level would strengthen the bullish case and confirm improving momentum.
What’s Next for SOL?
If buyers continue to defend the $119.24 support zone and manage to flip the 100-hour moving average into support, the Bearish Bat pattern points toward a potential rally into the Potential Reversal Zone (PRZ).
Based on Fibonacci projections, the PRZ is located between:
$137.47 (0.886 Fib extension) and $140.11 (1.0 Fib extension).
This target zone represents an upside of roughly 13% from current price levels and aligns closely with classic harmonic completion areas where price often reacts sharply.
However, if SOL fails to hold above the CD-leg support and slips back below the $119 region, the structure could weaken. In that case, the bullish scenario may be delayed, opening the door for a short-term correction before any renewed attempt higher.
For now, SOL remains technically constructive, with the harmonic pattern suggesting that the next meaningful move could favor the upside if current support levels continue to hold.
Disclaimer: The views and analysis presented in this article are for informational purposes only and reflect the author’s perspective, not financial advice. Technical patterns and indicators discussed are subject to market volatility and may or may not yield the anticipated results. Investors are advised to exercise caution, conduct independent research, and make decisions aligned with their individual risk tolerance.
Related Articles
Data: The US SOL spot ETF had a total net inflow of $5,943,600 on the day.
XRP Ledger Surpasses Solana in RWA Tokenization as Soil Launches Yield Protocol
Solana Price Faces Crucial Test at $86.90 Amid Bearish Trend
Solana Tests Critical Levels After 7.7% Jump as URPD Chart Guides Next Move