Bitcoin Cash (BCH) weakens, facing a "dead cat bounce" before a series of negative signals
Bitcoin Cash (BCH) continues to decline in the red, trading below the $522 mark at the time of writing on Tuesday, after a series of unsuccessful attempts to conquer key resistance levels. Signals from the derivatives market and on-chain data indicate growing bearish sentiment, reflecting selling pressure still dominating. Notably, this picture also raises the possibility of a short-term technical rebound—often called a dead-cat bounce—before the price faces the risk of falling further, heading toward lower support zones.
Derivatives and on-chain indicators signal negative outlook
Data from the Bitcoin Cash derivatives market are sending unfavorable signals. According to CoinGlass, the BCH long/short ratio on Tuesday is only 0.90. The fact that this indicator remains below 1 suggests bearish sentiment is prevailing, with most traders leaning toward short positions and betting on a price decline.
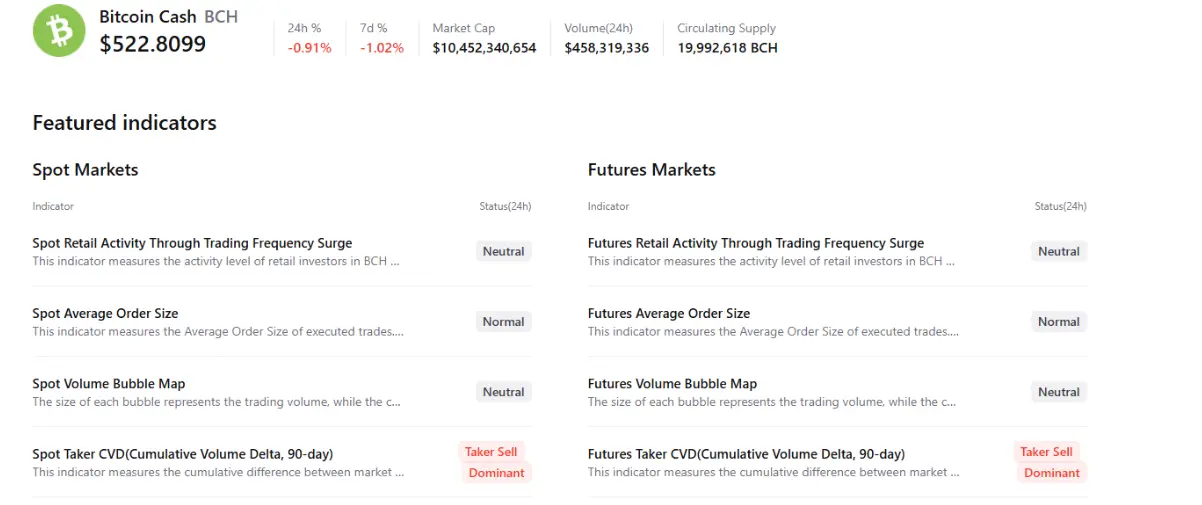
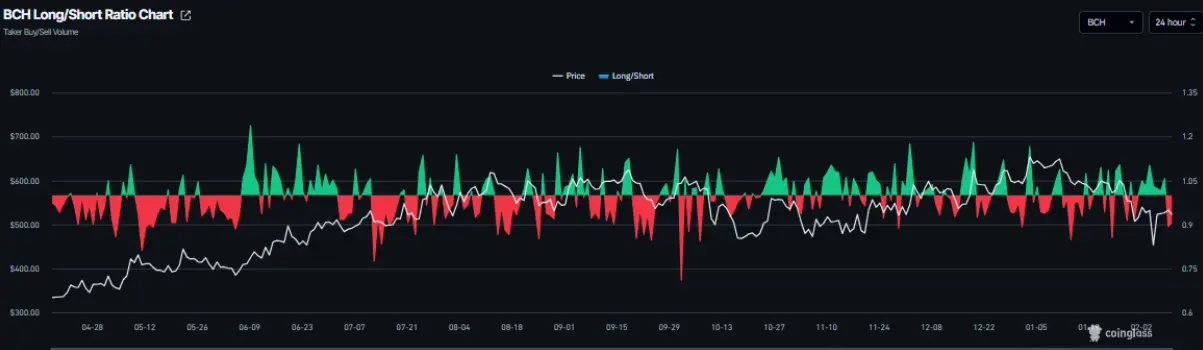 BCH long/short ratio chart | Source: Coinglass The negative outlook is further reinforced by aggregated data from CryptoQuant. Both the spot and futures markets for BCH show selling pressure dominating, increasing the risk of a short-term correction.
Bitcoin Cash price forecast: “dead-cat bounce” scenario in play
The price of Bitcoin Cash (BCH) repeatedly faces strong resistance at the 61.8% Fibonacci retracement zone around $534.80, established from the decline starting at the peak of $603.90 on January 27 down to the bottom of $423.00 on February 6. Notably, this area nearly coincides with the broken upward trendline as well as the 200-day EMA at $544.70, forming a key resistance zone.
Current developments suggest BCH may be undergoing a technical rebound (dead-cat bounce), reflecting a short-term recovery amid a still-weak downtrend. As of Tuesday, the coin is fluctuating around $525.40.
In a negative scenario, if selling pressure continues to increase, BCH could retreat further to the daily support zone at $478.70.
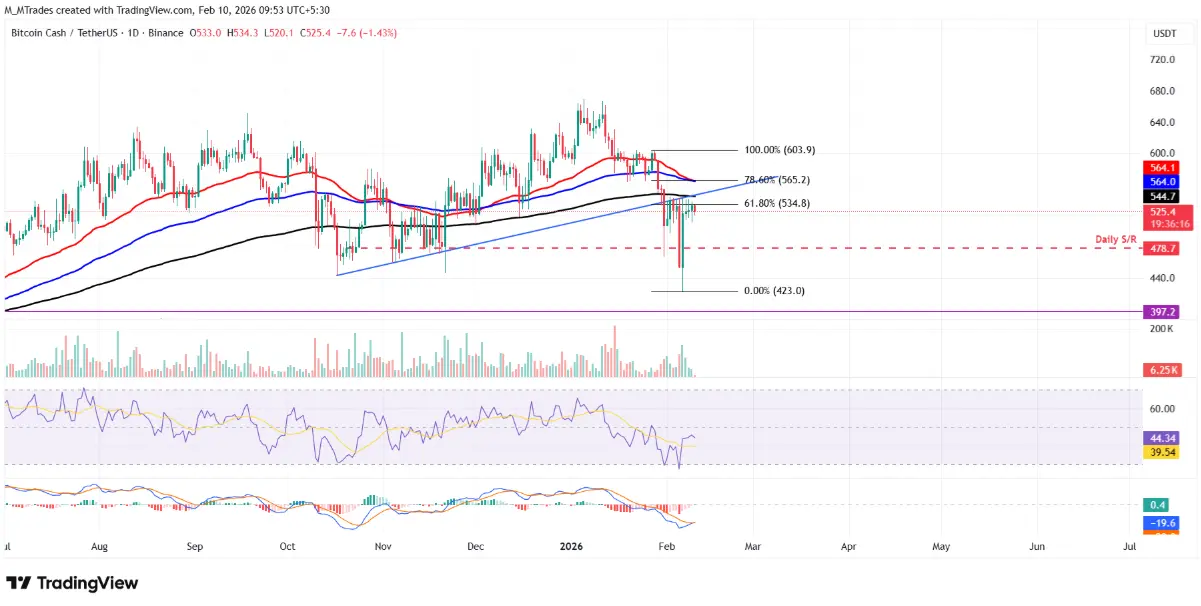 Daily BCH/USDT chart | Source: TradingView Momentum indicators continue to signal caution. The RSI is at 44, below the neutral 50 level and trending downward, indicating selling pressure is gaining strength. Meanwhile, MACD lines are narrowing, raising expectations of a potential bullish crossover. However, if this signal is not confirmed, the downtrend is likely to persist, increasing the risk of deeper correction.
Conversely, if BCH can rally and close firmly above the 200-day EMA at $544.70, the recovery could extend toward the nearest resistance zone around $564.00—where the 100-day EMA converges.
Related Articles
Data: In the past 24 hours, the total liquidation across the network was $266 million, with long positions liquidated at $143 million and short positions at $123 million.
Data: 215 BTC transferred from an anonymous address, worth approximately 10.08 million USD
Analyst: Macro Expansion and Fed Rate Cuts Could Drive Bitcoin to New Highs in 2026