The secret the market hasn't uncovered! XRP dominance rebounds, challenging to surpass ETH market capitalization
XRP weekly decline of 12%, currently reporting $1.40, but performing strongly relative to BTC and ETH. Analyst CryptoInsightUK points out that there are major liquidity clusters at $2.29, $3.60, $4.20, and $4.40. The dominance indicator shows a bullish trend from support rebound, needing only a 189% increase to surpass Ethereum in market cap.
XRP Dominance Rebound: Market Dynamics Subtly Changing
(Source: TradingDifferent)
The subtle shift in market dominance has caught traders off guard, as analysts uncover hidden strength. XRP’s price has fallen 12% over the past 7 days, remaining around $1.40 this week without breaking below that level. In a broadly pressured market environment, this relative resilience is rare. While Bitcoin plummeted from $110,000 to $60,000 and Ethereum from $4,000 to $2,500, XRP’s decline has been comparatively moderate, indicating a different market structure from mainstream assets.
CryptoInsightUK, a well-known crypto analyst, notes that XRP shows strength relative to Bitcoin and ETH, which has fueled bullish forecasts despite weak market sentiment. “Relative strength” is a key concept in technical analysis; it doesn’t mean absolute price increases but rather smaller declines during overall market downturns or larger gains during uptrends. This relative performance often signals capital rotation from weaker to stronger assets.
Interestingly, indicators like XRP’s “market dominance” have rebounded from support levels and show bullish tendencies, which analysts interpret as signs of strengthening market conditions. Market dominance measures a crypto asset’s market cap as a percentage of the total crypto market cap. When XRP’s dominance rises, it indicates its market cap is growing faster than the overall market, showing capital flowing into XRP.
Data shows XRP’s current market dominance is about 5.2%, up from 4.1% at the start of the year—an increase of over 1 percentage point. While seemingly small, considering the overall market size, this represents hundreds of millions of dollars flowing into XRP. More importantly, the dominance indicator has formed a rebound pattern from support levels, often a sign of potential trend reversal.
CryptoInsightUK suggests XRP could overtake Ethereum, as it only needs a 189% increase from current levels. This calculation is based on market cap comparison: Ethereum’s current market cap is about $300 billion, while XRP’s is approximately $110 billion (at $1.40). To surpass Ethereum, XRP’s market cap must reach $318 billion, which would correspond to a price around $4.05, representing a 189% increase from current prices. The analyst considers this possible but highly challenging.
The “overtaking Ethereum” narrative is very appealing within the XRP community, providing clear psychological milestones. However, surpassing market cap requires more than just price appreciation; fundamentals must support it. Ethereum, as a leader in smart contracts, boasts a vast DeFi ecosystem and developer community. For XRP to surpass in market cap, it must demonstrate that its cross-border payment applications can match Ethereum’s ecosystem value.
Four Major Liquidity Clusters: Accelerators for XRP’s Rise
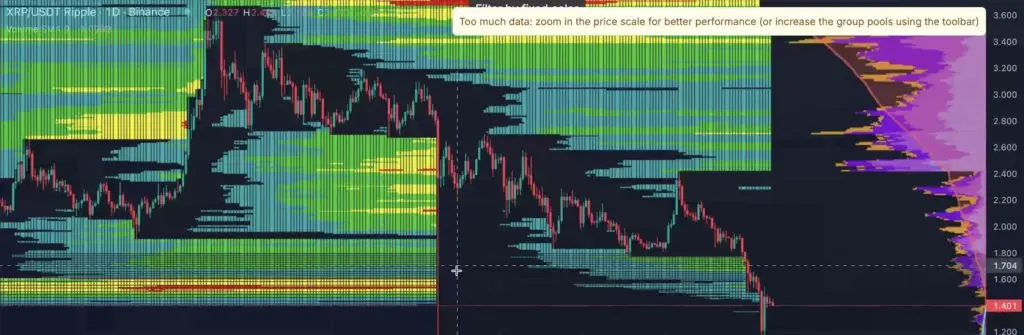
Analysts emphasize that liquidity clusters around $2.29, $3.60, $4.20, and $4.40 are significant. They believe that if XRP’s price begins to rise, these clusters could propel it higher. Liquidity clusters are price zones with concentrated limit buy or sell orders, which can trigger notable market reactions when touched.
The $2.29 level is the first liquidity cluster, serving as a key support during prior corrections. Many investors have buy orders around this price; if the price rebounds to this level, these holders may add to their positions or hold firm, providing support. Conversely, a breakout above $2.29 could cause pending buy orders at that level to be skipped, potentially leading to a surge as new buyers chase higher prices.
$3.60 is the historic high from July 2025 and a critical psychological resistance. Many early investors have their cost basis near this level, so profit-taking pressure is natural as the price approaches. However, a successful breakout and sustained trading above $3.60 would clear this resistance, opening the way for higher targets.
$4.20 and $4.40 are higher-level liquidity zones, possibly corresponding to institutional target prices or options strike prices. When the price reaches these levels, large buy or sell orders may be triggered, causing short-term volatility. Trend followers see these zones as clear trading reference points.
Analysis of XRP’s Four Major Liquidity Clusters
$2.29: Former support turned resistance, a springboard for acceleration after breakout
$3.60: Historic high and key psychological barrier, clearing profit-taking pressure
$4.20: Institutional target zone, potential trigger for large buy orders
$4.40: New price discovery zone, few resistances above after breakout
Analysts believe that as XRP’s price breaks through these clusters sequentially, each breakout will attract new buyers, creating self-reinforcing upward momentum. This “liquidity-driven price discovery” pattern is common in crypto markets; when sentiment shifts from bearish to bullish, these zones often serve as catalysts for rapid price increases.
$1.50 Critical Support: The Last Defense at the Bottom of the Downtrend Channel
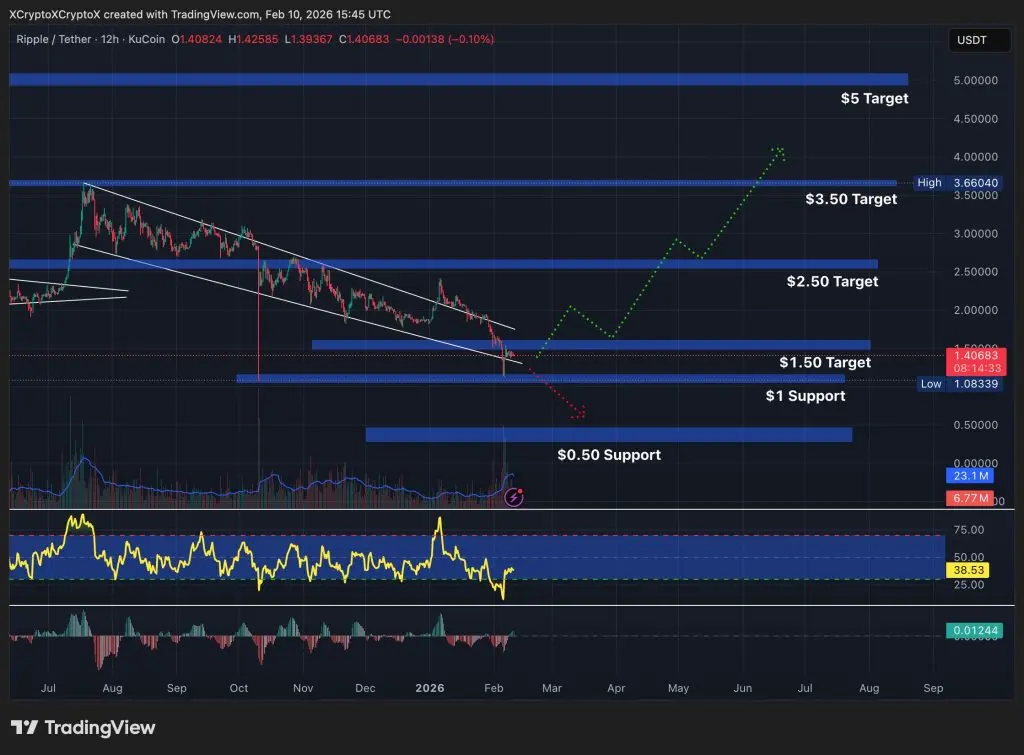
(Source: TradingView)
XRP The price has been gradually declining within a clear downtrend channel. It is now approaching the critical demand zone around $1.30 to $1.50, where it has previously bounced multiple times. The downtrend channel is formed by two parallel trendlines, with the price oscillating within. Currently, XRP is testing the lower boundary of this channel, a crucial moment for future direction.
Selling pressure has noticeably eased here. Volume and volatility metrics show that the decline near $1.40 has slowed, with no signs of panic selling. This often indicates that selling is nearing exhaustion and buying interest is emerging. If XRP can reclaim $1.50, it opens the door to move toward $2.50.
The importance of $1.50 lies in it being the support of the channel’s lower boundary and a psychological level. Falling below $1.50 would mean a breakdown of the channel, worsening the technical outlook and possibly triggering further sell-offs. Conversely, holding above $1.50 and bouncing would confirm the support at the channel’s lower boundary, setting the stage for a reversal.
Analysts note that as long as XRP stays above $1.30, it doesn’t look like a collapse but rather a consolidation phase preparing for the next move. This “accumulation and consolidation” interpretation is based on several observations: first, XRP has been sideways around $1.40 for several weeks, and such consolidation often precedes a decisive breakout. Second, relative strength indicates that capital has not fled XRP en masse but is waiting for clearer signals. Third, the rebound in dominance suggests internal capital rotation into XRP.
From a risk-reward perspective, current levels are attractive for buying XRP. A stop-loss below $1.30 limits maximum loss to about 7%. A move up to $2.29 offers a potential gain of 64%. Further rise to $3.60 yields a potential profit of 157%. Even reaching the analyst’s ultimate target of $4.40 could deliver a 214% gain. This asymmetric risk-reward profile is a core reason traders consider accumulating at these lows.
However, investors must recognize that a 189% upside target, while mathematically feasible, requires strong fundamental catalysts. These could include Ripple announcing partnerships with more central banks and large financial institutions, a breakthrough in XRP’s cross-border payment applications, or further clarity in US regulation. Without such catalysts, relying solely on technicals makes such a large rally unlikely.
Related Articles
Hong Kong Virtual Asset Regulation: Three Arrow Measures Announced! Margin, Perpetual Contracts, and Market Makers to be Opened
Hyperliquid's largest ETH long position increased by 5,000 ETH, with an overall unrealized loss of $10.43 million.
Ethereum Co-Founder Vitalik Buterin Sells 2,961 ETH Over Three Days for Planned Initiatives
Arkham: Trend Research's final loss on ETH in this round is $869 million
Buy more as it dips! Ethereum falls below the ETF entry price, with whales contrarily accumulating 40,000 coins