MYX drops below $5 as the bears take control — 42% decline risk emerges
The price of MYX Finance (MYX) has experienced a sharp decline, falling below the important $5.00 level, signaling increasing downside risk.
MYX Market Turns Bearish
This correction follows several trading sessions with weakening momentum. Selling pressure has significantly increased as MYX failed to hold key support levels during the day. The current market structure clearly reflects a shift toward a downtrend.
The recent plunge has led to a substantial increase in short positions from traders. Funding rate data shows that the futures market is dominated by short contracts. A negative funding rate is a clear indication of bearish trader sentiment, as they bet on MYX Finance’s price continuing to fall further.
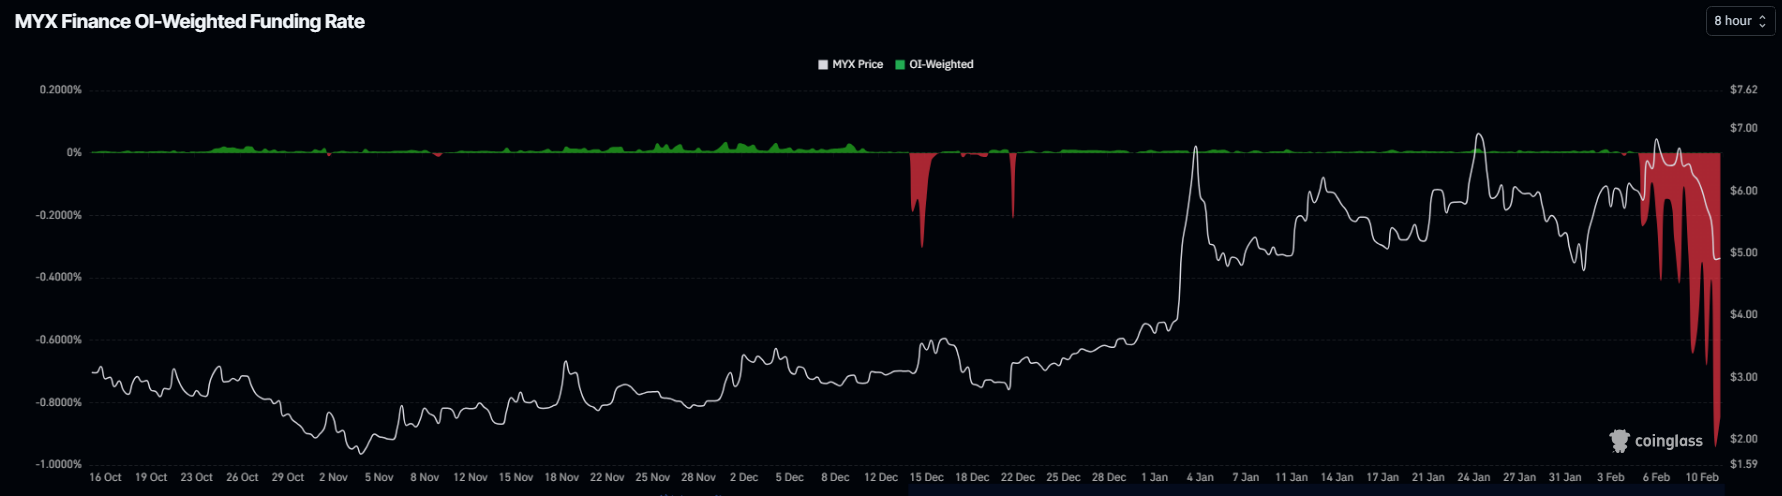 Funding Rate MYX | Source: Coinglass A sudden spike in the number of short orders often signals expectations of a deeper correction. Traders are anticipating a major decline that they can capitalize on through leveraged positions. However, imbalance in the derivatives market could increase volatility and add downward pressure if the selling wave continues to escalate.
The Money Flow Index (MFI) also indicates strong selling pressure on MYX, reinforcing the current correction trend. In recent sessions, this indicator has been steadily decreasing, reflecting capital outflows from the market. This confirms that bearish momentum still dominates short-term trading activity.
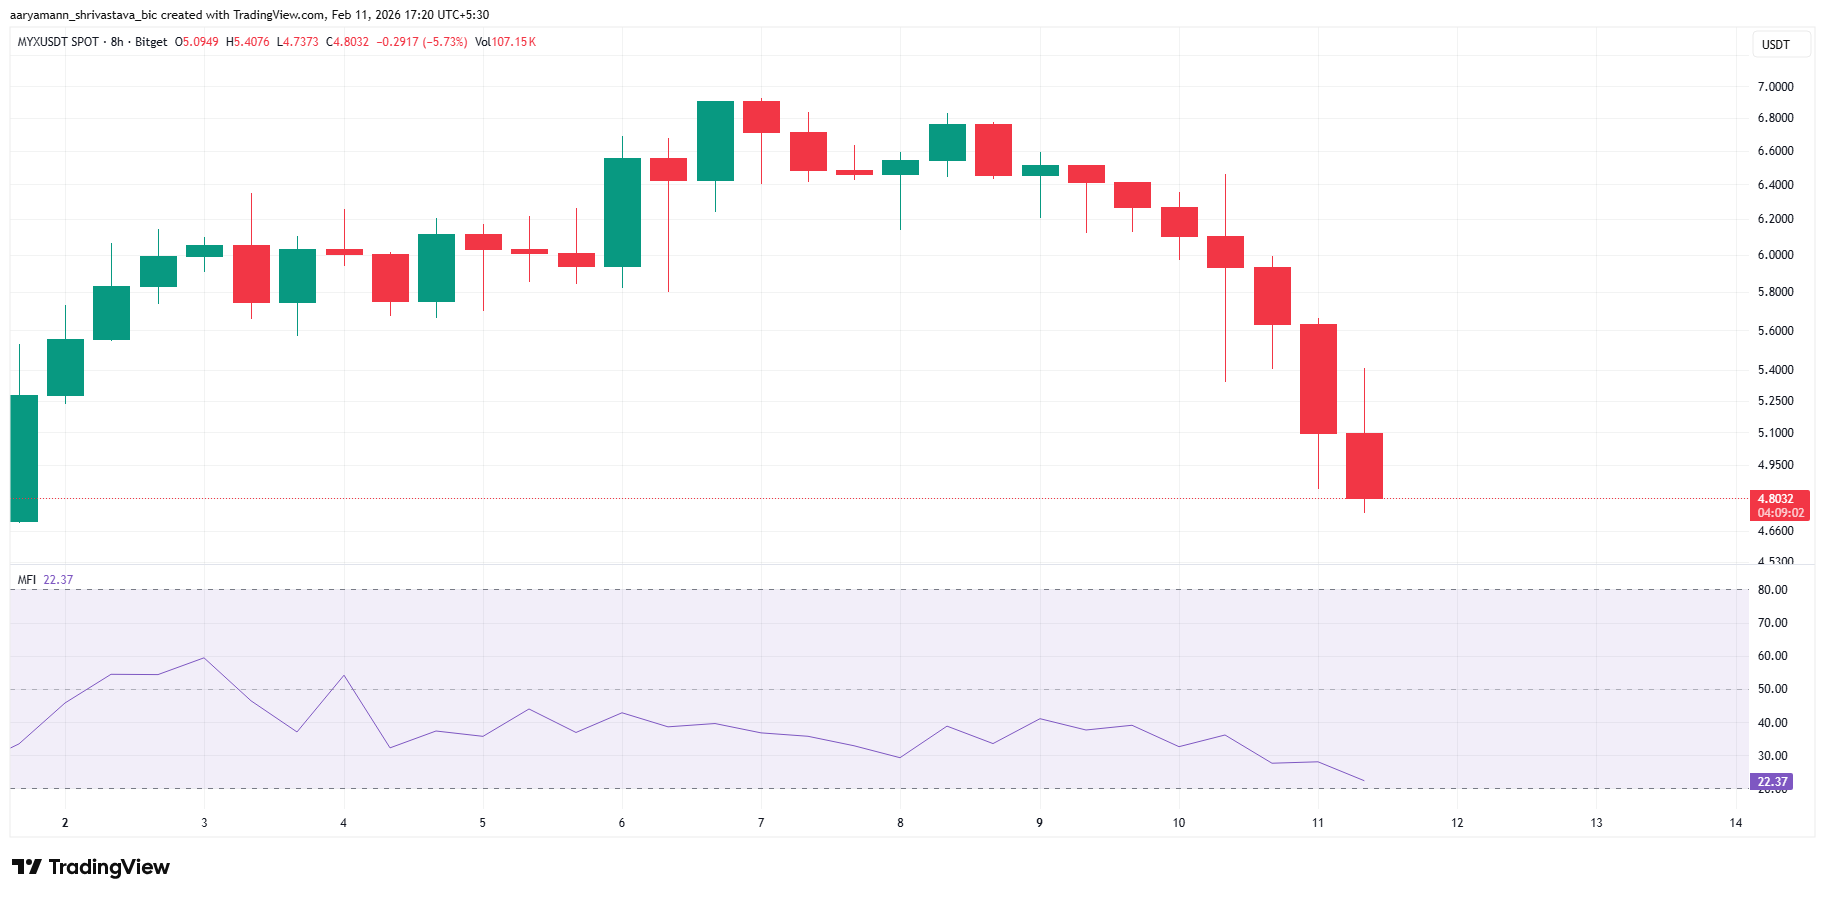 MYX Price Analysis | Source: TradingView Although the MFI is approaching oversold levels, it has not yet fallen below 20.0 — a common threshold for overselling signals. If the indicator drops below that level, buying interest is likely to emerge at lower prices, potentially triggering a technical rebound. However, this depends on whether capital inflows are strong enough to counteract selling pressure.
Risks of Continued Decline for MYX
In the past 24 hours, MYX has dropped 23%, currently trading at $4.87 after breaking below the $5.00 support level. The token shows signs of completing a bearish ascending wedge pattern — a formation often indicating deeper corrections when support levels are broken.
Based on the wedge structure, MYX could face a decline of up to 43%, bringing the price down to around $2.81, aligned with the Fibonacci 1.78 level. A more immediate and realistic target is the support zone at $4.07, corresponding to the Fibonacci 1.23 level. If the price breaks below $4.61, the likelihood of testing the $4.07 level increases, and the risk of a deeper drop becomes more apparent if the overall crypto market sentiment continues to weaken.
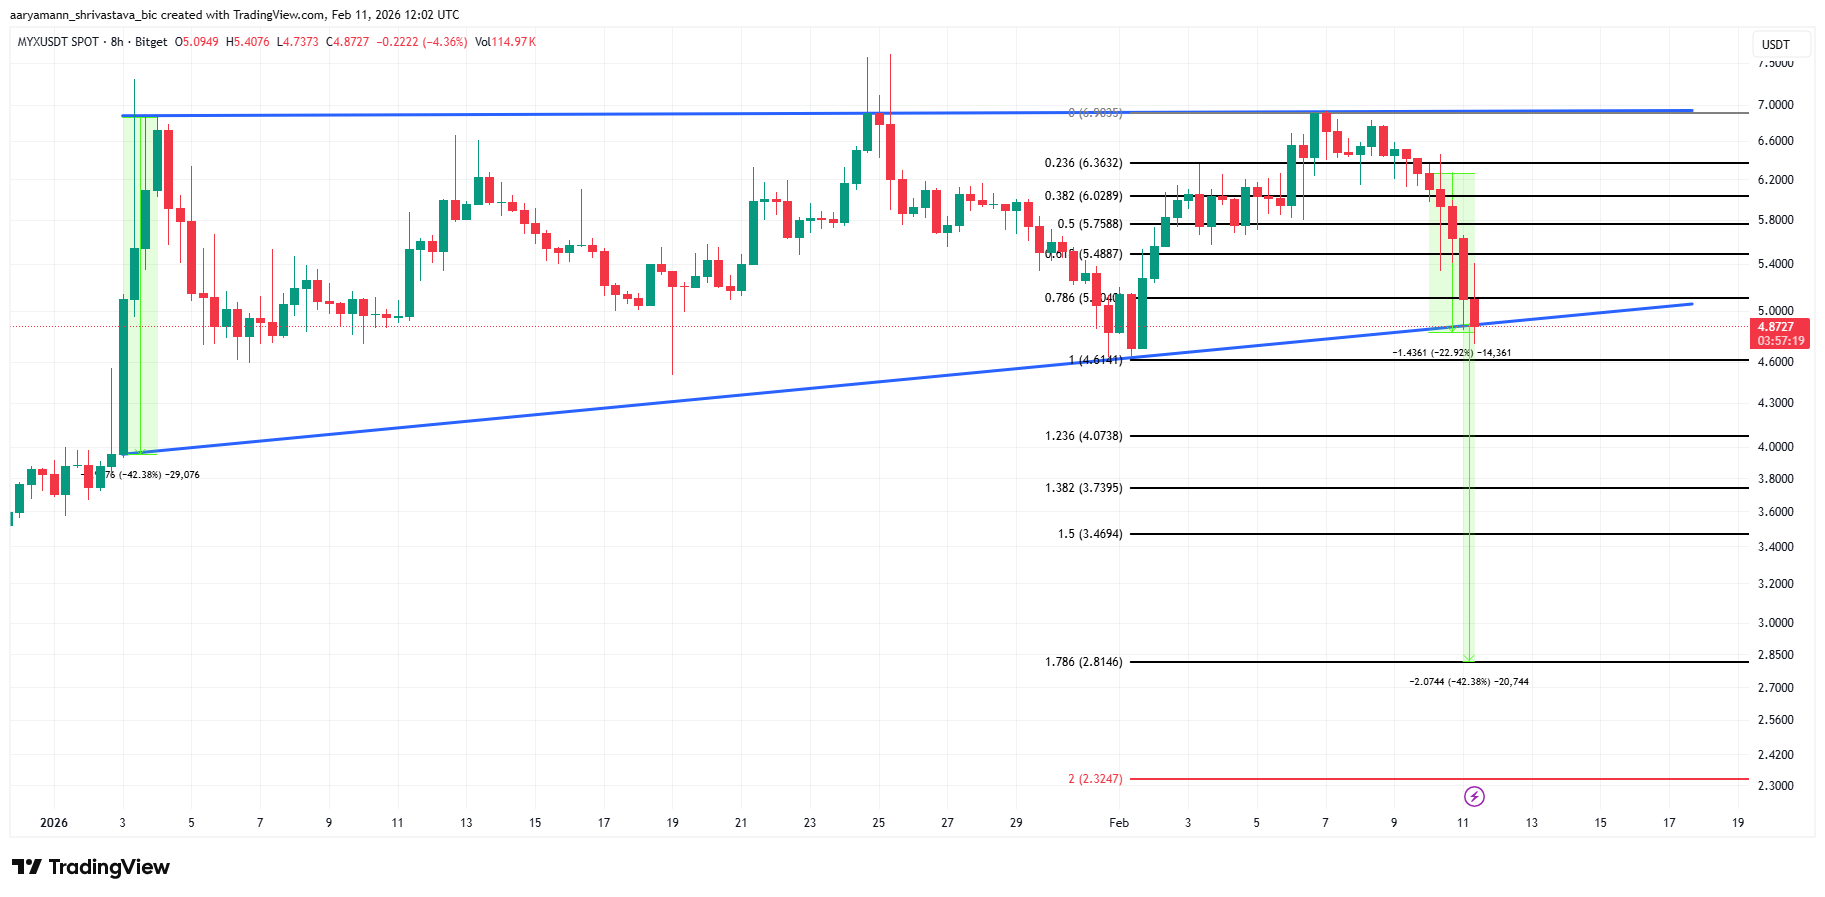 MYX Price Analysis | Source: TradingView However, this outlook could change if MYX enters oversold territory, as indicated by the MFI. When capital inflows begin to surpass outflows and short positions are closed, MYX Finance may find stability. A rally above the resistance level of $5.75 would invalidate the current bearish scenario and open the possibility for the price to rise to $6.00 in the short term.
Investors should closely monitor technical signals and market developments to make informed decisions amid the current volatility.