Memecoin: Dogecoin, Shiba Inu, and Pepe continue to plummet under increasing selling pressure
Memecoins such as Dogecoin (DOGE), Shiba Inu (SHIB), and Pepe (PEPE) all plunged into the red during Thursday’s trading session, indicating that selling pressure has yet to show signs of easing. Highly speculative, the meme coin group faces the risk of a sharper decline as the downtrend continues to dominate investor sentiment. From a technical perspective, DOGE, SHIB, and PEPE are likely to continue weakening this week amid a market lacking strong enough catalysts to trigger a recovery.
Dogecoin Faces Greater Downside Risk as Selling Pressure Mounts
As of Thursday, Dogecoin lost nearly 1%, extending the 3% drop from the previous session, showing that selling pressure remains unabated. On the 4-hour chart, DOGE is trading significantly below the 50- and 200-day exponential moving averages (EMAs)—a signal reinforcing the short-term downtrend structure.
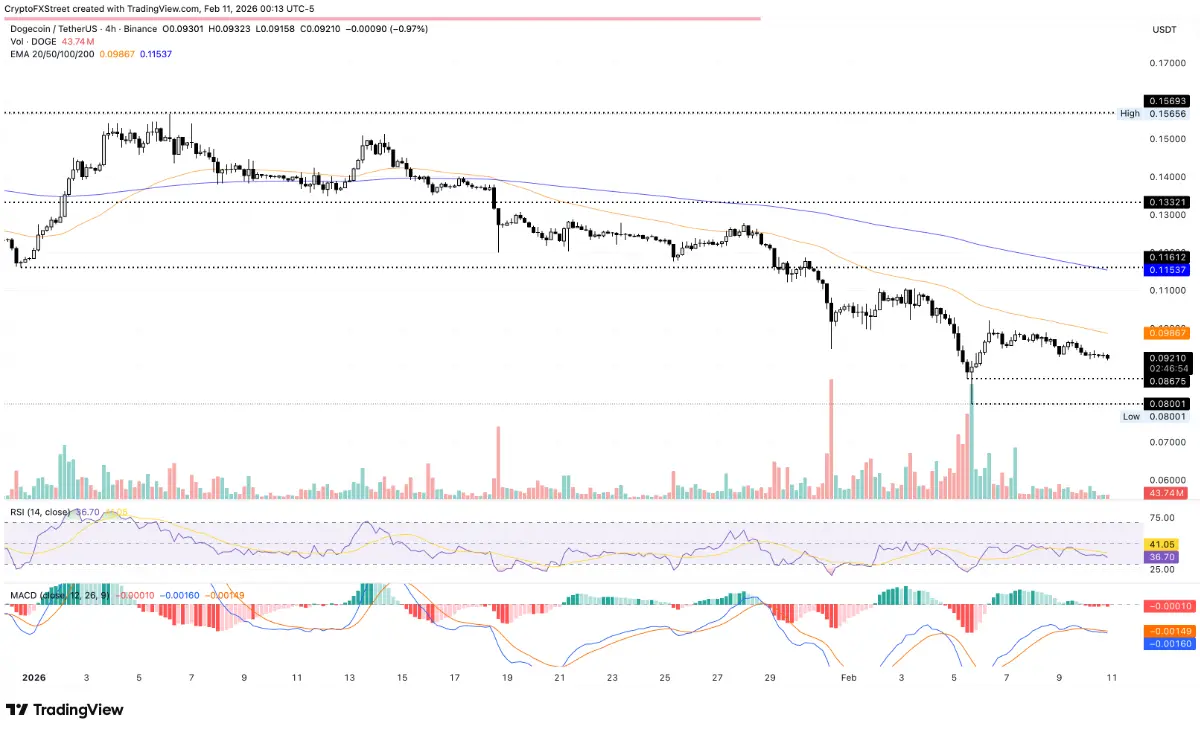 4-hour DOGE/USDT chart | Source: TradingView Technical indicators on the same timeframe continue to lean negative. The Relative Strength Index (RSI) has fallen to 36 and remains weak, implying room for further downside before entering oversold territory. Meanwhile, the MACD stays below the signal line, with decreasing histogram bars, reflecting increasing bearish momentum.
Regarding key technical levels, Dogecoin’s nearest support zone is at $0.08675. If the price closes below this level, selling pressure could push DOGE lower toward the February 6th low around $0.080. Conversely, any rebound is likely to face significant resistance at the 50-day and 200-day EMAs, approximately at $0.098 and $0.1153, respectively.
Shiba Inu Bears Target the Near-Term Bottom
Shiba Inu is showing a pattern similar to Dogecoin, continuing to face correction pressure, down nearly 1% at the time of recording on Wednesday, marking its fourth consecutive decline. On the 4-hour timeframe, this meme coin remains within a descending channel pattern, with short-term support around $0.0000059.
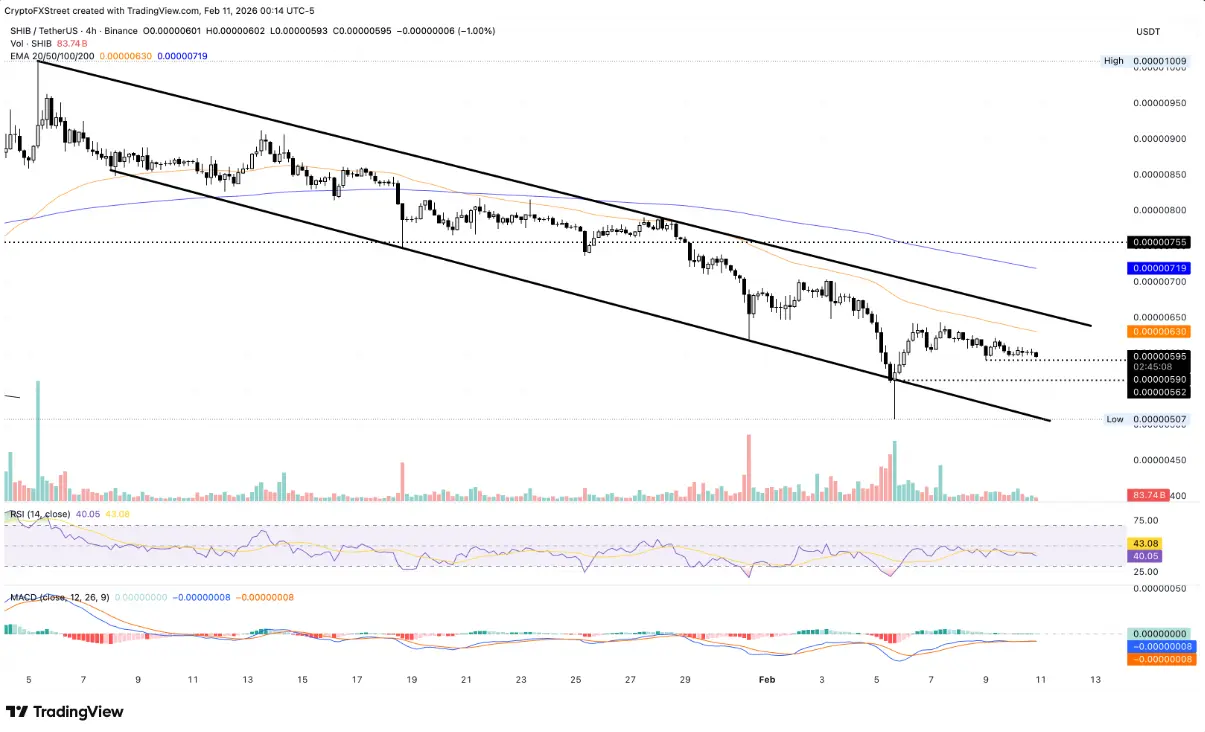 4-hour SHIB/USDT chart | Source: TradingView In a more negative scenario, key support levels for SHIB are at $0.0000056—its February 6th low—and deeper at $0.0000051, aligned with the lower boundary of the current downtrend channel. Weakening momentum is evident as the RSI drops toward 40 and approaches oversold levels, amid increasing selling pressure. Additionally, the MACD and signal lines continue to narrow, raising the risk of a bearish crossover.
On the upside, if buying interest returns and pushes the price higher, SHIB could test the 50-period EMA near $0.0000063 before facing stronger resistance at the upper boundary of the downtrend channel, close to $0.0000065.
Pepe Faces Downward Pressure Near Key Resistance
PEPE continues to face selling pressure, declining over 1% at the time of writing on Thursday, extending its more than 4% drop from the previous session. This movement brings the weekly decline close to 5%, marking the sixth consecutive week of weakness for the frog-themed meme coin.
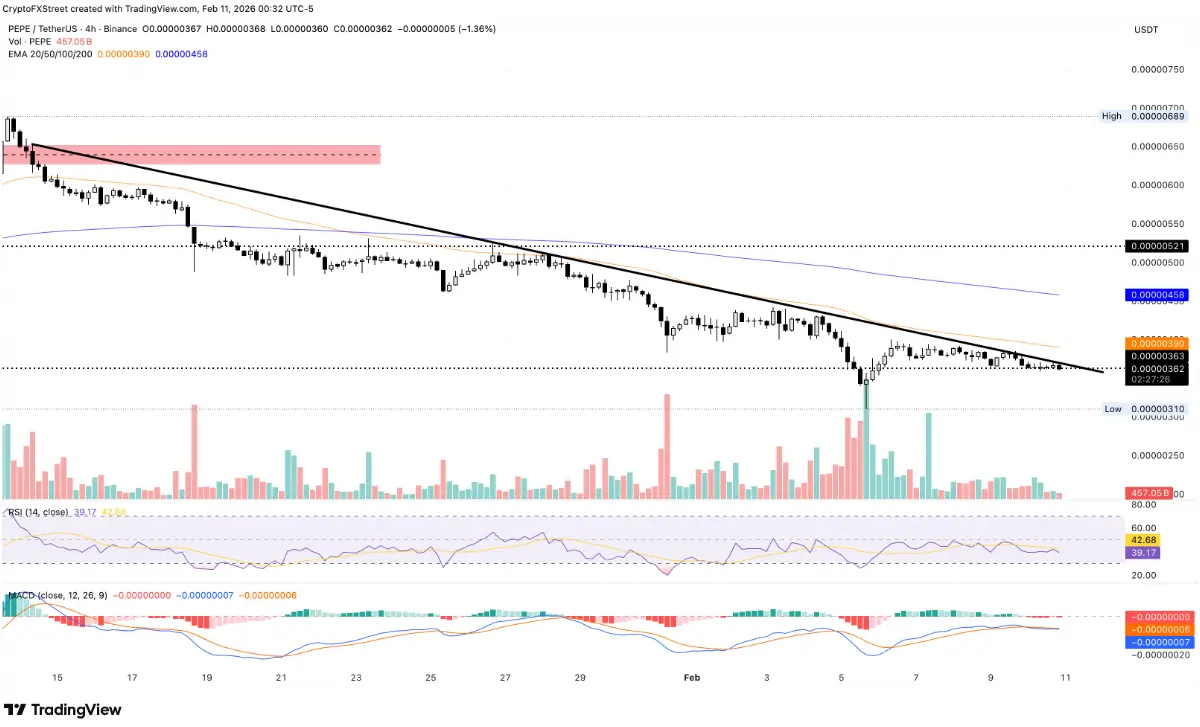 4-hour PEPE/USDT chart | Source: TradingView On the 4-hour chart, PEPE is turning downward from the resistance line and appears to be testing the February 6th low around $0.00000310. Technical indicators support the negative outlook: RSI has fallen to 39 and moved away from the neutral line, indicating increasing selling pressure; meanwhile, the MACD and signal lines continue to expand downward, with increasingly large negative histogram bars.
In a more optimistic scenario, if PEPE can rebound and break above the $0.00000370 resistance zone, it would confirm a breakout. The price could then target the immediate goal at the 50-period EMA near $0.00000390, and further up at the 200-period EMA at $0.00000458.
Related Articles
Analyst Bernstein predicts Bitcoin price at $150,000, while new Dogecoin Maxi Doge takes the pre-sale spotlight
Retail investors flee, whales scoop up the bottom! PEPE smart money returns, absorbing 23 trillion tokens in four months
Dogecoin Price Eyes Critical Support at $0.054 Signaling Potential for Rebound