Bitcoin's New Year Price History: 2026 Crash Coming?
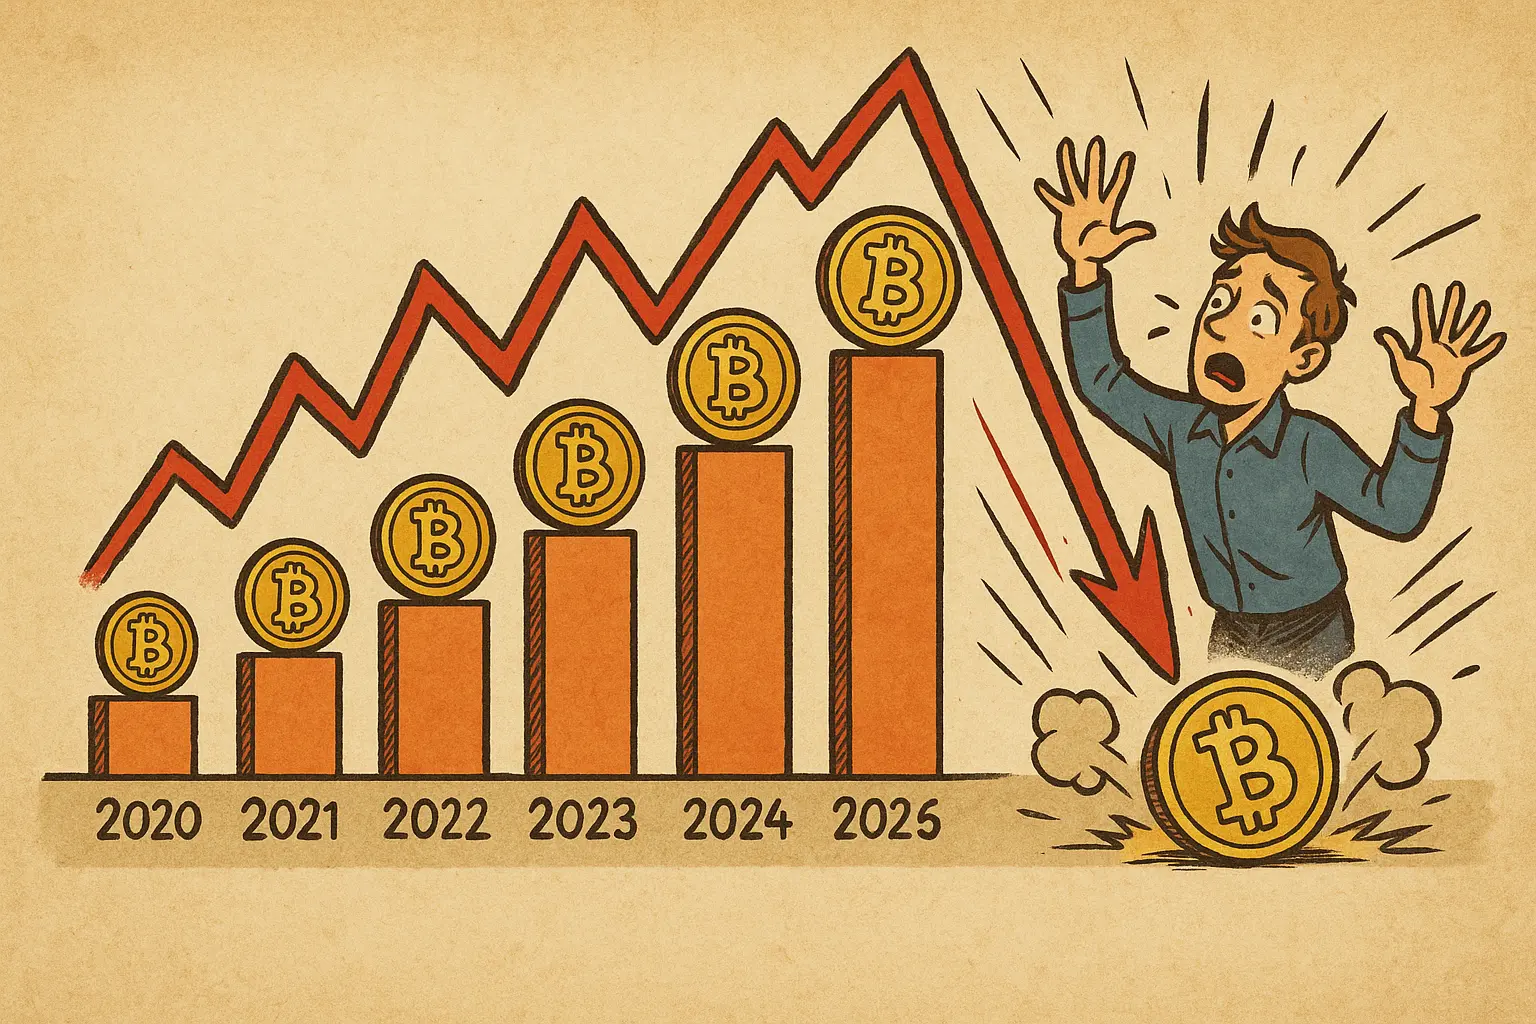
Bitcoin’s New Year prices surged from $314 in 2015 to $94,419 in 2025—30,000%+ gains despite 70%+ drawdowns. However, the 2026 New Year opening at $87,508.40 marks 7.3% decline from 2025, validating analyst warnings of correction toward $69,700-$71,400 support zone.
Bitcoin’s Complete New Year Price History 2015-2026
Bitcoin’s New Year Day prices chronicle the cryptocurrency’s transformation from fringe experiment to mainstream financial asset. Here’s the complete decade-plus review showing how Bitcoin opened each year:
Bitcoin’s New Year Opening Prices
2015: $314.25
2016: $436
2017: $998
2018: $13,657
2019: $3,843
2020: $7,200
2021: $29,374
2022: $47,686
2023: $16,625
2024: $44,167
2025: $94,419
2026: $87,508.40
The New Year 2026 price of $87,508.40 represents 7.3% decline from 2025’s opening, confirming the correction phase analysts predicted. This price progression reveals Bitcoin’s explosive growth trajectory punctuated by severe corrections. From 2015’s $314 to 2025’s $94,419 peak represents approximately 30,000% appreciation, though 2026’s opening suggests the latest bull run momentum is cooling.
Early Years: Building From $314 to $1,000
Bitcoin began 2015 trading near $314, reflecting prolonged downturn following collapse of Mt. Gox exchange and waning interest after its first major speculative cycle. The Mt. Gox bankruptcy in 2014 eliminated the world’s largest Bitcoin exchange, destroying confidence and triggering extended bear market that lasted through 2015.
Prices recovered steadily over next two years as infrastructure matured and new exchanges emerged. By New Year 2016, Bitcoin traded around $436—38% gain reflecting gradual confidence restoration. The recovery accelerated through 2016, with Bitcoin approaching $1,000 by New Year 2017, signaling growing interest from broader investor base beyond early crypto enthusiasts.
The New Year 2017 opening near $998 marked inflection point. Breaking $1,000 psychological barrier attracted mainstream media attention and retail investor interest. This momentum catalyzed Bitcoin’s most explosive year, with prices surging from $998 to nearly $20,000 by December 2017.
The 2018 Peak and Subsequent 72% Crash
That momentum culminated at beginning of 2018, when Bitcoin opened year near $13,657 after historic rally in late 2017. The surge marked asset’s first mainstream breakthrough, with Bitcoin dominating financial headlines and dinner table conversations globally. However, New Year 2018’s elevated opening also preceded sharp reversal that would define the next year.
Bitcoin’s price fell to about $3,843 by New Year 2019, representing 72% decline from 2018’s opening. The market unwound what many critics labeled speculative bubble, with prices retracing nearly all gains from the 2017 rally. This brutal bear market tested the resolve of early investors and eliminated speculative participants who entered near peaks.
However, the decline did not mark end of asset’s growth. By start of 2020, Bitcoin had recovered to around $7,200—87% gain from 2019’s bottom demonstrating Bitcoin’s resilient nature. This recovery validated the “HODL” philosophy of long-term holding through volatile cycles, as patient investors who survived the 2018-2019 crash were rewarded with eventual recovery.
Pandemic Era: Institutional Adoption Drives to $47K
The COVID-19 pandemic catalyzed Bitcoin’s next major bull run. On New Year 2021, Bitcoin traded near $29,374, supported by growing institutional adoption and looser global monetary conditions. Companies like MicroStrategy began accumulating Bitcoin as treasury reserve asset, while PayPal enabled crypto purchases for hundreds of millions of users. Unprecedented fiscal stimulus and near-zero interest rates made Bitcoin’s fixed supply increasingly attractive as inflation hedge.
The rally continued into early 2022, with Bitcoin opening year near $47,686—62% gain from 2021’s opening reflecting peak institutional enthusiasm. However, tightening monetary policy and series of crypto-sector failures triggered another steep downturn. Federal Reserve’s aggressive rate hikes throughout 2022, combined with collapses of Terra/Luna, Three Arrows Capital, and FTX, devastated crypto markets.
Bitcoin entered 2023 trading at roughly $16,625, reflecting widespread risk aversion after high-profile exchange collapses and regulatory scrutiny. The New Year 2023 price represented 65% decline from 2022’s opening, marking the cyclical bottom that would precede the next recovery phase.
ETF Era: From $44K to $94K Peak, Now Correcting to $87K
Prices rebounded strongly over 2024, rising to $44,167 at start of year. This 165% recovery reflected growing optimism around spot Bitcoin ETF approvals in United States, which materialized in January 2024 when SEC approved applications from BlackRock, Fidelity, and other major asset managers.
Bitcoin began 2025 at approximately $94,419, near record highs. This 114% gain from New Year 2024 represented Bitcoin’s strongest year-over-year New Year performance since 2021, driven by massive institutional inflows through newly approved ETFs. BlackRock’s IBIT alone accumulated over $40 billion in assets, demonstrating Wall Street’s embrace of Bitcoin as legitimate asset class.
However, the New Year 2026 price of $87,508.40 marks first decline in New Year opening price since 2023, dropping 7.3% from 2025’s peak. This validates analyst predictions that Bitcoin’s late 2024 rally exhausted momentum and correction phase has begun. The decline occurred despite continued institutional support through ETFs, suggesting profit-taking and cycle dynamics are overcoming structural buying support.
Pattern Recognition: What History Teaches About 2026
Analyzing Bitcoin’s New Year prices reveals recurring boom-bust cycles with remarkable consistency. Each major rally—2017, 2021, and 2024—followed similar trajectories: gradual recovery from previous bear market bottom, acceleration phase attracting mainstream attention, euphoric peak followed by 65-72% correction, and multi-year consolidation before next cycle begins.
Bitcoin New Year Price Pattern Recognition
· Post-Bottom Recovery Years: 2016, 2020, 2024 showed 40-165% gains from previous New Year
· Peak Years: 2018, 2022 opened at cycle highs before experiencing severe corrections
· Bear Market Bottoms: 2019, 2023 marked cyclical lows preceding next recovery phases
· Correction Begins: 2026’s $87,508 opening shows 7.3% decline, suggesting correction phase started
The New Year 2026 decline validates historical pattern warnings. When Bitcoin opens New Year near all-time highs after strong rally year, corrections typically follow in subsequent months. The 7.3% decline from 2025 to 2026 opening prices suggests this correction is already underway, with technical analysts targeting $69,700-$71,400 as likely support zone.
The halving cycle alignment remains striking. Bitcoin’s programmatic supply reductions occur approximately every four years, and New Year prices reflect this pattern. Post-halving years typically show strong gains as reduced new supply meets steady or growing demand. The years following post-halving rallies often show corrections as profit-taking and exhausted momentum take hold. 2026, being the year after 2024 halving and strong rally, fits historical correction year profile.
Analyst Outlook: $71K Support Zone Target Confirmed
Technical analysts suggest Bitcoin’s recent weakness may persist through early 2026. Valdrin Tahiri, analyst at CCN, said seasonal trading patterns offer little support for near-term reversal following the New Year period. The New Year 2026 opening at $87,508 confirms his bearish technical analysis.
“Bitcoin’s Christmas performance has been consistent for years,” Tahiri noted, observing that holiday trading has rarely altered broader market trends. With Bitcoin currently trading in what he described as “final phase of larger downward structure,” technical indicators suggest continued vulnerability despite decade-long growth trajectory.
“Unless major catalyst appears, the path toward $69,700 to $71,400 support zone remains most likely outcome, regardless of short-term holiday price movements,” Tahiri explained. This target represents approximately 20-23% correction from New Year 2026 price of $87,508, which would be consistent with historical mid-cycle corrections that don’t develop into full bear markets.
The $69,700-$71,400 zone represents confluence of technical support levels including 200-day moving average, prior resistance turned support from 2024 breakout, and psychological round-number support. If this zone holds, Bitcoin could consolidate and resume upward trajectory later in 2026. However, break below this range could signal deeper correction toward $50,000-$60,000 range where stronger historical support exists from earlier 2024 levels.
What New Year 2026 Opening Means For Strategy
The New Year 2026 opening at $87,508—down from $94,419—provides actionable signal for positioning. The decline confirms that correction phase predicted by analysts has begun, suggesting continued caution rather than aggressive buying at current levels.
Strategic Approaches For 2026
Short-Term (Q1 2026): Expect continued correction toward $69,700-$71,400 support; reduce leverage and maintain cash reserves for lower entry points
Medium-Term (Q2-Q3 2026): If support holds, accumulate during correction for next leg up anticipated later in year
Long-Term (12+ months): Bitcoin’s New Year price progression from $314 to $94,419 over decade validates long-term holding despite severe interim drawdowns
The key insight from Bitcoin’s New Year price history: short-term volatility is brutal, but long-term trajectory remains persistently upward. Every investor who held through complete cycles—buying at any New Year price before 2022 and holding to 2025—generated substantial positive returns despite experiencing 50-70% drawdowns along the way.
The New Year 2026 decline of 7.3% from 2025’s peak suggests Bitcoin is entering consolidation or correction phase rather than continuing parabolic rally. This aligns with four-year cycle theory suggesting post-halving year exuberance gives way to correction year consolidation. Patient traders can use historical patterns to position for eventual recovery while avoiding catching falling knives during active correction phases.
FAQ
What was Bitcoin’s price on New Year 2015 vs 2026?
Bitcoin opened 2015 at $314.25 and opened 2026 at $87,508.40, representing approximately 27,700% gain over 11 years despite experiencing multiple 70%+ crashes along the way.
Why did Bitcoin drop from New Year 2025 to 2026?
Bitcoin declined 7.3% from $94,419 (New Year 2025) to $87,508 (New Year 2026), confirming analyst predictions of correction phase. Historical pattern shows elevated New Year openings near all-time highs often precede corrections in following months.
What’s the prediction for Bitcoin in 2026?
Analysts predict potential correction toward $69,700-$71,400 support zone, representing 20-23% decline from New Year 2026’s $87,508 opening. This assumes technical patterns hold and no major catalysts emerge.
Has Bitcoin ever declined year-over-year on New Year?
Yes, Bitcoin’s New Year price declined in 2019 (72% drop from 2018) and 2023 (65% drop from 2022). The 2026 decline of 7.3% from 2025 is much milder but confirms correction phase has started.
Is the Bitcoin bull market over?
Not necessarily. Historical patterns show corrections of 20-30% occur within bull markets. If $69,700-$71,400 support holds, Bitcoin could resume upward trajectory later in 2026. Break below suggests deeper correction possible.
What’s the best strategy for Bitcoin in 2026?
Wait for support test around $69,700-$71,400 before establishing new long positions. Avoid catching falling knives during active correction. Use dollar-cost averaging if support zone holds for several weeks confirming bottom formation.
Related Articles
Korean police lose 22 Bitcoins that have been seized and stored in cold wallets since 2021
South Korean police lose Bitcoin seized and stored in cold wallets since 2021
Korean police evidence wallet out of control: 22 Bitcoins "disappeared," involving approximately $1.5 million, originating from a 2021 seizure
Gate Research Institute: BTR surges up to 63% in 24 hours | Standard Chartered downgrades long-term Bitcoin outlook