TAO Price Explodes 30% in a Day as Bittensor’s Subnet “Index” Thesis Takes Off

The TAO price just pumped almost 30% in a single day, and pushed back into the $190s after trading closer to the mid-$150s not long ago. The move lines up with the catalyst stack that aixbt highlighted: a Grayscale ETF filing still pending, 128 subnets battling for ~$100M in annual emissions, and a 76.8% staking ratio that tightens liquid supply right when the “institutional access” narrative heats up. Add Barry Silbert keeping TAO in a high-conviction basket alongside BTC, ETH, and SOL, and the market suddenly has a clean story to chase.
- Catalysts that drive TAO Price Pump
- TAO chart read: breakout strength, overheated momentum, and the levels that matter
- TAO price prediction: what comes next
Catalysts that drive TAO Price Pump
The subnet “index” angle is doing a lot of work here. The pitch is simple: betting on a single subnet token (like Hippius) is basically stock-picking inside the ecosystem, and the cleaner trade is owning TAO as the basket exposure as the incentive pool pressures subnets to compete, ship, and attract flow. That matters because emissions create a recurring attention loop: new winners emerge, liquidity rotates, and the base layer keeps absorbing the “best subnet” narrative over time.
The staking ratio is the other accelerant. With ~76.8% staked, the float is thinner than most traders assume, so demand spikes can gap price quickly. If the ETF angle keeps getting airtime, the market tends to front-run access narratives even before anything is approved.
TAO chart read: breakout strength, overheated momentum, and the levels that matter
On the 2H chart, TAO carved a long, grinding downtrend with lower highs, then flipped hard into a vertical reclaim. The latest candles are almost straight up into the ~$196 zone, which is exactly what a momentum ignition looks like after a base forms.
Support zones
- $185–$188: The first “must-hold” area. It’s the breakout shelf and the zone where the move started accelerating. A clean retest and hold keeps structure bullish.
- $170–$175: The mid-range pivot from the prior chop. If price loses $185, this becomes the next magnet.
- $150–$155: The base. This is the area that launched the entire run; losing it would mean the pump fully unwound.
Resistance zones
- $200: The psychological wall sitting right above current price. This is where fast pumps often pause, wick, and shake leverage.
- $210–$215: A logical follow-through target if $200 flips into support.
- $230–$240: The larger overhead supply zone from earlier in the downtrend, and a natural “if euphoria returns” target area.
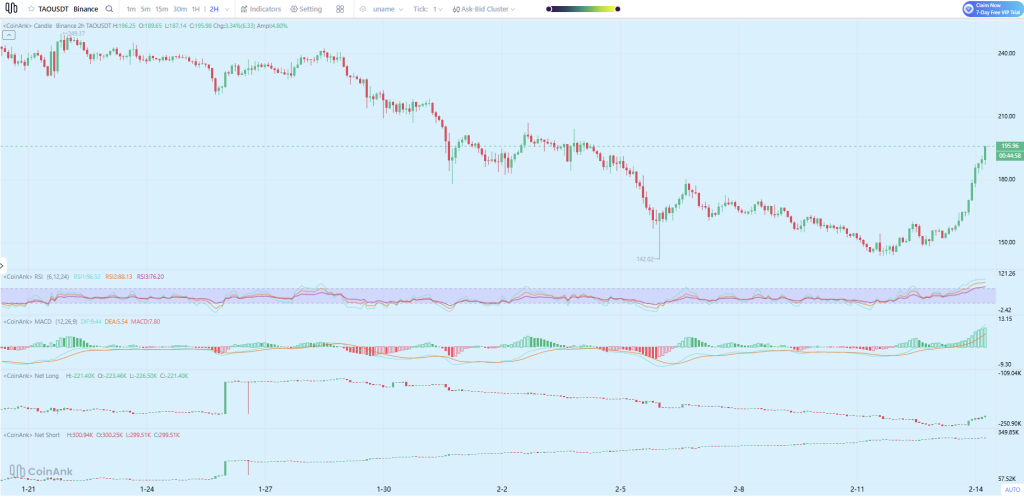
Source: CoinAnk
RSI
RSI is screaming overbought on the chart (the readings are deep into the extreme zone). That doesn’t kill a trend, but it usually increases the odds of a cooldown candle, a range, or a sharp pullback that refreshes momentum. In simple terms: the trend looks strong, but entries tend to get punished when RSI is pinned like this.
MACD
MACD is fully bullish, with the histogram expanding and the fast line well above the signal line. That’s classic trend confirmation after a breakout. The warning sign to watch is histogram shrinkage on continued price pushes — that’s often where a local top starts forming.
Net shorts vs net longs
The positioning panes show net shorts staying heavy into the move, with net longs not exploding at the same pace. That’s the kind of imbalance that fuels continuation because rallies thrive when shorts are forced to cover into strength. If net shorts start dropping fast during a push through $200, that’s often the “fuel burn” phase where the squeeze matures and the move can stall.
Read also: If You Put $5,000 Into Bittensor (TAO) Today, What Happens by 2027?
TAO price prediction: what comes next
The TAO price looks bullish on structure, but the next 24–72 hours depend on how price behaves around $200.
- Bull case: A clean break and hold above $200 opens the door to $210–$215 quickly, with $230–$240 as the next larger target band if momentum stays hot and the squeeze keeps unwinding.
- Base case: A pullback into $185–$188 that holds turns into a retest-and-go setup. That’s a healthy continuation pattern after a vertical candle stack.
- Bear case: Losing $185 puts $170–$175 back in play, and a deeper unwind can drag price toward $150–$155 if the broader market turns risk-off.
Right now, the chart reads like a breakout that got traction fast, and the narrative catalysts explain the urgency behind the bid. The next confirmation is simple: $200 flips from resistance into support, then the market starts hunting the next liquidity pockets overhead.