Can HBAR stay above $0.1 after breaking through the key resistance level?
The structure of HBAR’s price began to change significantly as the price was compressed below the long-term downtrend line and the horizontal resistance at $0.10 – where continuous selling pressure limited upward momentum.
Within the $0.073–$0.090 price range, buying pressure gradually absorbed supply, forming higher lows, signaling weakening from the sellers. Momentum then surged strongly, and a weekly close above the $0.10 threshold confirmed a breakout in structure as well as a move beyond the downtrend line.
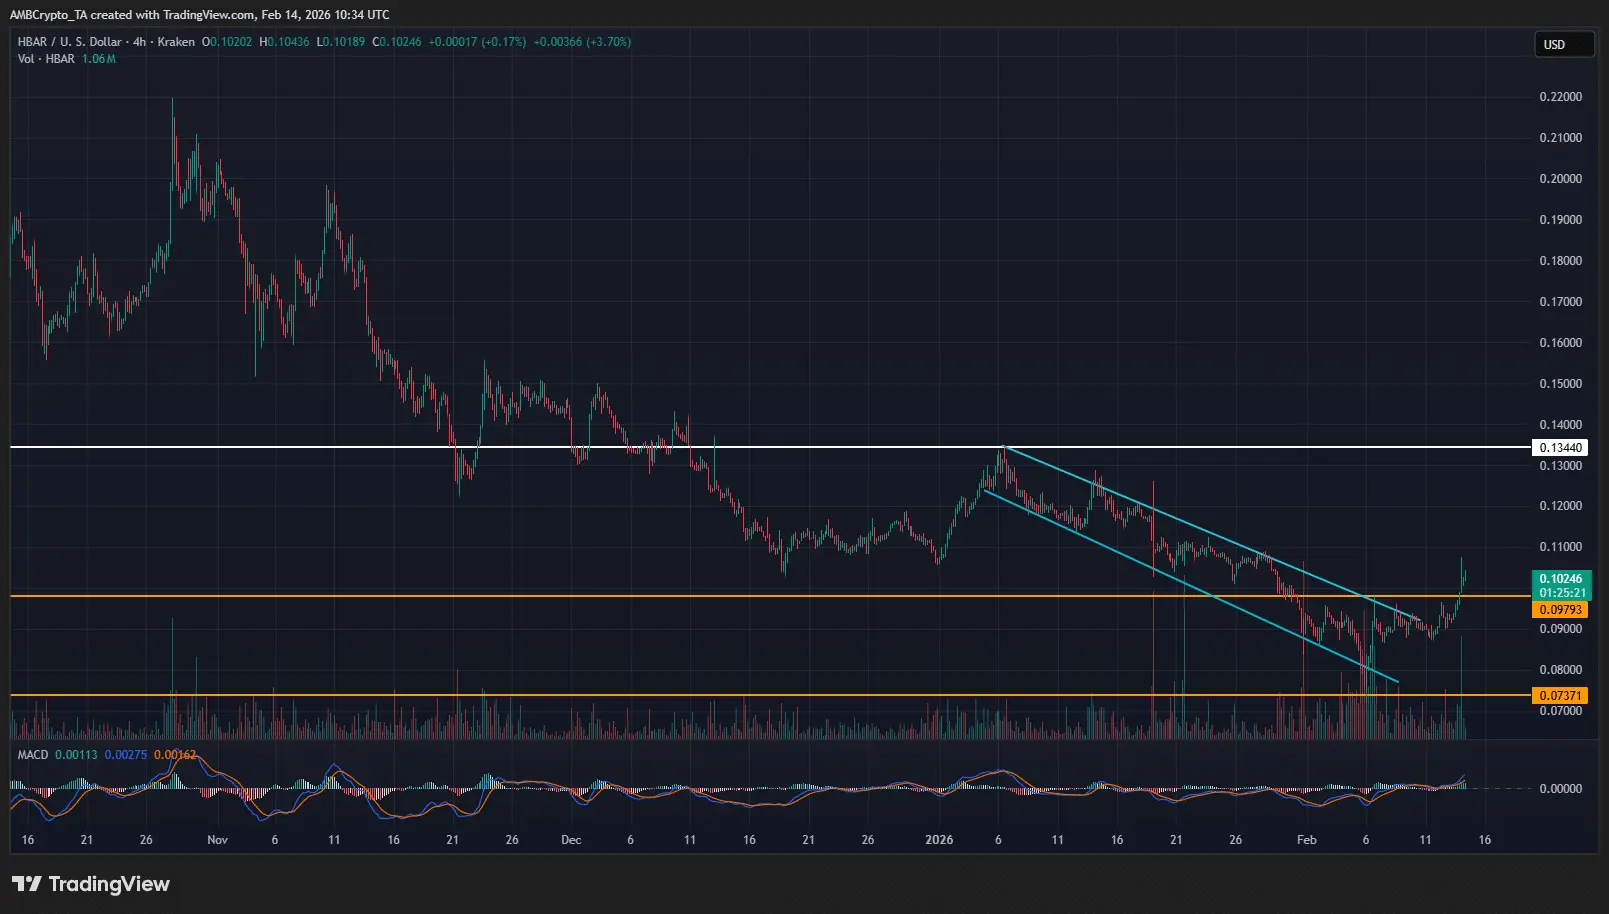 Source: TradingView Continued buying pressure pushed the price up to $0.134, marking the first higher high since the downtrend began. Although rejection wicks appeared at this supply zone, corrections remained above the key support area of $0.097–$0.10, indicating a shift from resistance to support rather than a breakout.
Maintaining above the old resistance level confirmed market acceptance, while defending higher lows further strengthened the reversal signal on higher timeframes. The combination of a breakout, support turn, and the formation of higher highs and higher lows marked the transition from distribution to an initial bullish trend.
Factors Driving the Bullish Momentum of HBAR
As the bullish structure becomes more complete, trading volume and leveraged capital flows began to accelerate sharply. Hedera [HBAR] saw a significant increase in trading volume during the recovery phase, especially after global logistics giant FedEx joined Hedera’s council. Spot trading volume surged over 43%, surpassing $200 million.
Alongside this, the price increased by 7% and reclaimed key moving averages, reinforcing strong buyer confidence in the new trend. Demand originating from the support zone of $0.09 indicates natural accumulation rather than a speculative rotation.
This rally also aligns with the “inverse head and shoulders” pattern, as trading volume increased notably at the neckline breakout, further validating the pattern’s legitimacy and sustainability.
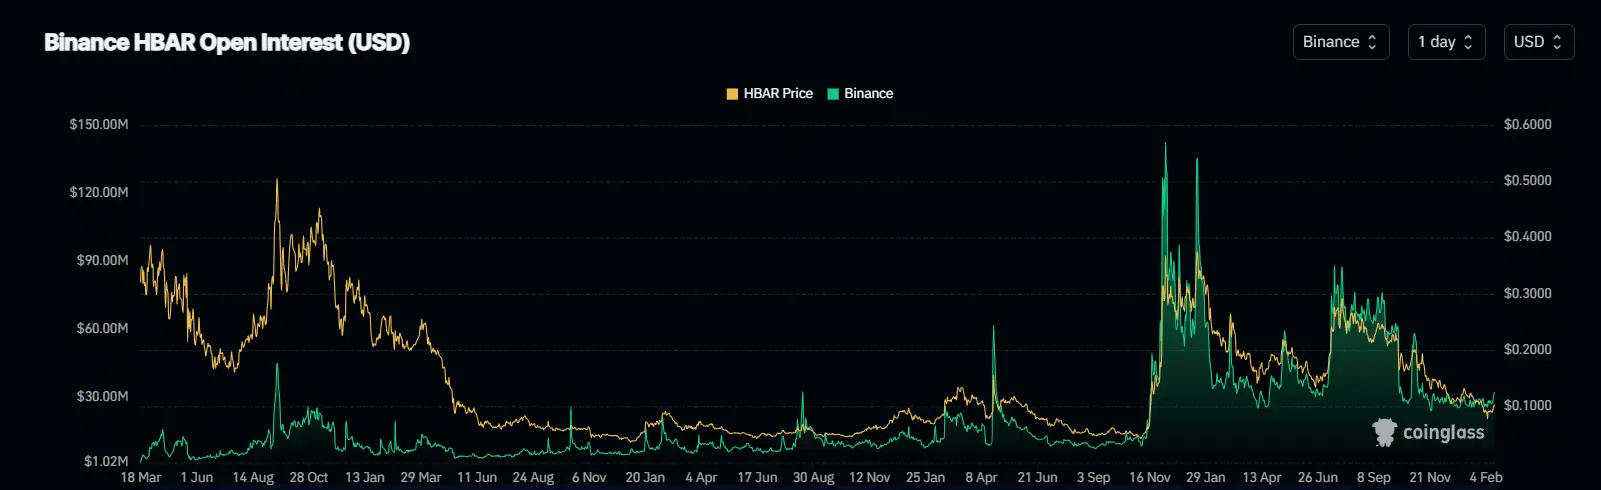 Source: CoinGlass The derivatives market also provides additional insights. Open interest in futures contracts increased by 9%, reaching nearly $29 million within just two days from February 11 to 12. Meanwhile, funding rates turned positive at +0.05%, indicating that long leveraged positions are rising sharply.
Although leverage has significantly amplified the bullish momentum, it also introduces concentrated risk. High open interest increases the likelihood of a squeeze if prices hold, but also raises the risk of a correction if spot demand weakens.
HBAR: Reversal Momentum Is Forming
Currently, HBAR remains under significant downward pressure on a larger scale as the price trades below the descending trendline from the $0.21 peak in November 2025. Sellers continue to defend the lower high structure, but demand is beginning to rebuild near the bottom zone of $0.078.
Buyers are now pushing the price into the supply zone of $0.10–$0.104 after breaking the short-term market structure within the $0.090–$0.102 range. If the price closes above $0.10, the next target for buyers is likely the resistance corridor of $0.11–$0.134. Continued buying strength would confirm a strong breakout and extend the higher lows sequence.
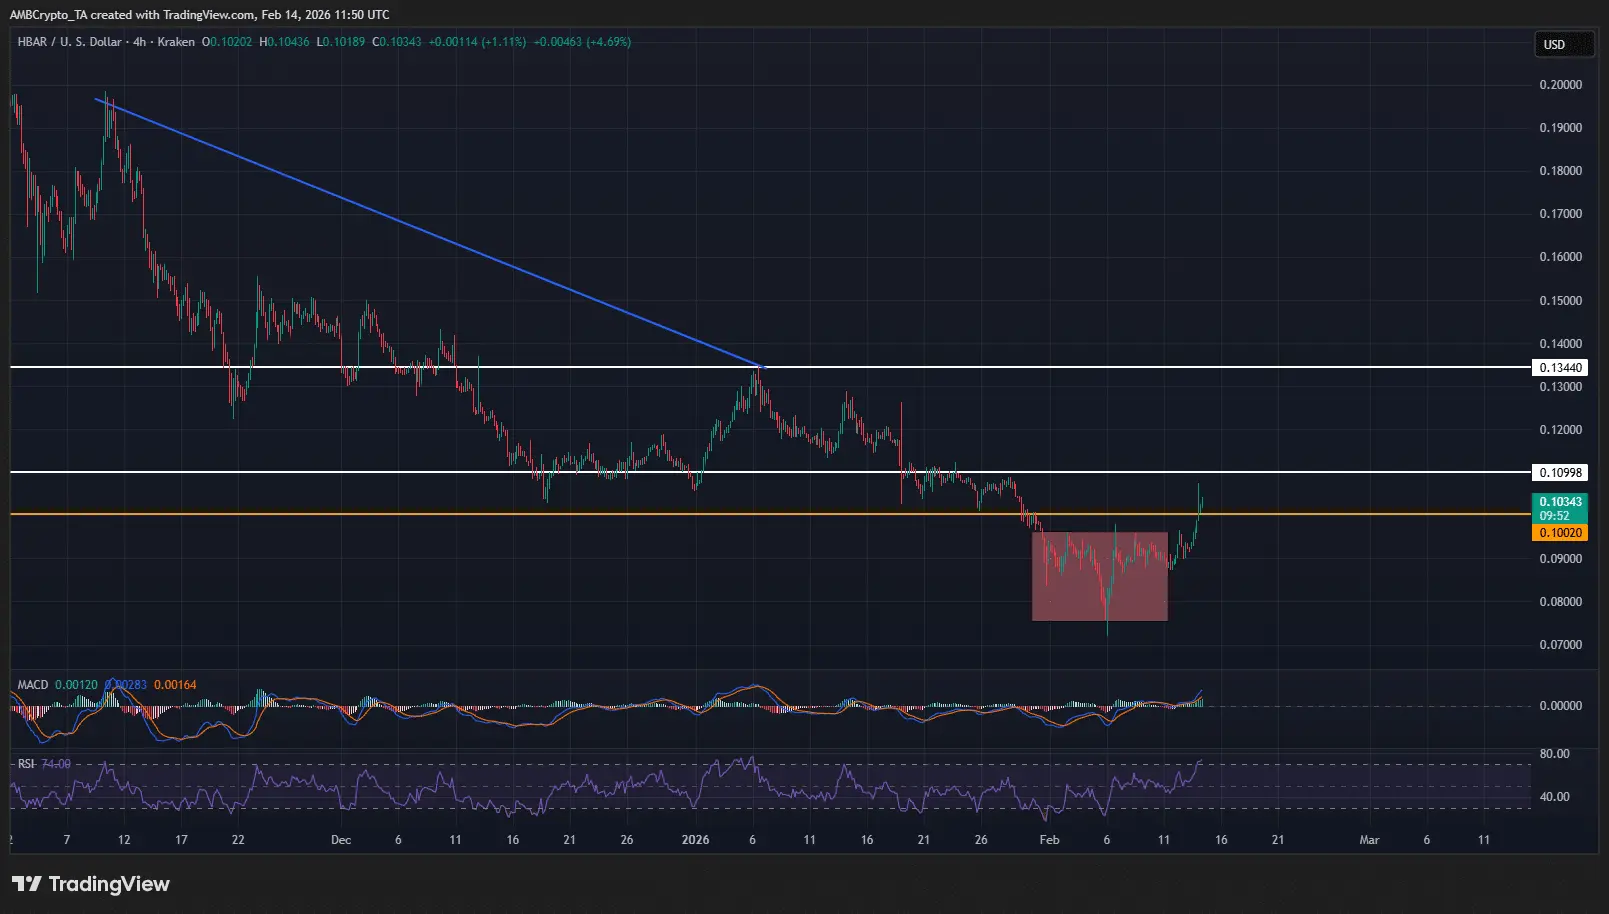 Source: TradingView However, rejection wicks near the $0.104–$0.107 zone indicate that supply remains active. If sellers push the price below the support zone of $0.098–$0.10, the breakout scenario could be invalidated. In this case, the price may fall back to $0.090 or revisit the demand zone at $0.078.
Currently, HBAR’s price structure is at a critical juncture, where confirmation above the supply zone will determine whether the reversal momentum continues to expand or weakens.